reliefweb.intreliefweb.int/sites/reliefweb.int/files/resources/Regional Report...reliefweb.int
Project funded by the European Union
THE UN MIGRATION AGENCY
IOM OIM
IOM LIBYA MIGRANT REPORT
ROUND 38
July - September 2021

© 2021 International Organization for Migration (IOM)
All rights reserved. No part of this publication may be reproduced, stored in a retrieval system, or transmitted in any form or by any means, electronic, mechanical, photocopying, recording, or otherwise without the prior written permission of the International Organization for Migration (IOM).
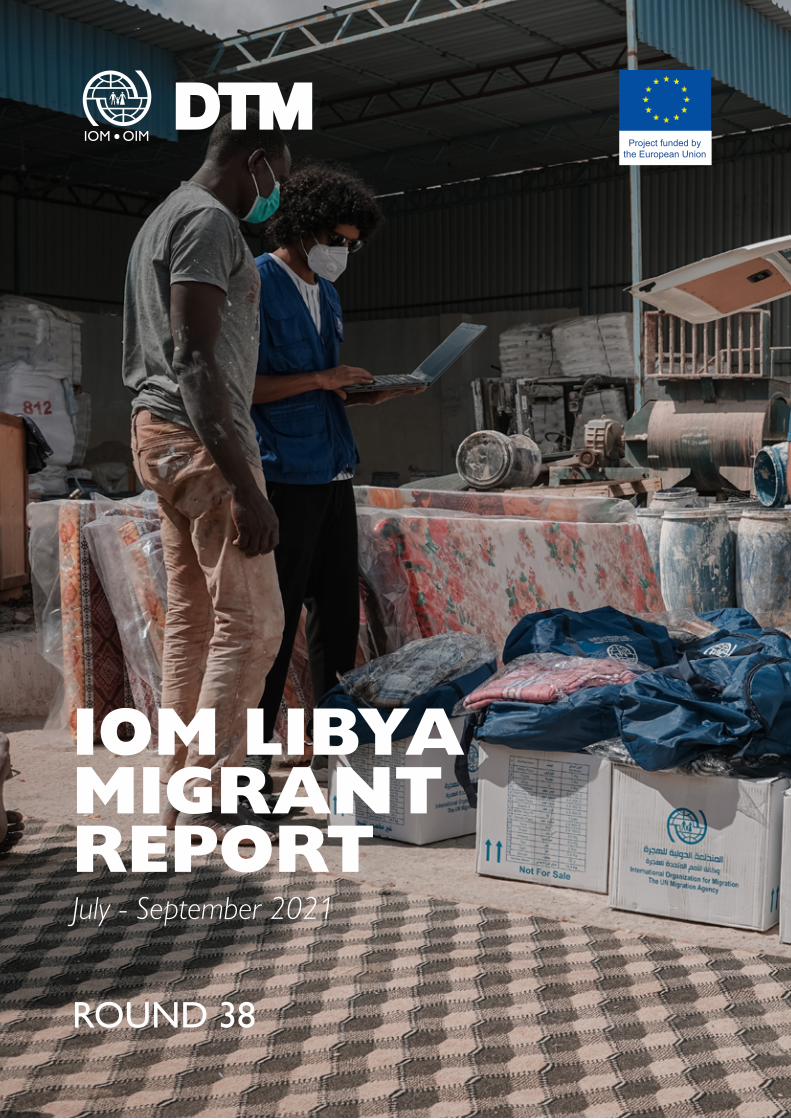
Photo: In September, IOM’s Migrant Resource and Response Mechanism (MRRM) mobile teams provided assistance to migrants
in Ain Zara, Libya.
© Moayad Zaghdani / IOM 2021

Contents
Overview ...............................................................................................................................4
Migrant Vulnerability and Humanitarian Needs ........................................8
Migration Flows ...............................................................................................................13
Migration Routes to Libya .........................................................................................17
Regional Analysis - Distribution ............................................................................22
Regional Analysis - Nationalities of Migrants ..............................................23
Region of Origin Analysis...........................................................................................24
North and Sub-Saharan Africa ..............................................................................25
Middle East and South Asia .....................................................................................27
Maritime Incidents ..........................................................................................................29
Methodology .......................................................................................................................30
DISPLACEMENT TRACKING MATRIX | LIBYA
DTM LIBYA ROUND 384
Violence or persecution
OVERVIEW
DTM Libya identified a total of 610,128 migrants from over 44 nationalities in the 100 Libyan municipalities during Round 38 of data collection (July – September 2021).
The number of migrants has continued to increase during the reporting period, continuing a trend which started in January 2021. However, the number of migrants in Libya continues to remain slightly lower than pre-pandemic levels and significantly below that of 2019 for the corresponding period of time (655,144 migrants present during June - July 2019; Round 26). Before the beginning of 2021, the migrant population in Libya had decreased consistently following the onset of the COVID-19 pandemic and the subsequent economic downturn which resulted in increased unemployment, a reduction in available labour opportunities, tightened security controls and mobility restrictions.
Employment and labour market While the security situation in Libya remains calm but fragile, the economic situation continues to be hampered by years of conflict and the added burden of the pandemic, which is also affecting migrants. According to Labour Force Survey data as referenced in a newly published labour market assessment, migrant workers are estimated to represent around a third of the work force in Libya. Yet, the unemployment rate among migrants, while on par with the previous reporting period (20%) is still higher than pre-pandemic levels (17% in February 2020).
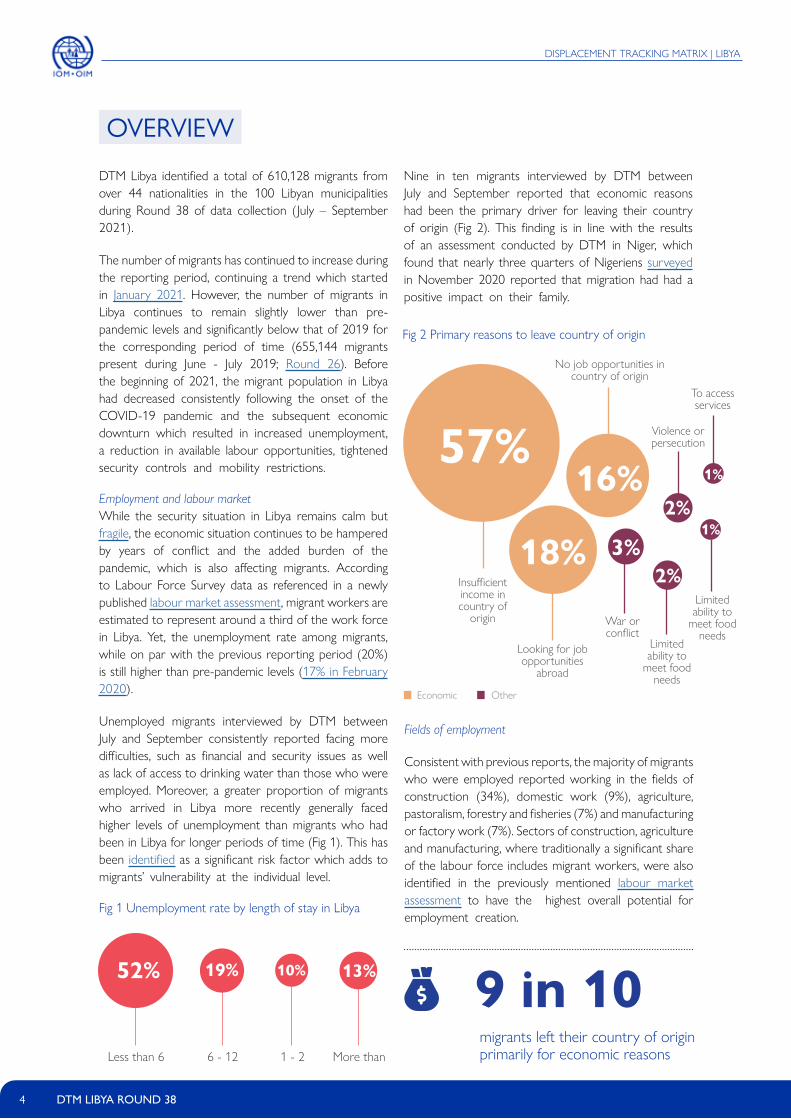
Unemployed migrants interviewed by DTM between July and September consistently reported facing more difficulties, such as financial and security issues as well as lack of access to drinking water than those who were employed. Moreover, a greater proportion of migrants who arrived in Libya more recently generally faced higher levels of unemployment than migrants who had been in Libya for longer periods of time (Fig 1). This has been identified as a significant risk factor which adds to migrants’ vulnerability at the individual level.
Nine in ten migrants interviewed by DTM between July and September reported that economic reasons had been the primary driver for leaving their country of origin (Fig 2). This finding is in line with the results of an assessment conducted by DTM in Niger, which found that nearly three quarters of Nigeriens surveyed in November 2020 reported that migration had had a positive impact on their family.
Less than 6 months
6 - 12 months
1 - 2 years
More than 2 years
52% 19% 10% 13%
Fig 1 Unemployment rate by length of stay in Libya
Fig 2 Primary reasons to leave country of origin
57%
18%
16%
Insufficient income in country of
origin
Looking for job opportunities
abroad
War or conflict
Limited ability to
meet food needs
Limited ability to
meet food needs
No job opportunities in country of origin
To access services
Fields of employment
Consistent with previous reports, the majority of migrants who were employed reported working in the fields of construction (34%), domestic work (9%), agriculture, pastoralism, forestry and fisheries (7%) and manufacturing or factory work (7%). Sectors of construction, agriculture and manufacturing, where traditionally a significant share of the labour force includes migrant workers, were also identified in the previously mentioned labour market assessment to have the highest overall potential for employment creation.
3%
2%
2%
1%
1%
Economic Other
9 in 10migrants left their country of origin primarily for economic reasons
DISPLACEMENT TRACKING MATRIX | LIBYA
DTM LIBYA ROUND 385
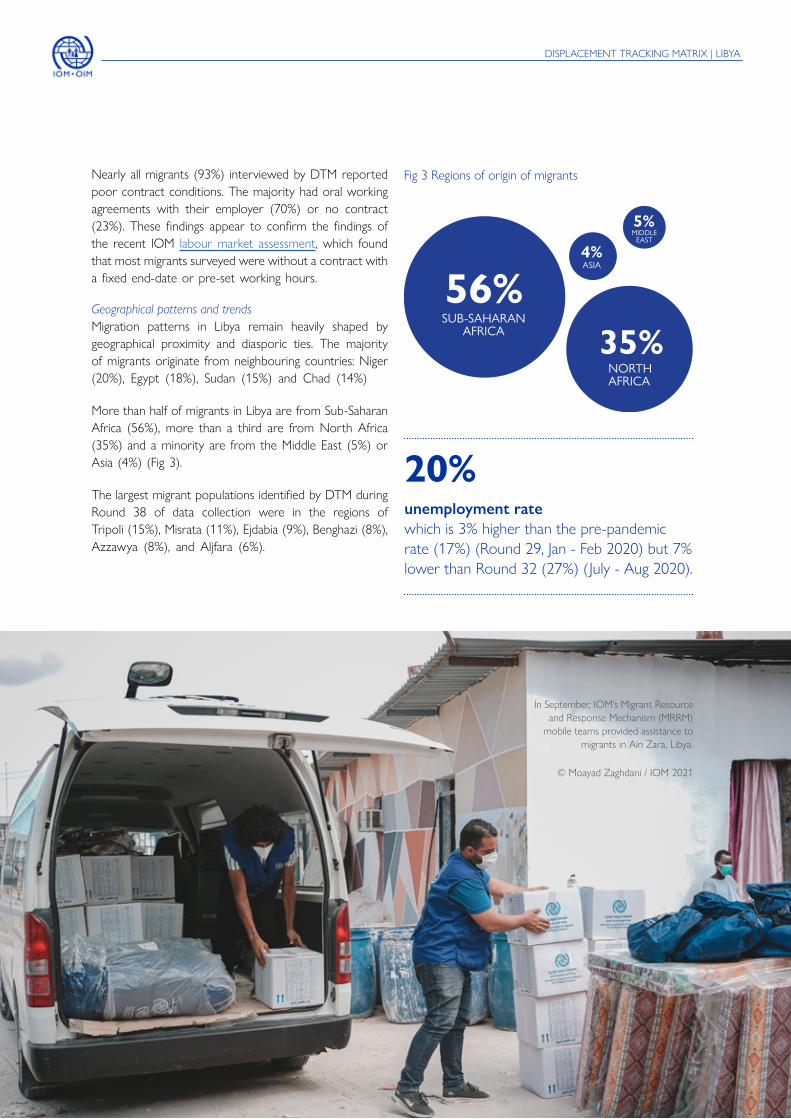
Fig 3 Regions of origin of migrants
56%SUB-SAHARAN
AFRICA
ASIA 4%
MIDDLE EAST
5%
35%NORTHAFRICA
20%unemployment ratewhich is 3% higher than the pre-pandemic rate (17%) (Round 29, Jan - Feb 2020) but 7% lower than Round 32 (27%) (July - Aug 2020).
Nearly all migrants (93%) interviewed by DTM reported poor contract conditions. The majority had oral working agreements with their employer (70%) or no contract (23%). These findings appear to confirm the findings of the recent IOM labour market assessment, which found that most migrants surveyed were without a contract with a fixed end-date or pre-set working hours.
Geographical patterns and trends Migration patterns in Libya remain heavily shaped by geographical proximity and diasporic ties. The majority of migrants originate from neighbouring countries: Niger (20%), Egypt (18%), Sudan (15%) and Chad (14%)
More than half of migrants in Libya are from Sub-Saharan Africa (56%), more than a third are from North Africa (35%) and a minority are from the Middle East (5%) or Asia (4%) (Fig 3).
The largest migrant populations identified by DTM during Round 38 of data collection were in the regions of Tripoli (15%), Misrata (11%), Ejdabia (9%), Benghazi (8%), Azzawya (8%), and Aljfara (6%).
In September, IOM’s Migrant Resource and Response Mechanism (MRRM)
mobile teams provided assistance to migrants in Ain Zara, Libya.
© Moayad Zaghdani / IOM 2021

JULY - SEPTEMBER 2021
MIGRANT REPORT
Fig 4 Number of migrants per region (mantika) during DTM Round 38 data collection.
This map is for illustration purposes only. Names and boundaries on this map do not imply official endorsement or acceptance by IOM.
Alkufra
Ghat Ubari
Misrata
Sebha
Azzawya
Benghazi
Almarj
Al Jabal Al Akhdar
Derna
Tobruk
Ejdabia
Sirt
Alkufra
Murzuq
Aljufra
Sebha
UbariGhat
Wadi Ashshati
Al Jabal Al GharbiNalut
Zwara
Azzawya
Misrata
Almargeb
Tripoli
Aljfara
1
1
90,954
9,750
9,903
8,900
11,948
14,33069,308
10,398
9,855
5,491
26,599
14,825
2,916
36,053
24,225
57,355
28,588
15,000
48,643
47,258
38,22729,602

DISPLACEMENT TRACKING MATRIX | LIBYA
DTM LIBYA ROUND 387
Project funded by the European Union
KEY FINDINGS
ChildrenAccompanied
Men
Unaccompanied
Women
Adults
DemographicsTop 5 nationalities
Distribution of migrants per geographical areas
610,128migrants in Libya
Round 38 (July - September 2021)
9%7%
81%
2%
10%91%
migration journey cost (average per person)
of migrants reported that the remittances they send home are the primary source of income for their household
municipalities
communities
Migrants were present in:
Interviews with key informants
100
630
(out of 100)
(out of 667)1,821
100%coverage
US$ 909
38%
Interviews with migrants(Flow Monitoring Surveys)
7,824
West56%
South17%
27%East
Niger
Egypt
Sudan
Nigeria
Chad
20%
18%
15%
14%
6%
JULY - SEPTEMBER 2021
MIGRANT REPORT
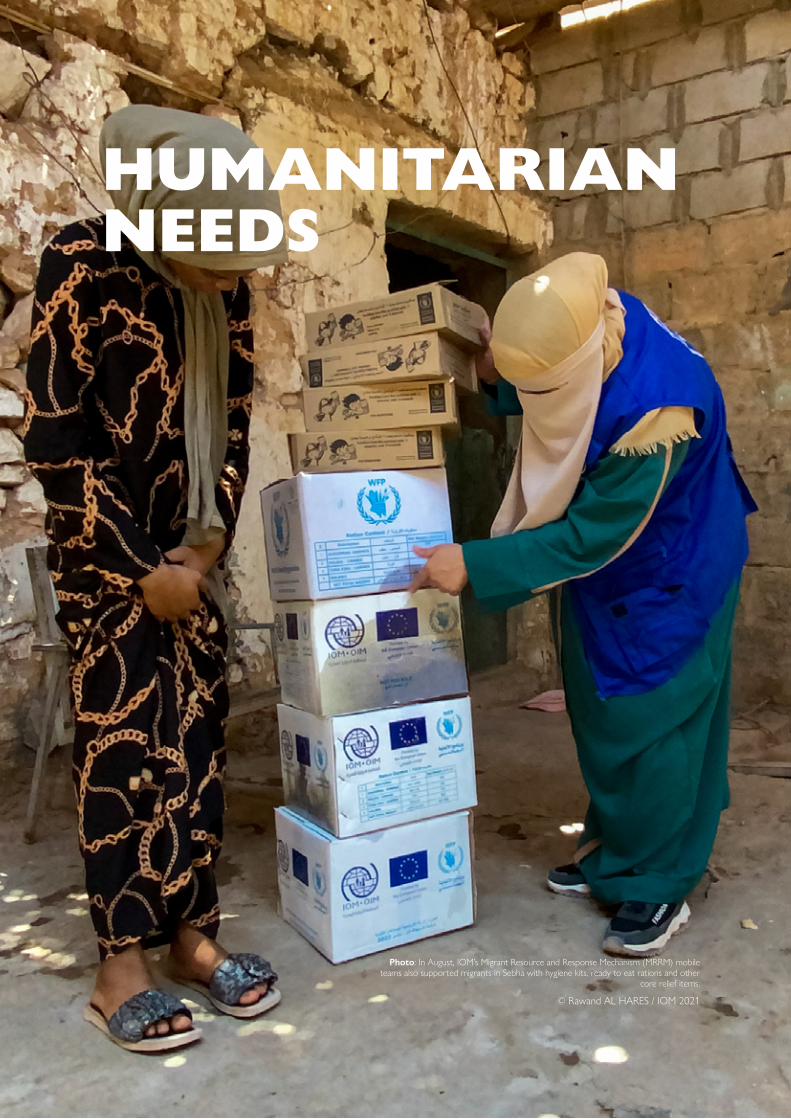
HUMANITARIAN NEEDS
Photo: In August, IOM’s Migrant Resource and Response Mechanism (MRRM) mobile teams also supported migrants in Sebha with hygiene kits, ready to eat rations and other
core relief items.
© Rawand AL HARES / IOM 2021

DISPLACEMENT TRACKING MATRIX | LIBYA
DTM LIBYA ROUND 389
MIGRANT VULNERABILITY AND HUMANITARIAN NEEDS
Food security also continues to be a concern for many migrants. A joint WFP and IOM report estimates that one in five migrants is food insecure. Moreover, while the cost of essential food and non-food items increased by 2 per cent between June and July, mainly driven by cooking fuel prices, overall it remains more than 13 per cent more expensive to buy food and non-food items than prior to the pandemic in March 2020.
Interviews with 1,821 key informants across Libya between July and September 2021 highlighted that the primary needs of migrants were centred around health services (83%), NFIs (52%), accommodation (28%) and Water, Sanitation and Hygiene (WASH) (20%). Consistent with previous reports, key informant interviews highlighted that cost and affordability of food and other essential items as well as housing and services, such as health care, remain the main hurdles for the majority of migrants to fulfil their needs.
Fig 5 Humanitarian priority needs of migrants per region (mantika)
This map is for illustration purposes only. Names and boundaries on this map do not imply official endorsement or acceptance by IOM.
AzzawyaHealth Shelter
WASH
Education
Non Food Items
Legal help
Food security
Security
Benghazi
AlmarjAl Jabal Al Akhdar
Derna
Tobruk
Ejdabia
Sirt
Alkufra
Murzuq
Aljufra
Sebha
UbariGhat
Wadi Ashshati
Al Jabal Al GharbiNalut
Zwara
Azzawya
Misrata
Almargeb
Tripoli
Aljfara
1
1
Legend

JULY - SEPTEMBER 2021
MIGRANT REPORT
Health
In line with previous reports, over three quarters (77%) of migrants reported lacking access to basic healthcare, including emergency services. Limited or lack of access to health services was most severe in the West (84%) and South (77%) compared to the East (51%).
In August, while the COVID-19 positivity rates decreased in the West, they increased in the South from 60 to 70 per cent, well above WHO recommended rates (5%).
Fig 6 Migrants’ reported access to health services (sample size 7,824 interviews)
80%
77%
of migrants who reported lacking access to health care reported that affordability was amongst the main issues they faced.
No access
Limited access
of migrants have limited or no
access to health services
Full access
23%
70%
7%
A recent OHCHR report found that during the COVID-19 pandemic inadequate living conditions, existing barriers to health care access and discrimination disproportionally prevented migrants from accessing health care services, already weakened by years of conflict.
A recent IOM assessment conducted in collaboration with the Libyan National Centre for Disease Control and WHO, found that six per cent of the 391 interviewed migrants reported disease syndromes, including respiratory infections, jaundice and diarrheal disease. Migrants were surveyed at key transit locations in Bani Waleed, Ubari, Sebha, Algatroun, Emsaed and Alkufra.
There are an estimated 301,026 migrants in need of health assistance according to the 2022 health sector humanitarian needs overview.
WASH
In line with previous reports, one in five migrants (21%) reported not having sufficient clean drinking water, compromising their health and hygiene levels. The situation remains most particularly dire in the South (64%) compared to the West (17%) or East (8%).
OCHA reports that the sanitation and sewage network in the South are widely damaged, which has affected the supply of drinking water and public health. In parallel, in July, WHO reported that the highest COVID-19 transmissions rates were in the South and that the number of cases and deaths remained very high in most districts in August. The provision of water, sanitation and hygienic condition is key to protecting health during all infectious disease outbreaks, including the current COVID-19 pandemic.
Migrants interviewed by DTM between July and September 2021 reported that their main sources of drinking water were bottled water (60%) and the public water network (49%) while a minority also mentioned using protected wells (19%), water trucking (16%) or public outdoor taps (14%).
A total of 22 per cent of migrants mentioned having irregular or a lack of access to the public water network. In July, major damage to the water network in Benghazi and an attack which destroyed some of the water system infrastructure in Aljfara resulted in the disruption of services for an estimated 1.5 million or more people.In August, the obstruction of the eastern branch of the Man-Made River, which provides 60 per cent of
In addition, the Libya Health sector reports the worsening of the health situation in the South compounded by shortages of fuel for health facilities, power cuts, cash liquidity issues and the deterioration of the security situation, especially in Sebha.
Based on key informant interviews, the primary obstacle to migrants’ ability to access health services was the affordability of care. In addition, the inability for migrants to access services (e.g. being denied care) and the inadequate quality of services were also mentioned as being issues.

DISPLACEMENT TRACKING MATRIX | LIBYA
DTM LIBYA ROUND 3811
Remittances are understood as the money or goods that non-nationals send back to their families and friends in their countries of origin.
Fig 7 Average amount of remittances sent by migrants
Fig 8 Percentage of migrants who have sent remittances since they have arrived in Libya by length of stay in the country
all freshwater used in Libya, forced its closure, which jeopardized levels of health and hygiene among the population and increased the risk of community diseases to spread, according to UNICEF.
Remittances
Nearly one in three migrants (29%) interviewed by DTM between July and September 2021 reported having sent money home. An additional 34 per cent of migrants reported that while they had not yet done so they intended to send remittances in the future. Respondents reported having sent a monthly average of 96 US$ home in July, August and September 2021, which is lower than both the 2019 and 2020 average of 146 US$ and 123 US$, respectively (Fig 7).
A recent DTM study on remittances identified that the factors preventing migrants from sending remittances included a lack of (stable) employment or inadequate earnings (given that migrants generally aim to accumulate savings before sending remittances) and a lack of reliable money transfer services. Moreover, findings from DTM Niger highlight that nearly three quarters of households surveyed (73%) in November 2020 reported that the amount of money they received from a family member
abroad had decreased since the start of the public health crisis. The assessment also showed that 69 per cent of Nigerien households surveyed mentioned a decrease in the frequency of remittances received since mid-March 2020, coinciding with the beginning of the COVID-19 pandemic. As a result, nearly a third of surveyed households quoted a reduction on food expenses, including the quantity and quality of food.
The proportion of migrants who reported sending remittances was significantly greater among those who were employed (41%) compared to those who were unemployed (13%). However, more than half of unemployed migrants (52%) reported their intention to send money home in the future compared to 22 per cent of employed migrants.
Similarly, a greater proportion of migrants who have been in Libya for a longer period reported sending remittances than those who have arrived in Libya more recently (Fig 8). For example, 7 per cent of migrants who reported having been in Libya for less than six months had sent remittances compared to 45 per cent of those who had been in Libya for more than two years.
A total of 38 per cent of migrants reported that the remittances they send home are their household’s primary source of income and help cover various expenses, such as food, family, rent and utilities and contribute to building their savings, investments or paying off debts.
146 US$
123 US$
96 US$
2019
2020
2021 (July-September)
Sent remittances No, but I intend to send money home in future
No, and I don’t intend to send money home
< 6 months
6-12 months
1-2 years
> 2 years
7%
35% 39%
75%
43%
25%
18%
25%
17%
30%
39%
45%
1 in 5migrants reported not having sufficient clean drinking water compromising their health and hygiene levels.
JULY - SEPTEMBER 2021
MIGRANT REPORT
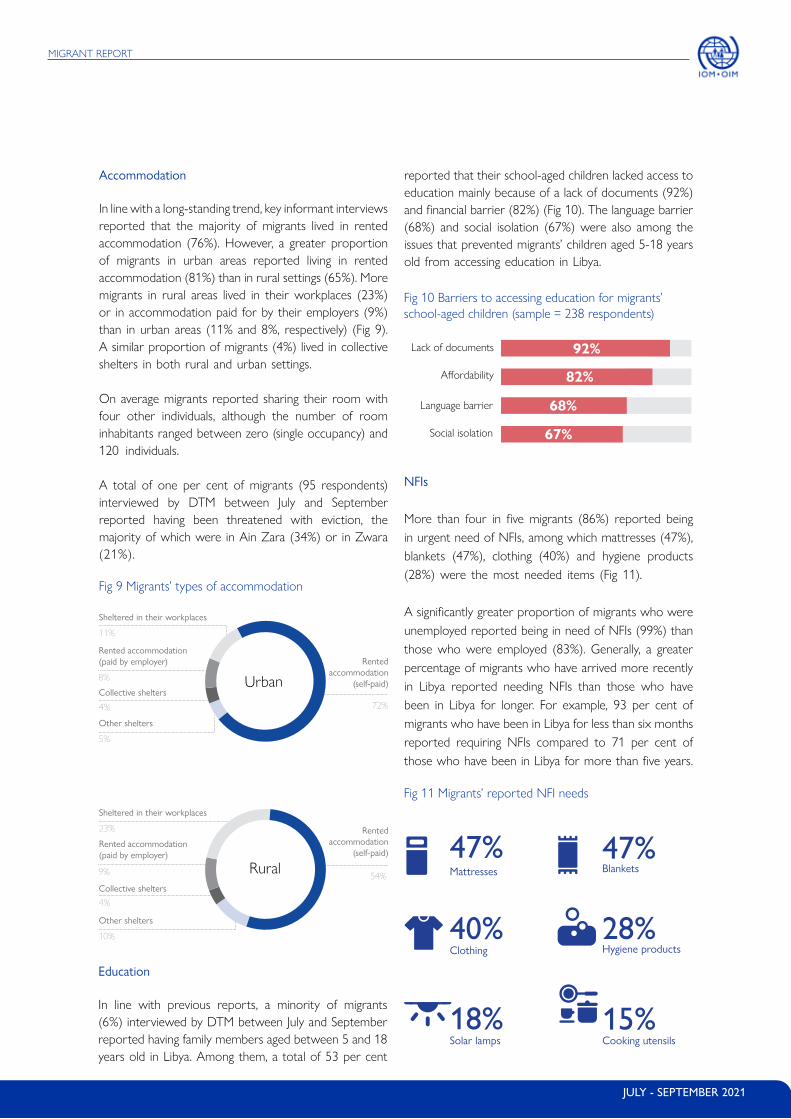
Fig 10 Barriers to accessing education for migrants’ school-aged children (sample = 238 respondents)
Accommodation
In line with a long-standing trend, key informant interviews reported that the majority of migrants lived in rented accommodation (76%). However, a greater proportion of migrants in urban areas reported living in rented accommodation (81%) than in rural settings (65%). More migrants in rural areas lived in their workplaces (23%) or in accommodation paid for by their employers (9%) than in urban areas (11% and 8%, respectively) (Fig 9). A similar proportion of migrants (4%) lived in collective shelters in both rural and urban settings.
On average migrants reported sharing their room with four other individuals, although the number of room inhabitants ranged between zero (single occupancy) and 120 individuals.
A total of one per cent of migrants (95 respondents) interviewed by DTM between July and September reported having been threatened with eviction, the majority of which were in Ain Zara (34%) or in Zwara (21%).
Fig 9 Migrants’ types of accommodation
Other shelters
Other shelters
Rented accommodation (paid by employer)
Rented accommodation (paid by employer)
Sheltered in their workplaces
Sheltered in their workplaces
Collective shelters
Collective shelters
Rented accommodation
(self-paid)
Rented accommodation
(self-paid)
5%
10%
4%
4%
11%
23%
8%
9%
72%
54%
Urban
Rural
92%
82%
68%
67%
Lack of documents
A�ordability
Language barrier
Social isolation
Education
In line with previous reports, a minority of migrants (6%) interviewed by DTM between July and September reported having family members aged between 5 and 18 years old in Libya. Among them, a total of 53 per cent
Fig 11 Migrants’ reported NFI needs
47%Mattresses
Solar lamps
47%Blankets
Cooking utensils
28%Hygiene products
18%
40%Clothing
15%
NFIs
More than four in five migrants (86%) reported being in urgent need of NFIs, among which mattresses (47%), blankets (47%), clothing (40%) and hygiene products (28%) were the most needed items (Fig 11).
A significantly greater proportion of migrants who were unemployed reported being in need of NFIs (99%) than those who were employed (83%). Generally, a greater percentage of migrants who have arrived more recently in Libya reported needing NFIs than those who have been in Libya for longer. For example, 93 per cent of migrants who have been in Libya for less than six months reported requiring NFIs compared to 71 per cent of those who have been in Libya for more than five years.
reported that their school-aged children lacked access to education mainly because of a lack of documents (92%) and financial barrier (82%) (Fig 10). The language barrier (68%) and social isolation (67%) were also among the issues that prevented migrants’ children aged 5-18 years old from accessing education in Libya.
DISPLACEMENT TRACKING MATRIX | LIBYA
DTM LIBYA ROUND 3813
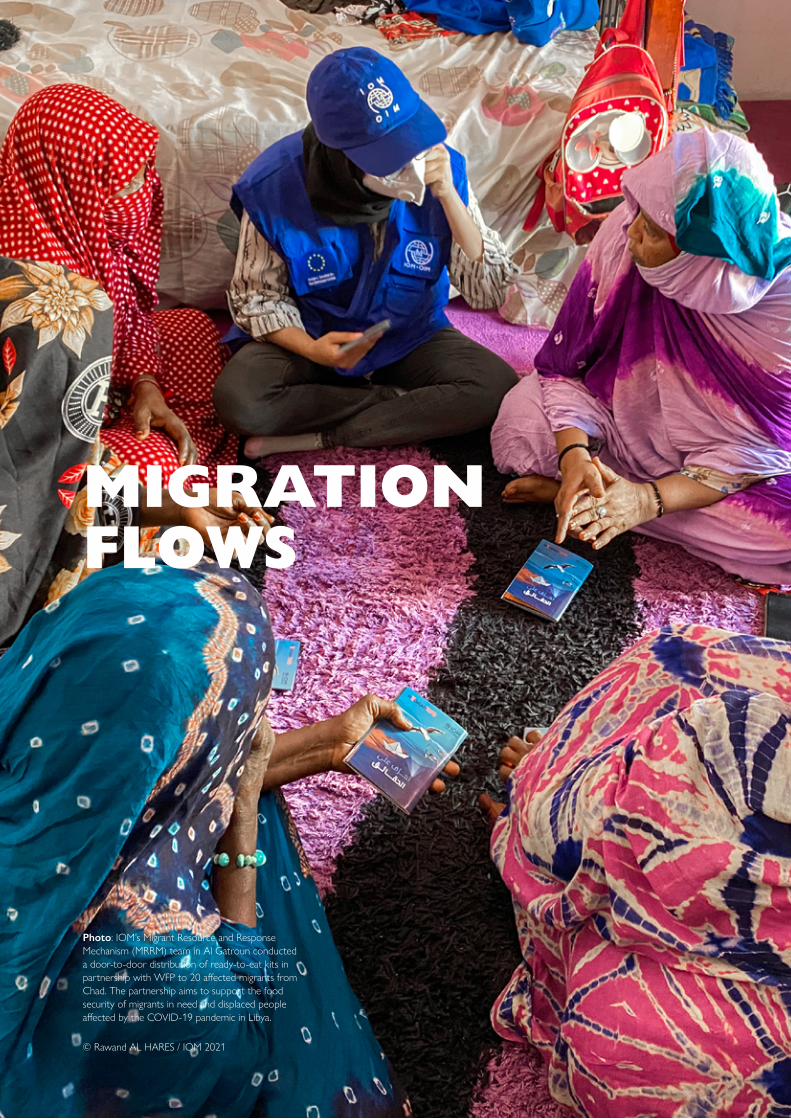
Photo: IOM’s Migrant Resource and Response Mechanism (MRRM) team in Al Gatroun conducted a door-to-door distribution of ready-to-eat kits in partnership with WFP to 20 affected migrants from Chad. The partnership aims to support the food security of migrants in need and displaced people affected by the COVID-19 pandemic in Libya.
© Rawand AL HARES / IOM 2021
MIGRATION FLOWS
JULY - SEPTEMBER 2021
MIGRANT REPORT
Flow monitoring points in numbers
MIGRATION FLOWS
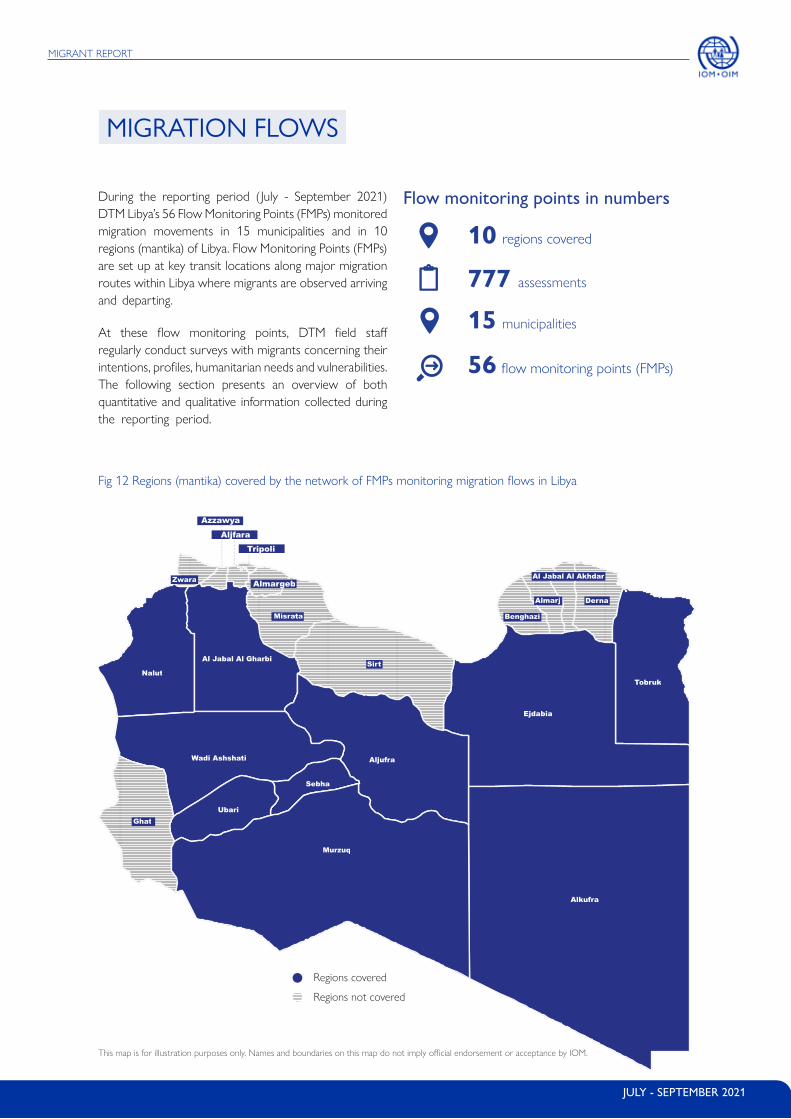
During the reporting period (July - September 2021) DTM Libya’s 56 Flow Monitoring Points (FMPs) monitored migration movements in 15 municipalities and in 10 regions (mantika) of Libya. Flow Monitoring Points (FMPs) are set up at key transit locations along major migration routes within Libya where migrants are observed arriving and departing.
At these flow monitoring points, DTM field staff regularly conduct surveys with migrants concerning their intentions, profiles, humanitarian needs and vulnerabilities. The following section presents an overview of both quantitative and qualitative information collected during the reporting period.
Fig 12 Regions (mantika) covered by the network of FMPs monitoring migration flows in Libya
10 regions covered
777 assessments
56 flow monitoring points (FMPs)
15 municipalities
This map is for illustration purposes only. Names and boundaries on this map do not imply official endorsement or acceptance by IOM.
Benghazi
Almarj
Al Jabal Al Akhdar
Derna
Tobruk
Ejdabia
Sirt
Alkufra
Murzuq
Aljufra
Sebha
UbariGhat
Regions not covered
Regions covered
Wadi Ashshati
Al Jabal Al Gharbi
Nalut
Zwara
Misrata
Azzawya
Almargeb
Tripoli
Aljfara

DISPLACEMENT TRACKING MATRIX | LIBYA
DTM LIBYA ROUND 3815
ANALYSIS OF MIGRATION FLOWS & PRESENCE
EASTERN LIBYA
Benghazi
The number of migrants observed in the municipality of Benghazi during Round 38 of data collection increased by seven per cent in comparison to Round 37 data collection, from 34,402 migrants to 36,889 migrants.
Field observers also noted an increase in the number of nationals of Egypt, Syria and Bangladesh arriving by air to Benina airport as access has reportedly become easier.
According to key informants, many Egyptians come to Libya on a seasonal basis to work in the sector of fisheries from the end of July until October. Others find employment in the construction and crafts sector.
A recently published DTM study on circular migration highlighted that the majority of migrants who engage in circular migration were from Libya’s neighbouring countries. A total of 79 per cent of seasonal migrants interviewed by DTM in the East were Egyptians.
In parallel, during the reporting period, field observers noticed a significant number of migrants attempting to cross the Central Mediterranean Sea by boat leaving from Benghazi but who failed to make the journey.
Jalu
During the reporting period, the number of migrants in the municipality of Jalu remained largely stable (16,000 migrants during Round 38 compared to 15,995 migrants during Round 37).
The municipality of Jalu has become an important transit point connecting the Libyan southern borderland to the northern coastal regions. During the reporting period, field observers noted an increase in the number of migrants – particularly from Bangladesh and Ethiopia -- transiting through flow monitoring points.
Several Egyptian migrants come to Jalu at the start of the summer season to work in the sectors of agriculture and construction. Migrants in Jalu represent around 80% of work force of the local labour market.
The analysis of migration flows is based on the mobility trends observed on the ground during the reporting period, in addition to primary data collected through the Flow Monitoring Points (FMPs).
Photo: A DTM Libya staff member interviews a man in August 2021.
© Moayad ZAGHDANI / IOM 2021

JULY - SEPTEMBER 2021
MIGRANT REPORT
WESTERN LIBYA
MisrataDuring the reporting period, the number of migrants identified in Misrata rose by 23 per cent from 46,755 during Round 37 to 57,483 during Round 38.
In July, restrictions were implemented to address the spread of COVID-19 in Misrata. For example, the local authorities introduced a partial lockdown and closed many restaurants and supermarkets. These measures negatively affected the livelihoods of migrants throughout the month of July.
In August and September, the partial lockdown in Misrata was lifted, encouraging more migrants to look for job opportunities in the municipality. However, the number of available labour opportunities has not matched the increased demand for employment driven by migrant workers.
Qasr AkhyarIn Qasr Akhyar, the number of migrants identified during Round 38 nearly doubled in comparison to Round 37, from 2630 to 5,150 migrants.
In July, the local authorities implemented a partial lockdown in Qasr Akhyar due to an increase of COVID-19 cases. According to key informants, both migrants and the Libyan population were affected by the COVID-19 restrictions, and the situation was compounded by the soaring prices of essential goods.
The security situation was stable throughout the reporting period. However, migrants were struggling to fulfil their basic needs due to the lockdown and the decrease in labour opportunities in the construction sector -- one of the main sectors of employment for migrants in Qasr Akhyar. Starting in August 2021, migrants in the municipality have been included in the COVID-19 vaccination campaign.
SOUTHERN LIBYA
Algatroun
During the reporting period, the number of migrants in the municipality of Algatroun dropped by 32 per cent, down from 15,655 in Round 37 to 10,618 in Round 38.
According to field observers, there were reports of robbery and shootings as well as truck accidents involving migrants during the reporting period.
Migrants in Algatroun are predominantly nationals of Sudan, Chad and Niger. A significant proportion of them relies on daily work opportunities or on the sale of agriculture products.
SebhaIn Sebha, the number of migrants increased significantly during Round 38 data collection (from 27,400 migrants during Round 37 to 35,788 during Round 38).
However, according to field reports, the situation in the municipality remains difficult for many migrants. Incidents of armed theft, kidnapping of migrants for ransom and other criminal activities were reported.
The municipality of Sebha also suffers from an economic recession affecting both the Libyan and the migrant populations, and most particularly those who have arrived in the country more recently. Field observers reported migrants struggled with increased food and healthcare costs, as well as rental expenses.
In September, OCHA reported a deterioration of the humanitarian situation in Sebha as the region experiencesd lengthy power cuts, shortages of fuel and surging prices of essential goods. In September, for example, operations were suspended at the Sebha isolation centre, including COVID-19 testing, because of a shortage of fuel.
Fig 13 Distribution of migrants by geographical area
West56%
South17%
27%East

DISPLACEMENT TRACKING MATRIX | LIBYA
DTM LIBYA ROUND 3817
MIGRATION ROUTES TO LIBYA
Libya shares more than 4,300 km of land borders with six countries. This section maps the major migration routes used by migrants from different countries of origin to reach Libya. This analysis is based on 20,701 individual quantitative migrant interviews conducted at key locations including transit points throughout Libya (through DTM Flow Monitoring Surveys (FMS)) between January 2020 and September 2021.
Migrants in Libya are mainly nationals of neighbouring countries, primarily as a result of the interlinkages and kinship networks that developed over time through human mobility, trade as well as cultural and social exchanges between and within populations from Libya’s bordering countries.
Fig 14 Major migration routes reported by migrants interviewed via DTM Flow Monitoring Surveys (FMS)
How to read this map
The percentages shown along each route segment in the map below represent the percentage of migrants reporting to have travelled along the respective route. For example, more than 50 per cent of migrants in Libya reported having arrived directly from or transited through Niger, including almost all migrants from Niger and those from Burkina Faso, Ghana, and Nigeria.
AlgeriaLibya
Mali
SudanChad
Niger
Egypt
Iraq
Saudi Arabia
Ethiopia
Nigeria
Mauritania
Kenya
Somalia
Morocco
Democratic Republic of the CongoCongo
South Sudan
Yemen
Turkey
Cameroon
Gabon
Ghana
Guinea
Tunisia
Uganda
Côte d'Ivoire Central African Republic
Senegal
Burkina Faso
Benin
Spain
Eritrea
Sierra Leone
Liberia
Syria
Gambia
0.6%
0.9%
0.6%
2.6%
50.2
%
1.6%
3.6%
2.4%
11.2
%
Bangladesh1.3%
5.5%
16.3%
15.8%
1.9%
0.6%
0.5%
0.5%
0.7%
0.4%
Pakistan0.1%
0.7%
0.1%
0.4%
0.2%
0.1%
0.1%
0.1%
0.1%
0.1%
Total sample : 20,700
Assessment period: Jan 2021 - Sep 2021
5 - 15%
1 - 5%
Less than 1%
Greater than 20%
15 - 20%
This map is for illustration purposes only. Name and boundaries on this map do not imply official endorsement or acceptance by IOM.
Disclaimer
JULY - SEPTEMBER 2021
MIGRANT REPORT
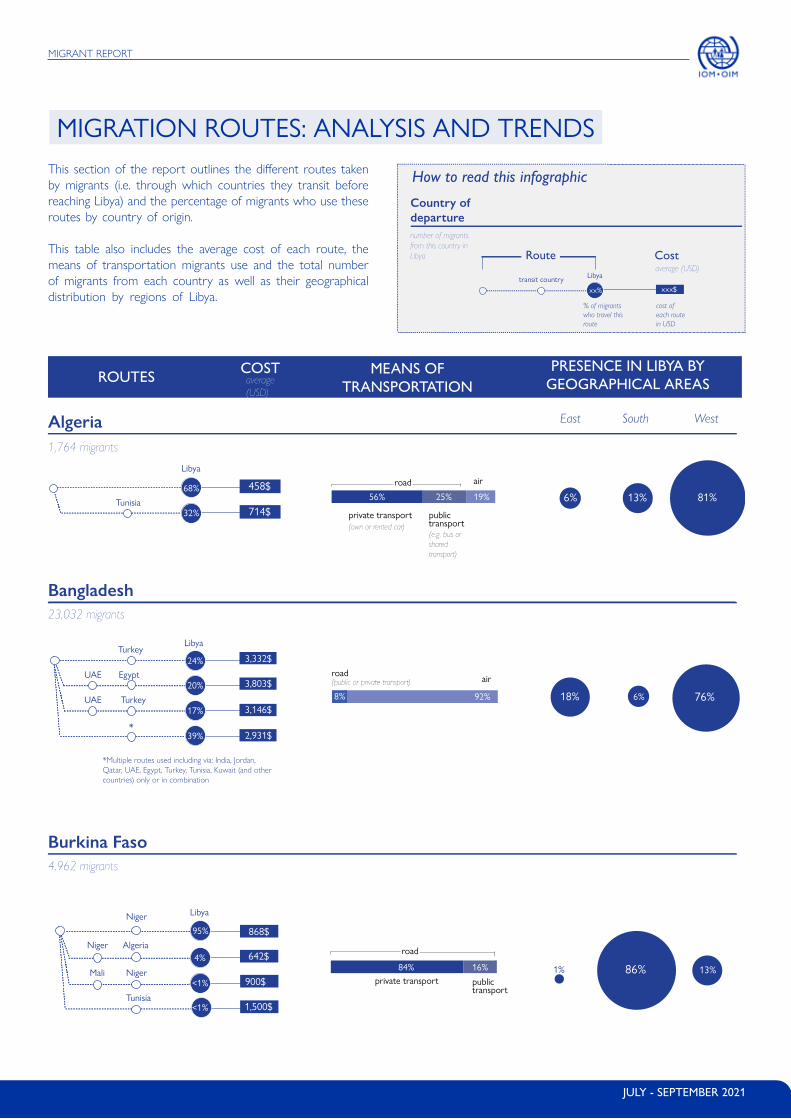
MIGRATION ROUTES: ANALYSIS AND TRENDS
xxx$
Libya
xx%
% of migrants who travel this route
cost of each route in USD
transit country
Country of departure
Route
How to read this infographic
Costaverage (USD)
number of migrants from this country in Libya
This section of the report outlines the different routes taken by migrants (i.e. through which countries they transit before reaching Libya) and the percentage of migrants who use these routes by country of origin.
This table also includes the average cost of each route, the means of transportation migrants use and the total number of migrants from each country as well as their geographical distribution by regions of Libya.
458$
714$
Libya
Tunisia
3,332$
3,803$
3,146$
2,931$
Libya
Libya
Turkey
Egypt
Turkey
UAE
*Multiple routes used including via: India, Jordan, Qatar, UAE, Egypt, Turkey, Tunisia, Kuwait (and other countries) only or in combination
private transport(own or rented car)
(e.g. bus or shared transport)
road
road
public transport
private transport public transport
air
air
road
19%25%56%
*
92%8%
16%84% 86%
18%
6% 13% 81%
76%
Algeria
ROUTES COST MEANS OF TRANSPORTATION
PRESENCE IN LIBYA BY GEOGRAPHICAL AREASaverage
(USD)
East South West
1,764 migrants
Bangladesh23,032 migrants
Burkina Faso4,962 migrants
68%
32%
UAE
24%
20%
17%
39%
868$
642$
900$
1,500$
Niger
AlgeriaNiger
Niger
Tunisia
Mali
95%
4%
<1%
<1%
6%
1%
(public or private transport)
13%

DISPLACEMENT TRACKING MATRIX | LIBYA
DTM LIBYA ROUND 3819
air
road
road
Libya by foot or other
1%
otherfoot
30%69% 17% 19% 64%
Chad83,894 migrants
Libya
Sudan
Egypt108,152 migrants
20% 12% 11% 1%56% 51% 6% 43%
583$
625$*
98%
2%
855$
2,600$
89%
6%
1,976$5%
*
999$
868$
952$
674$
LibyaNiger
Niger
road
2%
1%
47%
road other
2%25%73%
29%71%
51%
Mali24,910 migrants
Niger122,364 migrants
38% 61%
73%
17%
6%
Libya
554$
493$
99%
1%
Algeria
Algeria
Burkina Faso
ROUTES COST MEANS OF TRANSPORTATION
PRESENCE IN LIBYA BY GEOGRAPHICAL AREASaverage
(USD)
East South West
private transport public transport
private transport public transport
private transport public transport
private transport public transport
4%
*Multiple routes used including via one or a combina-tion of the following countries: Niger, Algeria, Burkina Faso, Chad and Sudan.
*
*Multiple routes used that included one or a combination of the following countries: United Arab Emirates, Syria, Turkey, Tunisia, Kuwait, Jordan and Sudan
*Transit countries included Niger, Algeria or Sudan

JULY - SEPTEMBER 2021
MIGRANT REPORT
Libya
*Multiple routes used that included one or more of the following countries: Chad, Egypt, Saudi Arabia, Niger, Tuni-sia, South Sudan, Kenya and Central African Republic
*Multiple routes used that included one or a combination of the following countries: Niger, Chad, Sudan, Burkina Faso, Tunisia, Turkey, Cam-eroon, Algeria and Sudan
airroad
Libya
4%90%
13%
roadair or other1%31%68%
road
air24%66%
49%
28%
Nigeria39,348 migrants
Sudan92,155 migrants
Libya
Tunisia5,235 migrants
20% 22%57%
44%
58%
1,087$
1,213$
1,031$
Niger
*
90%
3%AlgeriaNiger
796$
741$Chad
86%
238$100%
11%
10%
ROUTES COST MEANS OF TRANSPORTATION
PRESENCE IN LIBYA BY GEOGRAPHICAL AREASaverage
(USD)
private transport public transport
private transport public transport
private transport public transport
East South West
7%
977$*
3%*
other1% 6%
7%

JULY - SEPTEMBER 2021
MIGRANT REPORT
REGIONAL ANALYSIS
Photo: In the lead up to World Day Against Trafficking in Persons, IOM conducted a two-day event in Tripoli bringing together a group of migrant community leaders and survivors
of human trafficking to discuss ways to combat human trafficking in Libya. An art-based activity was also conducted for children and women who survived trafficking.
© Rawand AL HARES / IOM 2021

JULY - SEPTEMBER 2021
MIGRANT REPORT
REGIONAL ANALYSIS - DISTRIBUTION
In line with previous reports, more than half of migrants interviewed in July, August and September 2021 were located in the West (56%), while nearly a third were in the East (27%) and a minority were in the South (17%).
Half of migrants were located in the coastal regions of Tripoli (15%), Misrata (11%), Ejdabia (9%), Benghazi (8%) and Azzawya (8%). In comparison, a recent labour market assessment conducted for IOM found that 62 per cent of the Libyan labour force is concentrated in the urban centres of Tripoli, Benghazi, Al Jabal Al Gharbi, Misrata and Almargeb.
Based on key informants interviews held in July, August and September 2021, it is estimated that nearly two thirds of migrants (64%) live in urban areas. Comparatively, around 90 per cent of the Libyan population is concentrated in the major urban centers along the Mediterranean, such as Tripoli, Misrata and Benghazi.
Fig 15 Migrants in Libya by region (mantika) (based on Mobility Tracking data)
51%of migrants are located in the coastal regions of Tripoli, Ejdabia, Misrata, Benghazi and Azzawya

DISPLACEMENT TRACKING MATRIX | LIBYA
DTM LIBYA ROUND 3823
REGIONAL ANALYSIS -
Despite the COVID-19 pandemic, the regional distribution of migrants within Libya remains heavily shaped by geographical proximity as well as socio-economic, ethnic and historical linkages (Fig 16).
The map below shows the top four nationalities of migrants by region as per Mobility Tracking Round 38 data collection (July - September 2021). A significant proportion of migrants in the Southern and Western regions of Murzuq, Sebha, Aljufra, Ubari, Al Jabal Al Gharbi, Wadi Ashshati and Ghat are from neighbouring
Fig 16 Map of top 4 migrant nationalities per region (mantika)
Niger. Chadians and Sudanese constitute the bulk of migrants in the region of Alkufra, which borders Chad and Sudan to the north. Migrants from Chad are also the second most important cohort of migrants in most Southern and Western regions such as Murzuq and Al Jufra. Similarly, Egyptians constitute the bulk of migrants in the eastern coastal regions of Libya, such as Al Jabal Akhdar, Derna, Almarj, Tobruk and Benghazi. However, Tunisians and Algerians do not constitute the majority of migrants in bordering regions and only constitute 1% and 0,3%, respectively, of migrants in Libya.
NATIONALITIES OF MIGRANTS
This map is for illustration purposes only. Names and boundaries on this map do not imply official endorsement or acceptance by IOM.
Tunisia
Niger
Algeria
Tunisia
Chad
Sudan
Egypt
Zwara
Aljfara
Tripoli
Almargeb
Misrata
SirtNalut
Wadi Ashshati
Sebha
Al Jufra
UbariGhat
Murzuq
Alkufra
Ejdabia
Tobruk
Benghazi
Almarj
Derna
Al Jabal Al Akhdar
Chad 30%Sudan 30%Egypt 18%Ghana 5%
Egypt 59%
Syria17%Sudan12%
Mauritania 5%
Niger 38%Egypt 12%
Chad11%Sudan9%
Chad 14%
Nigeria
13%Sudan 12%Niger
11%
Niger 44%Chad 21%Sudan 11%Nigeria 10%
Egypt 43%Sudan 19%Chad 10%Syria 6%
Niger 45%Chad 10%
Egypt8%7%
Nigeria
20%20%16%14%
Sudan 62%Chad 24%Nigeria 6%Egypt 3%
Niger 22%Chad 17%
Nigeria13%Egypt11%
Chad 16%
Egypt
13%Niger11%Sudan11%
Egypt 21%
Niger16%Sudan15%
Chad 12%
Niger 55%Ghana 7%Nigeria 7%Mali 5%
Egypt 59%Sudan 17%Syria 10%Bangladesh 8%
Niger 60%Mali 16%Mauritania 5%Nigeria 4%
Niger 52%Chad 17%Sudan 14%Egypt 7%
Egypt 60%Sudan 22%Syria 8%Chad 8%
Egypt 55%Sudan 20%Chad 8%Syria 6%
ChadEgyptBangladeshSudan
21%19%14%10%
Niger20%Egypt19%
Mali 17%Chad 10%
Niger 35%Ghana 25%Mali 12%Egypt 8%
Niger 20%Egypt 12%Sudan 12%Chad 11%
Al Jabal Al Gharbi
Azzawya
Sources: IOM, DTM, BSC. This map is for illustration purposes only. Names and boundaries on this map do not imply o�cial endorsement or acceptance by IOM.
Legend
< 10,000
100,001 - 148,460
10,001 - 20,000
35,000 - 100,000
20,001 - 35,000
Number of migrants identi�ed per region (mantika)
EgyptNigerChadSudan

JULY - SEPTEMBER 2021
MIGRANT REPORT
REGION OF ORIGIN ANALYSIS
Fig 17 Migrants’ region of origin by regions in Libya
In line with previous reports and despite the pandemic, migrants from North African countries (including Egypt and Sudan) continue to represent the majority of migrants in Eastern Libya (62%) while migrants from Sub-Saharan African countries (such as Niger and Chad) account for the bulk of migrants in Southern and Western Libya (85% and 61%, respectively). The complete disaggregation of migrants’ region of origins by regional location (mantika) in Libya is shown in the table below (Fig 17).
This analysis highlights the connections and social networks that have contributed to and continue to shape
migration to Libya and that developed over time through the circular migration of populations from neighbouring countries. While there are various factors involved in the decision to migrate, social networks is one among them. Individual interviews with migrants conducted by DTM between August and September highlighted that three in four migrants reported having been most encouraged to migrate by family or friends at home or abroad. These findings are in line with a DTM study on social networks, which highlighted that migrants are influenced by interlinkages and kinship networks throughout the process of migration.
Note: 1,235 migrants from other minority nationalities (including those whose nationalities could not be established) are not included in the table above.

DISPLACEMENT TRACKING MATRIX | LIBYA
DTM LIBYA ROUND 3825
NORTH AND SUB-SAHARAN AFRICA
Fig 19 Percentages of migrants by country of origin for the North and Sub-Saharan Africa regions.
Consistent with previous reports and despite the impact of the pandemic, migrants in Libya continue to originate mainly from Sub-Saharan Africa (56% of the total migrant population stock or 340,180 individuals). Migrants from neighbouring Niger (36%) and Chad (25%) constitute the two main nationalities among Sub-Saharan African migrants in Libya (Fig 18).
As during Round 37 of data collection, the number of Sub-Saharan and North African migrants in Libya continued to increase slightly over the reporting period compared to May and June 2021. However, the number of Niger nationals has decreased slightly compared to the previous round of data collection. In July, DTM Niger reported that the border was blocked and checkpoints had been reinforced with police officers to prevent criminal activities while in August the establishment of a barrier to enter and leave Sebha had led to a decrease in the flows observed at the Séguédine and Madama points, which record cross-border movement to and from Libya.
This map is for illustration purposes only. Names and boundaries on this map do not imply official endorsement or acceptance by IOM.
The majority of West and Central African migrants transit through Niger on their way to Libya.
Fig 18 Migrants from countries of origin in Sub-Saharan Africa
Mali
Ghana
Nigeria
Chad
Niger
Somalia
122,364
83,894
39,348
26,943
24,910
5,830
CHAD
NIGER
GHANACOTE D'IVOIRE
NIGERIA
SENEGAL
MALI
GUINEA
SOMALIA
BURKINA FASOERITREA
ETHIOPIA
EGYPT
SUDAN
MOROCCO
ALGERIA
TUNISIA
MAURITANIA
ZAMBIA
51%
43%
2%1%
2%
25%36%
8%1%
12%
2%
7%
1%
2%
1%1%
1%
1%
340,180Sub Saharian
Countries
212,561North African
Countries
1%

JULY - SEPTEMBER 2021
MIGRANT REPORT
Fig 20 Migrants from countries of origin in North Africa
Fig 21 Proportion of migrants by nationalityConsistent with previous reports and a long-standing trend, the majority of North African migrants in Libya are nationals of Egypt (51%) and Sudan (43%) while migrants from Tunisia, Morocco and Algeria together account for 6 per cent of the overall number of migrants from North Africa. A total of 35 per cent of migrants in Libya are from North Africa (212,561 individuals), a proportion which remains in line with previous reports.
The overall number of Northern African migrants also remained fairly stable compared to previous the previous round of data collection. During the reporting period, as the country entered a third wave of COVID-19 cases in July, land and air borders with Tunisia were temporarily closed until mid-September.
Algeria
Tunisia
Morocco
Sudan
Egypt
5,255
5,235
1,764
108,152
92,155

DISPLACEMENT TRACKING MATRIX | LIBYA
DTM LIBYA ROUND 3827
MIDDLE EAST AND SOUTH ASIA
Fig 23 Percentages of migrants by country of origin for the Middle East and South Asia
In line with previous reports, a minority of migrants (9% or 56,152 individuals) identified during Round 38 were from Asia (4%) or the Middle East (5%). Among migrants from Asia and the Middle East, the majority came from Syria (23,032 individuals) and Bangladesh (22,124 individuals) accounting for 41 and 39 per cent of migrants (including refugees), respectively. Syrians and Bangladeshi migrants both account for four per cent each of the overall migrant stock population in Libya. In addition, there were 6,491 migrants who self-identified as Palestinians (12% of all migrants from the Middle East and South Asia in Libya) and 2,870 migrants from Pakistan (5%).
Fig 22 Migrants from countries of origin in Asia and the Middle East
This map is for illustration purposes only. Names and boundaries on this map do not imply official endorsement or acceptance by IOM.
Bangladesh
Syria
Palestinians
Pakistan
Other
2,870
921
23,032
22,124
6,491
SYRIA
PALESTINIAN
PAKISTAN
BANGLADESH
5%
12%
41%
This map is for illustration purposes only.Name and boundaries on this map do not imply official endorsement or acceptance by IOM.
39%
56,152Middle Eastern
And AsianCountries

JULY - SEPTEMBER 2021
MIGRANT REPORT
In September, IOM mobile teams continued to provided assistance to migrants in Libya. In Ain Zara, migrant workers were supported with health care, hygiene kits and food kits as well as information on the risks of irregular migration.
© Moayad Zaghdani / IOM 2021
DISPLACEMENT TRACKING MATRIX | LIBYA
DTM LIBYA ROUND 3829
MARITIME INCIDENTS
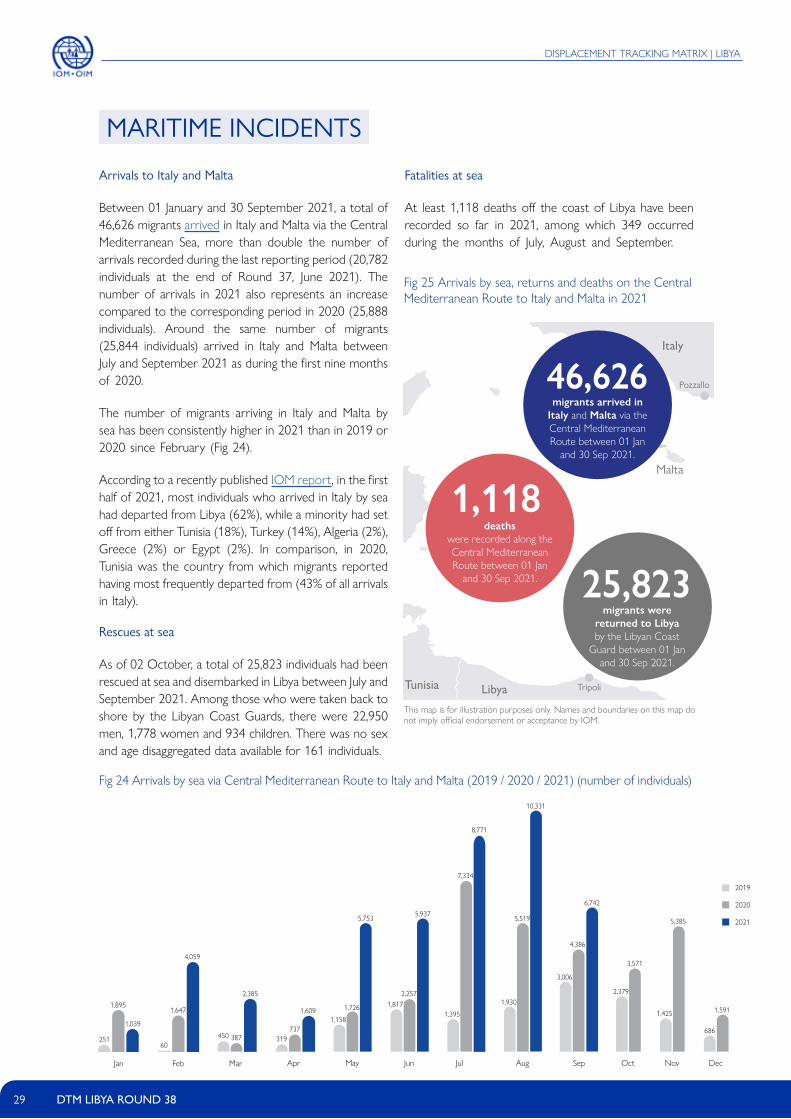
Arrivals to Italy and Malta
Between 01 January and 30 September 2021, a total of 46,626 migrants arrived in Italy and Malta via the Central Mediterranean Sea, more than double the number of arrivals recorded during the last reporting period (20,782 individuals at the end of Round 37, June 2021). The number of arrivals in 2021 also represents an increase compared to the corresponding period in 2020 (25,888 individuals). Around the same number of migrants (25,844 individuals) arrived in Italy and Malta between July and September 2021 as during the first nine months of 2020.
The number of migrants arriving in Italy and Malta by sea has been consistently higher in 2021 than in 2019 or 2020 since February (Fig 24).
According to a recently published IOM report, in the first half of 2021, most individuals who arrived in Italy by sea had departed from Libya (62%), while a minority had set off from either Tunisia (18%), Turkey (14%), Algeria (2%), Greece (2%) or Egypt (2%). In comparison, in 2020, Tunisia was the country from which migrants reported having most frequently departed from (43% of all arrivals in Italy).
Rescues at sea
As of 02 October, a total of 25,823 individuals had been rescued at sea and disembarked in Libya between July and September 2021. Among those who were taken back to shore by the Libyan Coast Guards, there were 22,950 men, 1,778 women and 934 children. There was no sex and age disaggregated data available for 161 individuals.
Fig 25 Arrivals by sea, returns and deaths on the Central Mediterranean Route to Italy and Malta in 2021
Fig 24 Arrivals by sea via Central Mediterranean Route to Italy and Malta (2019 / 2020 / 2021) (number of individuals)
Fatalities at sea
At least 1,118 deaths off the coast of Libya have been recorded so far in 2021, among which 349 occurred during the months of July, August and September.
Italy
Tunisia
Pozzallo
Malta
Palermo
TripoliLibya
46,626migrants arrived in
Italy and Malta via the Central Mediterranean Route between 01 Jan
and 30 Sep 2021.
25,823migrants were
returned to Libya by the Libyan Coast
Guard between 01 Jan and 30 Sep 2021.
1,118deaths
were recorded along the Central Mediterranean Route between 01 Jan
and 30 Sep 2021.
251
1,895
1,039
60
1,647
4,059
450 387
2,385
1,609
319737
1,158
1,726
5,7535,937
1,8172,257
1,930
5,519
3,006
4,386
2,379
3,571
1,425
5,385
686
1,591
7,334
1,395
Apr May Jun Jul Aug Sep Oct Nov Dec
2020
Jan Feb Mar
2021
2019
8,771
10,331
6,742
This map is for illustration purposes only. Names and boundaries on this map do not imply official endorsement or acceptance by IOM.

JULY - SEPTEMBER 2021
MIGRANT REPORT
* For more global details on the migration flows, please visit IOM website: http://migration.iom.int/
DTM’s Migration Information Package includes DTM Libya Migrant Report and Migrant Public Dataset, and is part of the IOM Libya’s Flow Monitoring operations that ensure regular delivery of data and information on migration to, through and from Libya.
This DTM Libya Migrant Report utilizes data collected via different regular DTM data collection activities.
The migrant population figures (stock figures), and their analysis is based on the data collected via DTM Mobility Tracking (including Multi-Sectoral Location Assessment) that identifies the overall population figures in Libya including that of migrants, and helps identify priority humanitarian needs via Key Informant Interviews conducted at community (admin 4: mahalla), and municipality (admin 3: baladiya) levels.
Statistics of migration flows are based on the data collected via a network of 56 flow monitoring points (FMPs) in 10 regions of Libya.
Analysis of migrant routes along with other aspects of migration, including migrant vulnerabilities and humanitarian needs is based on the micro-level data collected through quantitative interviews with migrants via Flow Monitoring Surveys (FMS).
Definition of migrant
IOM characterizes ‘Migrant’ as an umbrella term, not defined under international law, reflecting the common lay understanding of a person who moved away from his or her place of usual residence, whether within a country or across an international border, temporarily or permanently, and for a variety of reasons. The term includes a number of well-defined legal categories of people, such as migrant workers; persons whose particular types of movements are legally defined, such as smuggled migrants; as well as those whose status or means of movement are not specifically defined under international law, such as international students.
For the purposes of collecting data on migration, the United Nations Department of Economic and Social Affairs (UN DESA) defines “international migrant” as “any person who changes his or her country of usual residence” (UN DESA, Recommendations on Statistics of International Migration, Revision 1 (1998) para. 32).
This report only takes into consideration the “international migrants” in Libya as defined above.
METHODOLOGY
88 Enumerators
3 Team leaders
IOM Data collection in numbers
56 Flow Monitoring Points (FMPs) are active in 10 regions (mantikas) of Libya
100%coverage
migrants interviewed(Round 38, Flow Monitoring Survey)
7,824

© 2021 International Organization for Migration (IOM)
DTM LIBYA
dtm.iom.int/libya
@IOM_Libya
Funded by the European Union, the Displacement Tracking Matrix (DTM) in Libya tracks and monitors population movements in order to collate, analyze and share information to support the humanitarian community with the needed demographic baselines to coordinate evidence-based interventions.
To consult all DTM reports, datasets, static and interactive maps and dashboards, please visit: