Iodine binding to Humic Acid
25
1 Iodine binding to Humic Acid Bowley H.E. 1,2 , Young S.D. 1,* , Ander E.L. 2 , Crout N.M.J. 1 , Watts M.J. 2 & Bailey E.H. 1 1 University of Nottingham, School of Biosciences, Sutton Bonington Campus, Loughborough, Leics, LE12 5RD UK. 2 Inorganic Geochemistry, Centre for Environmental Geochemistry, British Geological Survey, Keyworth, Nottingham, NG12 5GG, UK. *Corresponding Author 1 Abstract 1 The rate of reactions between humic acid (HA) and iodide (I - ) and iodate (IO 3 - ) have been 2 investigated in suspensions spiked with 129 I at concentrations of 22, 44 and 88 μg L -1 and stored at 3 10 o C. Changes in the speciation of 129 I - , 129 IO 3 - and mixed ( 129 I - + 129 IO 3 - ) spikes were monitored over 77 4 days using liquid chromatography inductively coupled plasma mass spectrometry (LC-ICP-MS). In 5 suspensions spiked with 129 I - 25% of the added I - was transformed into organic iodine (Org- 129 I) 6 within 77 days and there was no evidence of 129 IO 3 - formation. By contrast, rapid loss of 129 IO 3 - and 7 increase in both 129 I - and Org- 129 I was observed in 129 IO 3 - -spiked suspensions. However, the rate of 8 Org- 129 I production was greater in mixed systems compared to 129 IO 3 - -spiked suspensions with the 9 same total 129 I concentration, possibly indicating IO 3 - —I - redox coupling. Size exclusion 10 chromatography (SEC) demonstrated that Org- 129 I was present in both high and low molecular 11 weight fractions of the HA although a slight preference to bond with the lower molecular weight 12 fractions was observed indicating that, after 77 days, the spiked isotope had not fully mixed with the 13 native 127 I pool. Iodine transformations were modelled using first order rate equations and fitted 14 rate coefficients determined. However, extrapolation of the model to 250 days indicated that a 15 pseudo-steady state would be attained after ~ 200 days but that the proportion of 129 I incorporated 16 into HA was less than that of 127 I indicating the presence of a recalcitrant pool of 127 I that was 17 unavailable for isotopic mixing. 18 Keywords: Humic acid; iodine; kinetics; speciation; iodine-129; soil. 19 2 Introduction 20 Iodine is an essential micro-nutrient for all mammals, with a recommended daily dietary intake of 21
Transcript of Iodine binding to Humic Acid

1
Iodine binding to Humic Acid
Bowley H.E.1,2, Young S.D.1,*, Ander E.L.2, Crout N.M.J.1, Watts M.J.2 & Bailey E.H.1
1 University of Nottingham, School of Biosciences, Sutton Bonington Campus, Loughborough, Leics,
LE12 5RD UK.
2 Inorganic Geochemistry, Centre for Environmental Geochemistry, British Geological Survey,
Keyworth, Nottingham, NG12 5GG, UK.
*Corresponding Author
1 Abstract1
The rate of reactions between humic acid (HA) and iodide (I-) and iodate (IO3-) have been2
investigated in suspensions spiked with 129I at concentrations of 22, 44 and 88 µg L-1 and stored at3
10oC. Changes in the speciation of 129I-, 129IO3- and mixed (129I-+129IO3
-) spikes were monitored over 774
days using liquid chromatography inductively coupled plasma mass spectrometry (LC-ICP-MS). In5
suspensions spiked with 129I- 25% of the added I- was transformed into organic iodine (Org-129I)6
within 77 days and there was no evidence of 129IO3- formation. By contrast, rapid loss of 129IO3
- and7
increase in both 129I- and Org-129I was observed in 129IO3--spiked suspensions. However, the rate of8
Org-129I production was greater in mixed systems compared to 129IO3--spiked suspensions with the9
same total 129I concentration, possibly indicating IO3-—I- redox coupling. Size exclusion10
chromatography (SEC) demonstrated that Org-129I was present in both high and low molecular11
weight fractions of the HA although a slight preference to bond with the lower molecular weight12
fractions was observed indicating that, after 77 days, the spiked isotope had not fully mixed with the13
native 127I pool. Iodine transformations were modelled using first order rate equations and fitted14
rate coefficients determined. However, extrapolation of the model to 250 days indicated that a15
pseudo-steady state would be attained after ~ 200 days but that the proportion of 129I incorporated16
into HA was less than that of 127I indicating the presence of a recalcitrant pool of 127I that was17
unavailable for isotopic mixing.18
Keywords: Humic acid; iodine; kinetics; speciation; iodine-129; soil.19
2 Introduction20
Iodine is an essential micro-nutrient for all mammals, with a recommended daily dietary intake of21

2
100-150 μg d-1 for humans (Johnson, 2003). Iodine deficiency diseases (IDDs) are a global health22
problem, estimated to affect up to one third of the world’s population (WHO, 2004). They are a23
significant social and economic stress on developing countries and an area of concern for developed24
countries (WHO 2008). Mechanisms that control the transfer of iodine from the terrestrial25
environment to the food chain are a poorly understood component of global iodine cycles (Johnson26
2003a).27
Soil iodine concentrations in the UK are typically within the range 0.5 – 100 mg kg-1 (Whitehead,28
1984, Johnson, 2003b). Seawater is considered to be the largest source of iodine to the terrestrial29
biosphere (Muramatsu and Wedepohl, 1998, Fuge and Johnson, 1986) therefore higher soil30
concentrations tend to occur in coastal areas. High soil iodine concentrations are also often31
associated with high organic matter content, with humus the primary reservoir of soil iodine (Dai et32
al., 2009, Smyth and Johnson, 2011, Xu et al., 2011b). In general, a larger soil iodine concentration33
generally results in greater iodine uptake by plants (Weng et al., 2008, Dai et al., 2006), however34
iodine associated with organic matter appears to be relatively unavailable for plant uptake (Keppler35
et al., 2003, Xu et al., 2011b, Xu et al., 2012).36
Humic acid (HA) is the colloidal fraction of humus, containing both aliphatic and aromatic moieties,37
depending on the degree of humification and the original vegetation source of the organic matter.38
Its large surface area and significant presence in soil organic matter mean that it is highly influential39
in determining soil iodine dynamics (Xu et al., 2011b, Yamada et al., 2002, Francois, 1987, Hansen et40
al., 2011, Allard, 2006). Although the composition of HA varies between soils, the functional groups41
present are similar and therefore understanding iodine interactions with HA contributes significantly42
to understanding its dynamics in soil (Schlegel et al., 2006, Warner et al., 2000, Saunders et al.,43
2012). A few authors have investigated reactions between HA and iodine (e.g. Christiansen and44
Carlsen, 1991, Reiller et al., 2006, Choung et al., 2013) but the majority of studies involve other45
reaction components, often in complex media such as aerosols; the rate of reaction between I and46
HA has generally not been explicitly considered. Iodination of HA is thought to occur mainly via47
reduction of IO3- to produce reactive intermediate species, such as I2 or HOI, followed by48
electrophilic substitution reactions with electron donor groups on the HA (Francois 1987).49
Whitehead (1974) identified weakly acidic phenolic and amino acid groups as the most likely50
reaction sites. Christiansen and Carlsen (1991) concluded that HA reacted with a transient iodine51
species resulting from reaction between I-, peroxidase enzymes and hydrogen peroxide over 2052
minutes, although they were unable to determine whether the transient species was an enzyme-53
iodine complex or HOI/I2 produced by action of the peroxidase on I-. They suggested three possible54

3
types of sites in the HA were available for reaction: primary sites where I was weakly bonded,55
secondary sites susceptible to nucleophilic iodide-iodide substitution and tertiary electrophilic sites.56
They also observed that iodine appeared to be uniformly distributed across all molecular size57
fractions. Schlegel et al. (2006) used Extended X-ray Absorption Fine Structure (EXAFS) to58
investigate naturally iodinated marine-derived humic substances with 10% iodine by weight and59
concluded that iodine was covalently bonded, primarily to aromatic rings, but probably present as60
more than one type of organic species. Preferential bonding of iodine to polycyclic aromatic moities61
in black carbon was also demonstrated by Choung et al. (2013).62
The objectives of this work were to (i) measure and model the dynamics of the reaction between IO3-63
and I- and HA (ii) establish whether HA contains a recalcitrant (unreactive) pool of iodine and (iii)64
investigate whether iodine exhibits preferential association with high or low molecular weight65
moieties in HA. This directly addresses our currently poor understanding of the interaction of iodine66
with soil organic matter.67
3 Materials and methods68
3.1 Preparation and characterisation of humic acid solutions69
Humic acid (HA) was extracted from a coniferous plantation soil, Leicestershire, UK (52o 42’ N, 1o 14’70
W; 195 m) by shaking for twelve hours with 0.1 M NaOH, followed by centrifugation (10,000 g,71
15 min) and acidification to pH 2 of the supernatant, using concentrated HCl. Humic and fulvic72
fractions were separated by centrifugation and the HA was purified using dialysis against 1 %v/v HCl73
and HF then deionised water; the resultant HA was then freeze dried and finely ground (Marshall et74
al., 1995). A portion of dried, ground HA was dissolved in 0.016 M NaOH and adjusted to pH 7.075
using NaOH to give a final concentration of 7.18 mg HA mL-1. A neutral pH value was chosen to be76
close to typical arable soil conditions and avoid volatilization of I2. Dissolved organic carbon in the HA77
solution was determined using a Shimadzu TOC-VCPH analyser. Each sample was acidified to pH 2-378
using HCl to remove inorganic carbon, before the remaining (organic) carbon was detected as CO2 by79
non-dispersive infrared detection after heating the sample to 720 °C with a platinum-coated alumina80
catalyst. Samples were quantified against standards of 2.125 g L-1 potassium hydrogen phthalate (C81
concentration = 1000 mg L-1), diluted to appropriate concentrations with Milli-Q water (18.2 MΩ 82
cm). Total iodine concentration in the HA suspension was measured by ICP-MS (Thermo-Fisher83
Scientific X-SeriesII) using internal detector cross-calibration with Rh and Re (10 μg L-1) as internal84
standards. Stock standards for 127I were prepared at iodine concentrations of 1000 mg L-1 from85
oven-dried KI and KIO3, and stored at 4 °C in 1 % tetra methyl ammonium hydroxide (TMAH).86

4
Iodine-129 was obtained as a solution of sodium iodide (129I-) from the American National Institute of87
Standards (NIST, Gaithersburg, Maryland, USA; CRM 4949C, 0.004 mol L-1 Na129I, 3451 Bq mL-1).88
Iodate-129 (129IO3-) was prepared by oxidation of 129I- with sodium chlorite using a method adapted89
from Yntema and Fleming (1939). Successful oxidation to IO3- was confirmed by ICP-MS with in-line90
chromatographic separation using HPLC (Dionex, ICS-3000) operated in isocratic mode with an anion91
exchange column (Hamilton PRP-X100; 250 x 4.6 mm, 5 m particle size). The mobile phase (1.3 mL92
min-1) was 60 mmol L-1 NH4NO3, 1 x 10⁻⁵ mmol L-1 Na2-EDTA, 2% methanol; pH was adjusted to 9.593
with TMAH.94
Triplicate aliquots of HA solution (pH 7) were spiked with 129I- and/or 129IO3- on 8 occasions to give95
incubation times of 26, 79, 155, 328, 596, 992, 1404 and 1855 hr. Samples were stored in the dark96
at 10 °C, the average annual soil temperature measured at Armagh Observatory, Northern Ireland97
(Garcia-Suarez and Butler, 2006). Final concentrations of spiked iodine were 22.1 , 44.1 and98
88.2 µg L-1 (Table 1). The CRM 4949C contained 127I equivalent to 12 % of the 129I concentration; this99
was accounted for as described in Electronic Annex A so that, for simplicity, all iodine added in the100
spike (129I + 127I) is referred to as 129I and native iodine is described as 127I.101
3.2 Iodine speciation102
Iodine species were separated using HPLC (Dionex, ICS-3000), with a Superose 12 10/300 GL size103
exclusion chromatography (SEC) column (GE Healthcare), linked to ICP-MS. A sample injection104
volume of 25 µl and isocratic elution with 0.1 M Tris (Tris(hydroxymethyl)aminomethane) adjusted105
to pH 8.8 using 50 % Trace Analysis Grade (TAG) HNO3 at a flowrate of 1 mL min-1 was used. The106
HPLC was controlled using Chromeleon software (Dionex, version 6.80SR12) and sample processing107
was undertaken using Plasmalab software. Working standards of 127I- and 127IO3-, at iodine108
concentrations of 0 – 100 µg L-1, were used. Species-specific quantification was carried out with109
standards of 127I-, 127IO3-, 129I- and 129IO3
- prepared in Milli-Q water and mean, isotope-specific,110
sensitivity values (signal (integrated CPS) per ppb) calculated from iodide and iodate standards were111
used to quantify HA-bonded iodine (HA-I); drift correction was applied by analysis of repeated112
standards through the experimental run. Limits of detection were 0.047 µg L-1 for 127I and 0.014 µg L-113
1 for 129I. Humic acid controls, spiked with Milli-Q water, were analysed alongside 129I-spiked samples114
to determine the equilibrium speciation of native 127I.115
A correction factor for 129Xe was determined for each run and applied to all 129I results, according to116
Equation 1:117
Sଵଶଽ = S୫ ୟୣୱଵଶଽ − (݇�× S୫ ୟୣୱ
ଵଷଵ ) (1)118

5
where 129S = corrected signal (CPS) for 129I; 129Smeas = measured signal at m/z = 129; k = a factor119
determined by iteration for each run (typically 1.08) to give an average 129S baseline of zero; 131Smeas120
= measured signal for 131Xe. Matrix matching and standard addition were used to calculate mean121
sensitivity for all samples in each run, from which concentrations of 129I and 127I in each peak were122
quantified.123
3.3 Modelling124
Iodine-129 transformations were represented as simultaneous ordinary differential equations (Fig.125
1):126
d[IO3-]
dt= -(k1+k4)[IO3
-] + k5[Org-I] (2)127
d[I-
]
dt= - k3[Iି] + k1[IO
3- ] + k2[Org-I] (3)128
ୢ[୰ି ]୍
ୢ୲= - (k2+k5) Oൣrg-I൧ + k4[IO3
-] + k3[I-] (4)129
Where k1, k2, k3, k4 and k5 are unknown rate coefficients (hr1) estimated by fitting the model to the130
observed concentrations of 129IO3¯, 129I- and Org-129I.131
The differential equations were solved using 4th order Runge-Kutta and fitting was performed using a132
Marquardt procedure (Press et al, 1986) implemented in OpenModel (Tarsitano et al 2011,133
http://openmodel.info/) to minimize the residual sum of squares (RSS) between modelled and134
observed values over all the time points and different spike combinations. Alternative model135
structures were considered, the arrangement described (and shown schematically in Fig. 1) provided136
the best fit to the data.137
4 Results and discussion138
4.1 Iodine dynamics139
Measured characteristics of the HA are given in Table 2. Concentrations of 127I species represent140
iodine in equilibrium with HA suspensions with median values of 98.0 µg L-1 of Org-127I and 15.1 µg L-141
1 127I¯; iodate (127IO3¯) was not detected. The C:I mole ratio in the HA was 396,000.142
Figure 2 shows the change in speciation of spiked 129I over time; model fits to the data are discussed143
in a later section. In suspensions spiked with I- only (Table 1: I22, I44 and I88) a gradual decrease in 129I-144
concentrations was observed over time with a concomitant increase in Org-129I. By the final time145
point (1855 hr) ~25% of added 129I- had been transformed to Org-129I irrespective of initial spike146

6
concentration. No generation of 129IO3- was observed. Suspensions spiked with 129IO3
- (Table 1: IO22,147
IO44 and IO88) showed rapid initial loss of 129IO3- with associated increases in both 129I- and Org-129I.148
Concentrations of 129I- were always greater than Org-129I. By the end of the experiment (1855 hr)149
concentrations of 129IO3- in each system were < 5% of the initial concentrations and Org-129I150
accounted for ~40% of the added iodine, again irrespective of initial spike concentration. In mixed151
systems (Table 1; Mix22, Mix44 and Mix88), where equal concentrations of 129I- and 129IO3- were added,152
results were similar to those observed when 129IO3- alone was added (Figure 2). Concentrations of153
129IO3- decreased rapidly with both 129I- and Org-129I increasing over time. Again no concentration-154
dependence was observed, with similar proportions of 129I- and Org-129I observed regardless of spike155
concentration.156
Humic acid has been reported to both reduce IO3- and oxidise I- in soils (Yamaguchi et al., 2010),157
however oxidation of I- by organic matter to form IO3- is expected to be much slower than reduction158
of IO3- to I- (Schlegel et al., 2006) unless FeIII and MnIV oxides are present which may catalyse the159
oxidation of I- (Gallard et al., 2009, Allard et al., 2009, Fox et al., 2009). This difference in rate160
(between I- and IO3-), in the absence of metal oxides, was confirmed by the absence of 129IO3
- in 129I-161
spiked systems, in contrast to the rapid production of 129I- in HA solutions spiked with 129IO3-.162
Shetaya et al. (2012), selected soils with a range of pH values and concentrations of Fe/Mn oxides163
and organic matter for incubation with 129I- or 129IO3- at 10oC and 20oC. In contrast to the current164
study, and that of Choung et al. (2013), they found that conversion of added 129I- to (humic-bound)165
Org-129I (t½ = 0.38 – 45 hr) was faster than conversion of 129IO3- to Org-129I (t½ = 9.0 -412 hr).166
Comparison of these half-life values for whole soil with the data comparing iodide and iodate in Fig.167
2 may indicate the importance of metal oxides in soils in rapidly adsorbing IO3-, and thereby slowing168
its transformation into Org-I, or possibly enabling oxidation of I- to an intermediate species capable169
of reacting with humus. Additionally the large overall differences in reaction rates seen between170
soils and HA may reflect enzyme activity in soils which is likely to be absent from isolated HA171
fractions.172
The rate of Org-129I production was greater in the systems spiked with 129IO3- than those spiked with173
129I- at the same concentration (Fig. 2). However, in mixed systems the initial rate of Org-129I174
production was greater than in solutions spiked with 129IO3- alone, although a slightly lower175
concentration of Org-129I was eventually present after 500 hr incubation (e.g. IO44 and Mix44).176
However comparison of systems with the same initial concentration of 129IO3- (e.g. IO22 and Mix 44)177
showed that Org-129I concentrations were substantially greater in the mixed systems where 129I- was178

7
also present compared to the equivalent 129IO3--spiked system. This may suggest that redox coupling179
between 129I- (or 127I-) and 129IO3- had occurred in the mixed spike solutions (Eq. 2):180
IO3- + 5I- + 6H+ ⇌ 3I2 + 3 H2O (2)181
When only 129I¯ was added, its transformation to Org-129I did not depend upon concentration (Fig. 3),182
suggesting its oxidation mechanism was independent of the presence of another species. However,183
considering the presence of native iodide (127I-) in the HA solutions, the relative rate of 129I¯184
production, from 129IO3-, in the mixed spike system was greater when lower concentrations of 129IO3
-185
were added (Fig. 3); this result is consistent with faster reduction of IO3- (to I-) at higher186
iodide/iodate ratios. For the mixed-spike system the ratio of measured iodide to added iodide187
progressively exceeded 1.0, reflecting the production of I- from reduction of added IO3-.188
The relative rates of 129IO3- loss in both 129IO3
-- and mixed-spike systems were slightly greater at189
lower IO3- concentrations with similar rates observed for systems with the same total 129I190
concentration (Fig. 4). Again, this suggests that the rate of iodate reduction is limited, either by the191
concentration of iodide (Eq. 2) or some other reductive mechanism associated with the HA.192
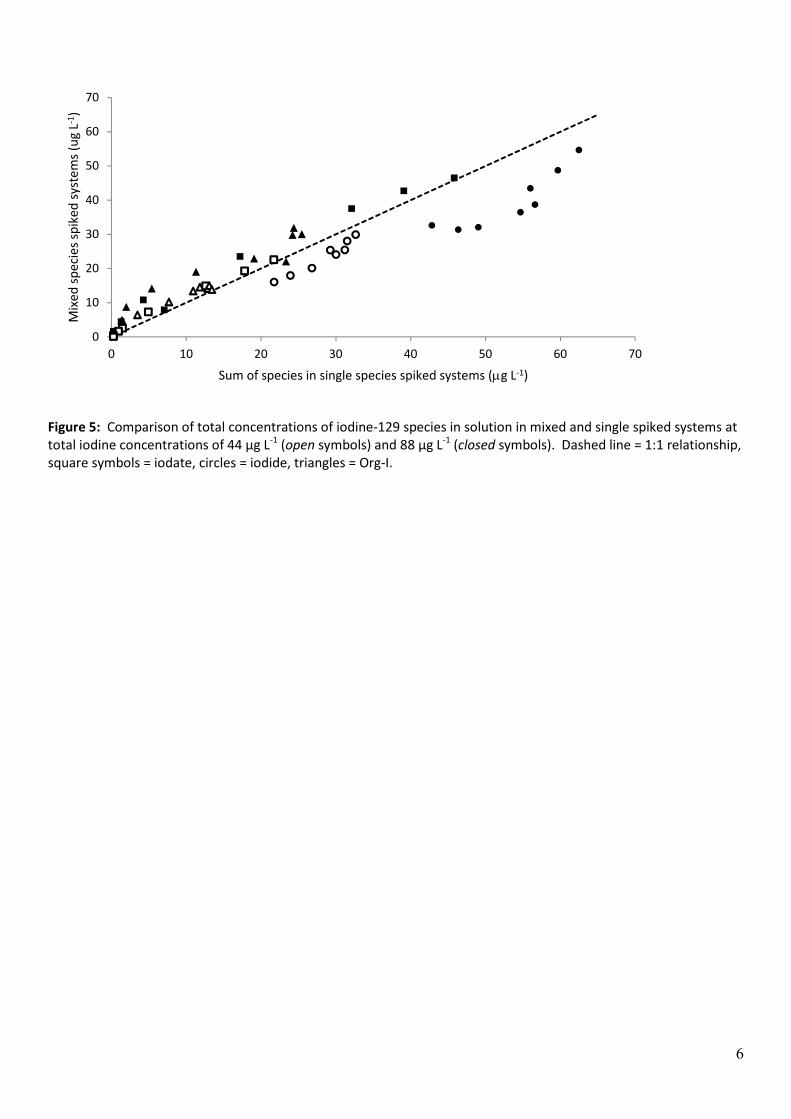
Figure 5 compares the concentrations of species measured in systems where a mix of species was193
added with the sum of species from the appropriate 129I- and 129IO3- treatments spiked with a single194
species (e.g. Mix44 compared with I22+IO22). Although it could be argued that this comparison is not195
completely valid because the 129I:HA ratio differed, the rate of 129I- transformation to Org-129I (Fig. 3,196
open symbols) indicated that HA concentration is not a limiting factor. Figure 5 suggests that197
initially there was less 129I-, and consequently greater concentrations of 129IO3- and Org-129I, in the198
mixed spike systems (circles fall below the 1:1 line). However, the difference in species composition199
between the mixed and single-species systems generally declined with time - eg highest values for200
iodide (open and closed circles).201
Comparison of the concentrations of the species present in single species spiked systems with 129I--202
spiked systems at an equivalent total iodine concentration (e.g. IO44 + I44 compared with I88) also203
show that 129I- was only transformed to Org-129I and that this happened faster when 129IO3- was204
present, perhaps reflecting the 5:1 ratio in Eq. 2.205
4.2 Iodine distribution within the HA206
The distribution of iodine within the HA was examined using SEC-ICP-MS. Lower molecular weight207
(LMW) HA may be expected to react more easily with iodine due to its greater surface area which208
may provide greater accessibility to reactive sites. Conversely, the greater negative charge density209

8
expected on LMW fractions may act to exclude or delay I- or IO3- ions from interaction. Xu et al.210
(2011a), in a study where IO3- was added to HA at pH 3, observed that the LMW fractions (3 – 50211
kDa) sorbed more iodine than the > 50 kDa fractions after 72 hr. By contrast, Christiansen and212
Carlsen (1991) observed no dependence on MW size fraction following a rapid (20 min) reaction of213
Aldrich HA with I- in the presence of peroxidase enzymes. Figure 6 shows the cumulative integrated214
counts per second (ICPS) for the organic portion of the SEC chromatogram for added 129I and pre-215
existing 127I in the HA after a 77 day incubation of the Mix88 solution. Higher molecular weight216
(HMW) molecules elute first due to exclusion from the column matrix - shown by the prominent217
peak around 400 s. The lines representing the cumulative integrated signals for 127I and 129I in Figure218
6 suggest that a greater proportion of 127I than 129I was present in larger HA molecules.219
Approximately 50% of the cumulative integrated signal for 127I had been detected by 530 s,220
compared to 600 s for 129I. This indicates that 129I had not fully mixed with the pre-existing HA-bound221
127I and had reacted preferentially with the LMW fractions of HA. It also indicates the presence of222
recalcitrant iodine (127I), unavailable to mix with the added 129I, and with a greater presence in the223
HMW fractions of HA. Comparison of the Mix88 77 day chromatogram for 127I and 129I (Figure 6) also224
shows a smaller excluded peak maxima compared to the main organic peak for 129I and a shift in the225
129I peak maxima towards LMW fractions, again suggesting preferential binding of freshly added226
iodine to LMW fractions of HA in contrast to (native) 127I.227
4.3 Modelling228
Fitted model (Fig. 1) predictions are compared to the observations in Fig. 2 and estimated rate229
coefficients are given in Table 3. Overall the model fit was good (for all data: r2 = 0.96, p < 0.001),230
supporting the model structure. The values of the (apparent) rate constants broadly reflect the231
dynamics of the system. Iodate is rapidly converted to humic-bound forms (k4 = 2.62 hr-1) but the232
optimal model fit required a reverse reaction (k5 = 0.157 hr-1) suggesting an approach to an233
equilibrium position rather than a zero sink for iodate. The further reduction of iodate to iodide was234
slower (k1 = 4.11 x 10⁻³ hr-1) and both the ‘direct’ conversion of iodide to humic-bound iodine and the235
re-mineralisation of iodide were comparatively very slow reactions (k3 = 3.16 x 10⁻⁴ and k2 = 4.67 x236
10-4 hr-1).237
In order to investigate the availability of 127I for mixing with 129I, modelling was extended to 250 d. At238
this point a pseudo-steady-state was apparent, with no significant changes in species concentrations239
from 200 d after spiking. After 250 d contact between 129I and HA the model predicted that 129I¯240
/Org-129I = 0.24, whereas the measure ratio 127I¯ /Org-127I was lower, at 0.17. Therefore although the241
model prediction suggested that 129I was at equilibrium, a greater proportion of 127I than 129I existed242

9
as Org-I, suggesting the presence of a recalcitrant pool of 127I, unavailable for isotopic mixing. From243
the 129I¯ /Org-129I ratio and measured 127I- in solution, the estimated labile Org-127I was 62.9 µg L-1,244
suggesting that 64% of the HA bound iodine was labile and 36% was incapable of isotopic mixing245
within 250 d.246
Keppler et al. (2003) and Xu et al. (2011b) suggested that iodination of HA occurs early in the247
humification of fresh plant material with fewer binding sites available as humification progresses.248
Steric hindrance by aliphatic chains may also make some aromatic binding sites less accessible to249
freshly added iodine, while effectively ‘fixing’ native iodine (Xu et al., 2012). Schwehr et al (2009)250
also observed, in an experiment where natural sediments were spiked with I-, that recently added I-251
was less strongly sorbed than native iodine, and that greater added concentrations resulted in a252
smaller proportion bound. Therefore although organic-rich soils may well contain higher total253
concentrations of iodine much of that iodine may not be readily accessible to plants.254
5 Conclusions255
Inorganic iodine (both I- and IO3-) reacted with HA to produce Org-I. The reaction was slower with I-256
compared to systems spiked with IO3- or a mixture of IO3
- and I-. In mixed and IO3--spiked systems I-257
concentrations increased rapidly and remained higher than Org-I concentrations throughout the258
duration of the experiment.259
Native iodine in the HA solutions was present only as I- and Org-I; no IO3- was observed. There was260
evidence that the presence of native 127I- allowed more rapid reduction of spiked 129IO3-, potentially261
by redox coupling with I-. This was supported by the relative rates of reaction of the two species,262
with a faster reaction observed when a mix of inorganic species (I- and IO3-) was added, rather than a263
single species (I- or IO3- alone). In soils, by contrast, I- has been reported to transform to Org-I more264
quickly than IO3-, possibly due to the presence of metal oxides or enzymatic oxidation. In a ‘purified’265
HA solution the same reaction mechanisms are not available and I- oxidation was relatively slow.266
Size exclusion chromatography showed that 129I became associated with both high and low267
molecular weight HA although a slight preference for lower molecular weight fractions was268
suggested. The native and spiked isotopes were not fully mixed after ~ 2 months of reaction269
indicating the presence of a recalcitrant pool of 127I; this was also strongly indicated by modelling270
over longer timescales.271

10
6 Acknowledgements272
Funding for H. E. Bowley was provided by UoN and the BGS University Funding Initiative (BUFI-S178).273
This work is published with the permission of the Executive Director, British Geological Survey.274
275

11
7 References276
Allard, B. (2006) A comparative study on the chemical composition of humic acids from forest soil,277
agricultural soil and lignite deposite. Bound lipid, carbohydrate and amino acid distributions.278
Geoderma, 130, 77 - 96.279
Allard, S., von Gunten, U., Sahli, E., Nicolau, R. & Gallard, H. (2009) Oxidation of iodide and iodine on280
birnessite (d-MnO2) in the pH range 4-8. Water Research, 43, 3417-3426.281
Christiansen, J. V. & Carlsen, L. (1991) Enzymatically controlled iodination reactions in the terrestrial282
environment. Radiochimica Acta, 52-3, 327-333.283
Choung, S., Um, W., Kim, M. & Kim, M-G. 2013. Uptake mechanism for iodine species to black284
carbon. Environmental Science and Technology 47, 10349 - 10355.285
Dai, J. L., Zhang, M., Hu, Q. H., Huang, Y. Z., Wang, R. Q. & Zhu, Y. G. (2009) Adsorption and286
desorption of iodine by various Chinese soils: II. Iodide and iodate. Geoderma, 153, 130-135.287
Dai, J. L., Zhu, Y. G., Huang, Y. Z., Zhang, M. & Song, J. L. (2006) Availability of iodide and iodate to288
spinach (Spinacia oleracea L.) in relation to total iodine in soil solution. Plant and Soil, 289,289
301-308.290
Fox, P. M., Davis, J. A. & Luther, G. W. (2009) The kinetics of iodide oxidation by the manganese291
oxide mineral birnessite. Geochimica et Cosmochimica Acta, 73, 2850-2861.292
Francois, R. (1987) The influence of humic substances on the geochemistry of iodine in nearshore293
and hemipelagic marine sediments. Geochimica et Cosmochimica Acta, 51, 2417 - 2427.294
Fuge, R. & Johnson, C. C. (1986) The Geochemistry of Iodine - a Review. Environmental Geochemistry295
and Health, 8, 31-54.296
Gallard, H., Allard, S., Nicolau, R., von Gunten, U. & Croue, J. P. (2009) Formation of iodinated297
organic compounds by oxidation of iodide-containing waters with manganese dioxide.298
Environmental Science & Technology, 43, 7003-7009.299
Garcia-Suarez, A. M. & Butler, C. J. (2006) Soil temperatures at Armagh Observatory, Northern300
Ireland, from 1904 to 2002. International Journal of Climatology, 26, 1075-1089.301
Hansen, V., Roos, P., Aldahan, A., Hou, X. & Possnert, G. (2011) Partition of iodine (129I and 127I)302
isotopes in soils and marine sediments. Journal of Environmental Radioactivity, 102, 1096-303
1104.304
Johnson C. C. (2003a) The geochemistry of iodine and its application to environmental strategies for305
reducing the risks from iodine deficiency disorders (idd). Brit. Geol. Surv., DFID kar project306
R7411, Report CR/03/057N.307
Johnson, C. C. (2003b) Database of the iodine content of soils populated with data from published308
literature. British Geological Survey Commissioned Report.309

12
Keppler, F., Biester, H., Putschew, A., Silk, P. J., Scholer, H. F. & Muller, G. (2003) Organoiodine310
formation during humification in peatlands. Environmental Chemistry Letters, 1, 219-223.311
Marshall, S.J. (1992) The complexation of aluminium by humic acids in fresh waters. PhD Thesis.312
Agricultural and Environmnetal Sciences, University of Nottingham.313
Marshall, S. J., Young, S. D. & Gregson, K. (1995) Humic acid-proton equilibria: A comparison of two314
models and assessment of titration error. European Journal of Soil Science, 46, 471-480.315
Muramatsu, Y. & Wedepohl, K. H. (1998) The distribution of iodine in the Earth's crust. Chemical316
Geology, 147, 201-216.317
Press , W.H., Teukolsky S.A., Vetterling, W.T., Flannery, B.P. (2007) Numerical Recipes 3rd Edition:318
The Art of Scientific Computing, Cambridge University Press, New York, NY319
Reiller, P., Mercier-BIon, F., Gimenez, N., Barre, N. & Miserque, F. (2006) Iodination of humic acid320
samples from different origins. Radiochimica Acta, 94, 739-745.321
Saunders, R.W., Kumar, R., MacDonald, S.M. and Plane J.M.C. (2012). Insights into the322
Photochemical Transformation of Iodine in Aqueous Systems: Humic Acid Photosensitized323
Reduction of Iodate. Environ. Sci. Technol., 46, 11854−11861. 324
Schlegel, M. L., Reiller, P., Mercier-Bion, F., Barre, N. & Moulin, V. (2006) Molecular environment of325
iodine in naturally iodinated humic substances: Insight from X-ray absorption spectroscopy.326
Geochimica et Cosmochimica Acta, 70, 5536 - 5551.327
Schwehr, K. A., Santschi, P. H., Kaplan, D. I., Yeager, C. M. & Brinkmeyer, R. (2009) Organo-iodine328
formation in soils and aquifer sediments at ambient concentrations. Environmental Science329
& Technology, 43, 7258-7264.330
Shetaya, W. H., Young, S. D., Watts, M. J., Ander, E. L. & Bailey, E. H. (2012) Iodine dynamics in soils.331
Geochimica et Cosmochimica Acta, 77, 457-473.332
Smyth, D. & Johnson, C. C. (2011) Distribution of iodine in soils of Northern Ireland. Geochemistry-333
Exploration Environment Analysis, 11, 25-39.334
D Tarsitano, D, Young, S.D., Crout, N.M.J. (2011) Evaluating and reducing a model of radiocaesium335
soil-plant uptake. Journal of Environmental Radioactivity, 102, 262-269.336
Warner, J. A., Casey, W. H. & Dahlgren, R. A. (2000) Interaction kinetics of I2(aq) with substituted337
phenols and humic substances. Environmental Science & Technology, 34, 3180-3185.338
Weng, H. X., Weng, J. K., Yan, A. L., Hong, C. L., Yong, W. B. & Qin, Y. C. (2008) Increment of iodine339
content in vegetable plants by applying iodized fertilizer and the residual characteristics of340
iodine in soil. Biological Trace Element Research, 123, 218-228.341
Whitehead, D. C. (1974) The infl uence of organic matter, chalk and sequisoxides on the solubility of342
iodide, elemental iodine and iodate inclubated with soil. Journal of Soil Science, 25, 461-470.343

13
Whitehead, D. C. (1984) The Distribution and Transformations of Iodine in the Environment.344
Environment International, 10, 321-339.345
WHO (2004) In Iodine Status Worldwide (eds. B. Benoist, et al.). Department of Nutrition for Health346
and Development, World Health Organization, Geneva.347
WHO (2008) WHO expert consultation on salt as a vehicle for fortification, Luxembourg, 21-22348
March 2007. ISBN 978 92 4 159678 7.349
Xu, C., Miller, E. J., Zhang, S., Li, H.-P., Ho, Y.-F., Schwehr, K. A., Kaplan, D. I., Otosaka, S., Roberts, K.350
A., Brinkmeyer, R., Yeager, C. M. & Santschi, P. H. (2011a) Sequestration and remobilization351
of radioiodine (129I) by soil organic matter and possible consequences of the remedial action352
at Savannah River site. Environmental Science & Technology, 45, 9975-9983.353
Xu, C., Zhang, S. J., Ho, Y. F., Miller, E. J., Roberts, K. A., Li, H. P., Schwehr, K. A., Otosaka, S., Kaplan,354
D. I., Brinkmeyer, R., Yeager, C. M. & Santschi, P. H. (2011b) Is soil natural organic matter a355
sink or source for mobile radioiodine (129I) at the Savannah River Site? Geochimica et356
Cosmochimica Acta, 75, 5716-5735.357
Xu, C., Zhong, J., Hatcher, P. G., Zhang, S., Li, H.-P., Ho, Y.-F., Schwehr, K. A., Kaplan, D. I., Roberts, K.358
A., Brinkmeyer, R., Yeager, C. M. & Santschi, P. H. (2012) Molecular environment of stable359
iodine and radioiodine (I-129) in natural organic matter: Evidence inferred from NMR and360
binding experiments at environmentally relevant concentrations. Geochimica et361
Cosmochimica Acta, 97, 166-182.362
Yamada, H., HisamorI, I. & Yonebayashi, K. (2002) Identification of organically bound iodine in soil363
humic substances by size exclusion chromatography/inductively coupled plasma mass364
spectrometry (SEC/ICP-MS). Soil Science and Plant Nutrition, 48, 379-385.365
YamaguchI, N., Nakano, M., Takamatsu, R. & Tanida, H. (2010) Inorganic iodine incorporation into366
soil organic matter: evidence from iodine K-edge X-ray absorption near-edge structure.367
Journal of Environmental Radioactivity, 101, 451-457.368
Yntema, L. F. & Fleming, T. (1939) Volumetric oxidation of iodide to iodate by sodium chlorite.369
Industrial and Engineering Chemistry-Analytical Edition, 11, 0375-0377.370
371

1
Tables
Table 1: Summary of added iodine (129I) species in incubated HA solutions.
Table 2: Measured characteristics of a humic acid (HA) isolated from the Ah horizon of a coniferous plantation soilin Leicestershire (UK); (52o 42’ N, 1o 14’ W; 195 m).
Table 3: Optimised parameter values (first-order rate constants) describing HA-iodine dynamics in the modelshown in Figure 1.

2
Table 1: Summary of added iodine (129I) species in incubated HA solutions.
Solution129I- added(µg 129I L-1)
129IO3- added
(µg 129I L-1)
I22 22.1 0I44 44.1 0I88 88.2 0
IO22 0 22.1IO44 0 44.1IO88 0 88.2
Mix22 11.0 11.0Mix44 22.1 22.1Mix88 44.1 44.1

3
Table 2: Measured characteristics of a humic acid (HA) isolated from the Ah horizon of a coniferous plantation soilin Leicestershire (UK); (52o 42’ N, 1o 14’ W; 195 m).
Characteristic Value Units Source
Ash content 0.66* % Marshall (1992)Total acidity 6.49* molc kg-1 Marshall (1992)Dissolved organic carbon 3.67 mg ml-1 DOC analysis127Iodide# 15.1 µg I L-1 SEC analysisOrg-127I# 98.0 µg I L-1 SEC analysis
*Ash content and total acidity are the mean of two measurements quoted by Marshall (1992).# Measured in HA suspensions

4
Table 3: Optimised parameter values (first-order rate constants) describing HA-iodine dynamics in the modelshown in Figure 1.
Rate constant Mean (hr-1) S. D.
k1 0.00411 0.00010
k2 0.000467 0.00004
k3 0.000316 0.00002
k4 2.62 0.00000
k5 0.157 0.00003

Figures
Figure 1: Conceptual model describing transformations of spiked 129I in the presence of HA. Rate constants k1–k5
describe first-order rate equations.
Figure 2: Modelled (lines) and measured (symbols) change in 129I concentrations with time following spiking with 129Iat a range of concentrations and species compositions. Species measured included 129I¯ (black circles, black lines),129IO3¯ (open squares , dashed lines) and Org-129I (grey triangles, grey lines). Error bars show standard error oftriplicate measurements.
Figure 3: Change in the ratio of measured iodide to added iodide over time, following addition of iodide (opensymbols) and mixed iodide/iodate 129I spikes (closed symbols). Total concentrations of 129I added were: 22.1 µg L-1
(circles), 44.1 µg L-1 (squares) and 88.2 µg L-1 (triangles).
Figure 4: Change in ratio of measured iodate to added iodate over time, following addition of iodate (open symbols)and mixed iodide/iodate 129I spikes (closed symbols). Total concentrations of 129I added were: 22.1 µg L-1 (circles),44.1 µg L-1 (squares) and 88.2 µg L-1 (triangles).
Figure 5: Comparison of total concentrations of iodine-129 species in solution in mixed and single spiked systems attotal iodine concentrations of 44 µg L-1 (open symbols) and 88 µg L-1 (closed symbols). Dashed line = 1:1, squaresymbols = iodate, circles = iodide, triangles = Org-I.
Figure 6: Cumulative ICPS (integrated counts per second) as a percentage of total counts, from size exclusionchromatograph of 129I (thick black line) and 127I (thick grey line); 25%, 50% and 75 % of cumulated ICPS are indicatedby circles, squares and diamonds, respectively. The Org-I section of 127I (thin black line) and 129I (thin grey line) SECchromatograms (2o Y-axis) are also shown. All data are for the Mix88 solution (Table 1) after 77 days incubation.

Figure 1: Conceptual model describing transformations of spiked 129I in the presence of HA. Rate constants k1–k5
describe first-order rate equations.
IO3¯
k3
k2
k1
k5
k4
I¯
Org-I

3
Figure 2: Modelled (lines) and measured (symbols) change in 129I concentrations with time following spiking with 129I at a range of concentrations and species compositions.
Species measured included 129I¯ (black circles , black lines), 129IO3¯ (open squares , dashed lines) and Org-129I (grey triangles, grey lines). Error bars show standard errorof triplicate measurements.
0
5
10
15
20
25
0 500 1000 1500 2000
Iod
ine
(ug/
L)
Time (hr)
I22
0
10
20
30
40
50
0 500 1000 1500 2000
Iod
ine
(ug/
L)
Time (hr)
I44
0
20
40
60
80
100
0 500 1000 1500 2000
Iod
ine
(ug/
L)
Time (hr)
I88
0
5
10
15
20
25
0 500 1000 1500 2000
Iod
ine
(ug/
L)
Time (hr)
IO22
0
10
20
30
40
50
0 500 1000 1500 2000
Iod
ine
(ug/
L)Time (hr)
IO44
0
20
40
60
80
100
0 500 1000 1500 2000
Iod
ine
(ug/
L)
Time (hr)
IO88
0
5
10
15
20
25
0 500 1000 1500 2000
Iod
ine
(ug/
L)
Time (hr)
Mix22
0
10
20
30
40
50
0 500 1000 1500 2000
Iod
ine
(ug/
L)
Time (hr)
Mix44
0
20
40
60
80
100
0 500 1000 1500 2000
Iod
ine
(ug/
L)
Time (hr)
Mix88

4
Figure 3: Change in the ratio of measured iodide to added iodide over time, following addition of iodide (opensymbols) and mixed iodide/iodate 129I spikes (closed symbols). Total concentrations of 129I added were: 22.1 µg L-1
(circles), 44.1 µg L-1 (squares) and 88.2 µg L-1 (triangles).
0
0.2
0.4
0.6
0.8
1
1.2
1.4
1.6
1.8
2
0 200 400 600 800 1000 1200 1400 1600 1800 2000
I-m
eas
ure
d/
I-ad
de
d
Incubation Time (hr)

5
Figure 4: Change in ratio of measured iodate to added iodate over time, following addition of iodate (open symbols)and mixed iodide/iodate 129I spikes (closed symbols). Total concentrations of 129I added were: 22.1 µg L-1 (circles),44.1 µg L-1 (squares) and 88.2 µg L-1 (triangles).
0.0
0.2
0.4
0.6
0.8
1.0
1.2
0 200 400 600 800 1000 1200 1400 1600 1800 2000
IO3¯
me
asu
red
/IO
3¯
add
ed
Incubation Time (hr)
6
Figure 5: Comparison of total concentrations of iodine-129 species in solution in mixed and single spiked systems attotal iodine concentrations of 44 µg L-1 (open symbols) and 88 µg L-1 (closed symbols). Dashed line = 1:1 relationship,square symbols = iodate, circles = iodide, triangles = Org-I.
0
10
20
30
40
50
60
70
0 10 20 30 40 50 60 70
Mix
ed
spe
cie
ssp
ike
dsy
ste
ms
(ug
L-1)
Sum of species in single species spiked systems (mg L-1)

7
Figure 6: Cumulative ICPS (integrated counts per second) as a percentage of total integrated counts, from sizeexclusion chromatograph of 129I (thick black line) and 127I (thick grey line); 25%, 50% and 75 % of cumulated ICPS areindicated by circles, squares and diamonds, respectively. The Org-I section of 127I (thin black line) and 129I (thin greyline) SEC chromatograms (2o Y-axis) are also shown. All data are for the Mix88 solution (Table 1) after 77 daysincubation.
0
1000
2000
3000
4000
5000
6000
7000
8000
0
10
20
30
40
50
60
70
80
90
100
300 400 500 600 700 800 900
ICP
S
Cu
mu
lati
veIC
PS
(%o
fto
tal)
Time (s)

1
Electronic Annex A: Correction applied for the presence of 127I in the 129I SRM 4949C:
All measured 129I concentrations had a correction applied to nominally ascribe all iodine added in 129I spikes (129I +
127I) to 129I, for ease of description:
Iଵଶଽ = I୫ ୟୣୱ × 1.12 × (127 129⁄ )ଵଶଽ (A1)
Where 129I = ‘corrected’ concentration of I from the spike in solution (µg L-1) i.e. (129I + 127I present in the spike),
129Imeas = measured concentration of 129I (µg L-1), 1.12 corrects for the presence of 12 % 127I in the 129I and (127/129) is
a gravimetric correction. The corresponding correction was also applied to measurements of 127I, according to Eqn.
A2:
Iଵଶ = I୫ ୟୣୱ− ൫0.12 × I୫ଵଶଽ ൯ଵଶ (A2)
Where 127I = ‘corrected’ concentration of 127I in solution (µg L-1) i.e. 127I minus the 127I present as a result of thespiking, and 127Imeas = measured concentration of 127I (µg L-1).