Investors seminar - London presentation slides - Rio Tinto · 5lr 7lqwr $oo 5ljkwv 5hvhuyhg 0lqhudo...
77
6 December 2016 Investor Seminar London
Transcript of Investors seminar - London presentation slides - Rio Tinto · 5lr 7lqwr $oo 5ljkwv 5hvhuyhg 0lqhudo...

6 December 2016
Investor SeminarLondon
©2016, Rio Tinto, All Rights Reserved
Cautionary statementsThis presentation has been prepared by Rio Tinto plc and Rio Tinto Limited (“Rio Tinto”). By accessing/attending this presentation you acknowledge that you have read and understood the following statement.Forward-looking statementsThis document contains certain forward-looking statements with respect to the financial condition, results of operations and business of the Rio Tinto Group. These statements are forward-looking statements within the meaning of Section 27A of the US Securities Act of 1933, and Section 21E of the US Securities Exchange Act of 1934. The words “intend”, “aim”, “project”, “anticipate”, “estimate”, “plan”, “believes”, “expects”, “may”, “should”, “will”, “target”, “set to” or similar expressions, commonly identify such forward-looking statements.Examples of forward-looking statements include those regarding estimated ore reserves, anticipated production or construction dates, costs, outputs and productive lives of assets or similar factors. Forward-looking statements involve known and unknown risks, uncertainties, assumptions and other factors set forth in this presentation.For example, future ore reserves will be based in part on market prices that may vary significantly from current levels. These may materially affect the timing and feasibility of particular developments. Other factors include the ability to produce and transport products profitably, demand for our products, changes to the assumptions regarding the recoverable value of our tangible and intangible assets, the effect of foreign currency exchange rates on market prices and operating costs, and activities by governmental authorities, such as changes in taxation or regulation, and political uncertainty.In light of these risks, uncertainties and assumptions, actual results could be materially different from projected future results expressed or implied by these forward-looking statements which speak only as to the date of this presentation. Except as required by applicable regulations or by law, the Rio Tinto Group does not undertake any obligation to publicly update or revise any forward-looking statements, whether as a result of new information or future events. The Group cannot guarantee that its forward-looking statements will not differ materially from actual results. In this presentation all figures are US dollars unless stated otherwise.DisclaimerNeither this presentation, nor the question and answer session, nor any part thereof, may be recorded, transcribed, distributed, published or reproduced in any form, except as permitted by Rio Tinto. By accessing/ attending this presentation, you agree with the foregoing and, upon request, you will promptly return any records or transcripts at the presentation without retaining any copies. This presentation contains a number of non-IFRS financial measures. Rio Tinto management considers these to be key financial performance indicators of the business and they are defined and/or reconciled in Rio Tinto’s annual results press release and/or Annual report. Reference to consensus figures are not based on Rio Tinto’s own opinions, estimates or forecasts and are compiled and published without comment from, or endorsement or verification by, Rio Tinto. The consensus figures do not necessarily reflect guidance provided from time to time by Rio Tinto where given in relation to equivalent metrics, which to the extent available can be found on the Rio Tinto website.By referencing consensus figures, Rio Tinto does not imply that it endorses, confirms or expresses a view on the consensus figures. The consensus figures are provided for informational purposes only and are not intended to, nor do they, constitute investment advice or any solicitation to buy, hold or sell securities or other financial instruments. No warranty or representation, either express or implied, is made by Rio Tinto or its affiliates, or their respective directors, officers and employees, in relation to the accuracy, completeness or achievability of the consensus figures and, to the fullest extent permitted by law, no responsibility or liability is accepted by any of those persons in respect of those matters. Rio Tinto assumes no obligation to update, revise or supplement the consensus figures to reflect circumstances existing after the date hereof.
2
©2016, Rio Tinto, All Rights Reserved 3
Mineral Resources and Ore ReservesThe Pilbara Mineral Resource and Ore Reserve estimates which appear on slide 30 are reported on a 100% basis. These Mineral Resource and Ore Reserve estimates, together with the ownership percentages for each joint venture were set out in the Mineral Resource and Ore Reserve statements in the 2012 to 2015 Rio Tinto annual reports to shareholders released to the market on 15 March 2013, 14 March 2014, 6 March 2015 and 3 March 2016 respectively. The Competent Persons responsible for reporting of those Mineral Resources and Ore Reserves were B Sommerville (Resources) and L Fouche (Reserves 2012-2014) and A Do (Reserves 2015). The Mineral Resource estimate for Resolution which appears on slide 53 was reported in Rio Tinto’s 2015 Annual Report dated 2 March 2016 and released to the market on 3 March 2016. This resource estimate is reported on a 100% basis. The Competent Person responsible for that previous reporting was C Hehnke (AusIMM). affects these resources estimates, and confirms that all material assumptions and technical parameters underpinning the estimates continue to apply and have not materially changed. The Mineral Resource estimates which appear on slide 65 are based on the Mineral Resource statements in the 2015 Rio Tinto Annual Report to shareholders released to the market on 3 March 2016. The Competent Person responsible for reporting of the Mineral Resources was J Garcia (Eurogeol) a full time employee of Rio Tinto. Mineral Resources were reported for Lithium at 117Mt @1.8% Li2O (equivalent to 2.1Mt Li2O) and Borates at 18Mt B2O3 (representing 117Mt @15.53% B2O3).Rio Tinto is not aware of any new information or data that materially affects the above Mineral Resource and Ore Reserve estimates as reported in the 2015 annual report. All material assumptions on which the estimates in the 2015 annual report were based continue to apply and have not materially changed. The form and context in which those findings are presented have not been materially modified. Mineral Resources are reported exclusive of Ore Reserves. Ore Reserves are reported as product tonnes. Mineral Resources are reported on an in situ basis.Production TargetsThe production target for Amrun shown on slide 9 was disclosed in a release to the market dated 27 November 2015 (“Rio Tinto approves US$1.9 billion Amrun (South of Embley) bauxite project”).The production target for Oyu Tolgoi shown on slide 9 is the average production 2025-2030, including open pit production. This production target was disclosed in a release to the market on 6 May 2016 (“Rio Tinto approves development of Oyu Tolgoi underground mine”).All material assumptions underpinning these production targets continue to apply and have not materially changed.
Supporting statements
J-S Jacques
Investor SeminarChief executive

©2016, Rio Tinto, All Rights Reserved
Consistent delivery of value
5
Long-term strategyCash focusCapital discipline and shareholder returnsTeam and performance culture
©2016, Rio Tinto, All Rights Reserved
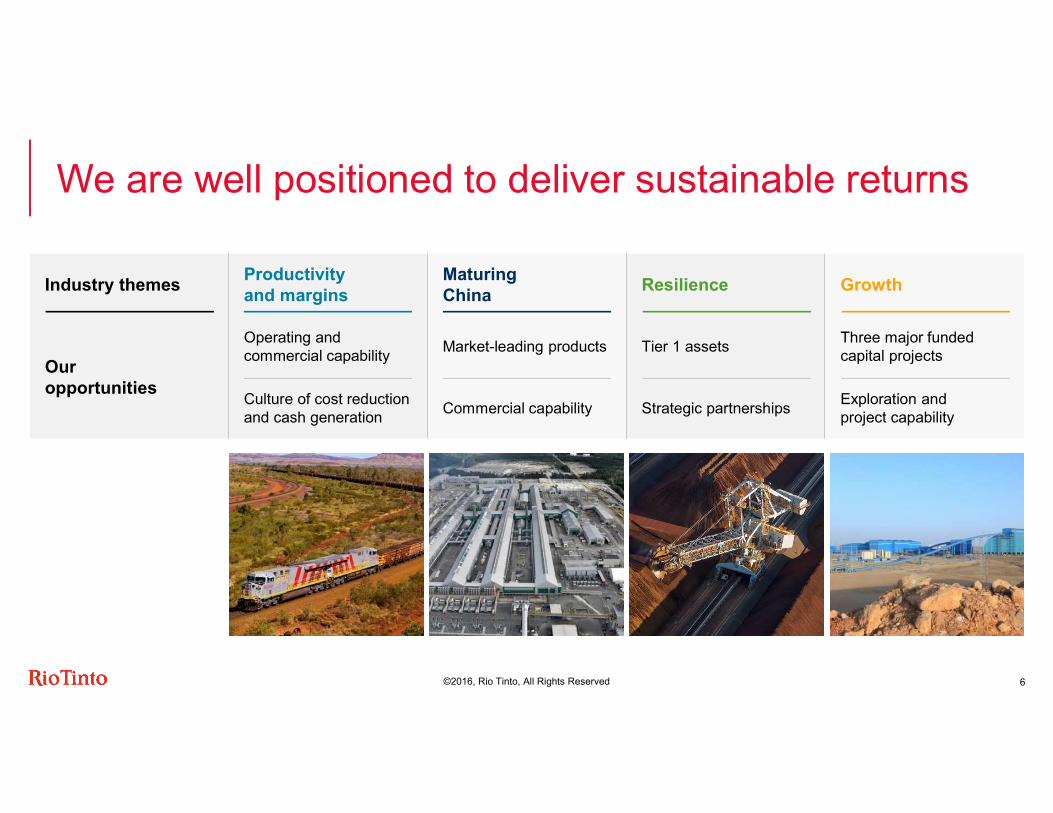
Industry themes Productivity and margins
Maturing China Resilience Growth
Our opportunities
Operating andcommercial capability Market-leading products Tier 1 assets Three major funded
capital projectsCulture of cost reduction and cash generation Commercial capability Strategic partnerships Exploration and
project capability
We are well positioned to deliver sustainable returns
6
©2016, Rio Tinto, All Rights Reserved
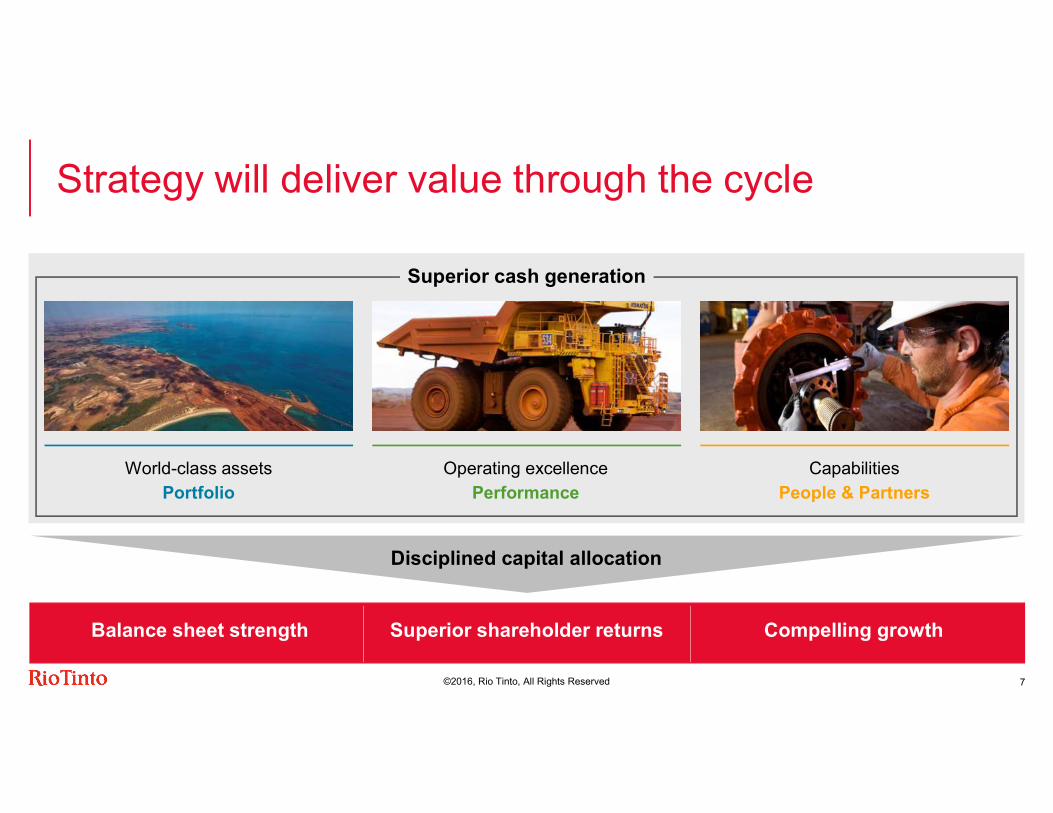
Disciplined capital allocation
World-class assetsPortfolio
Operating excellence Performance
CapabilitiesPeople & Partners
Balance sheet strength Superior shareholder returns Compelling growth
Superior cash generation
Strategy will deliver value through the cycle
7
©2016, Rio Tinto, All Rights Reserved
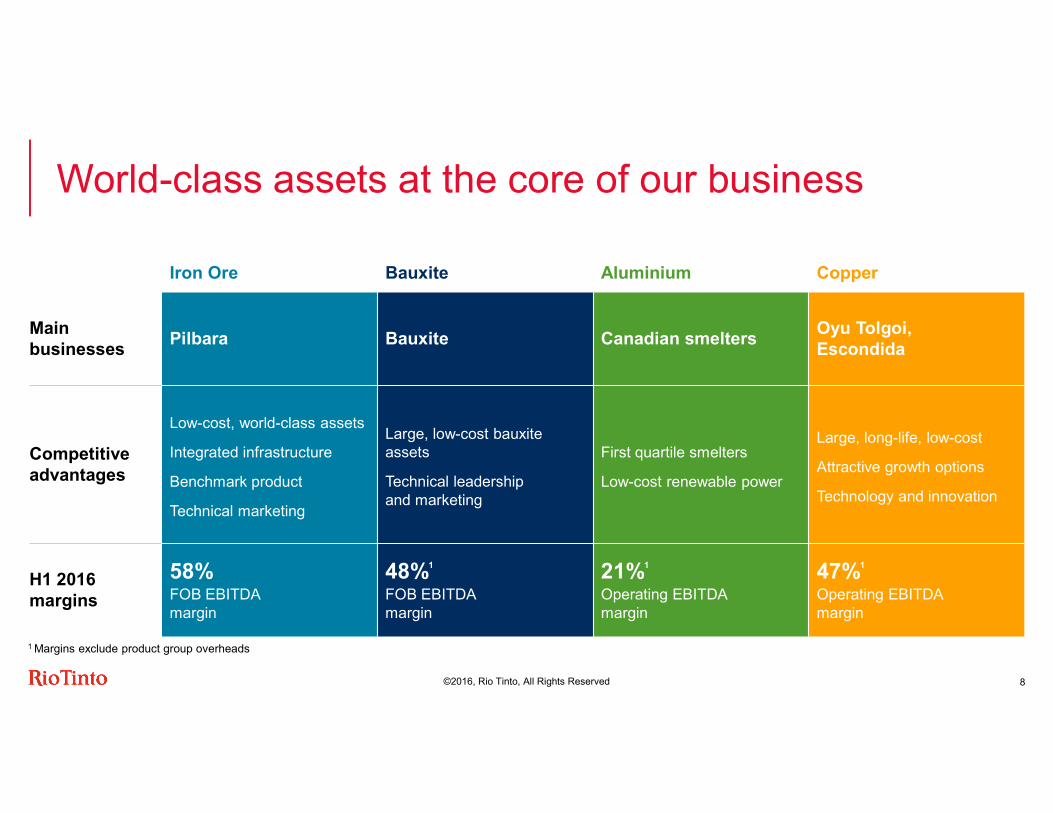
World-class assets at the core of our businessIron Ore Bauxite Aluminium Copper
Mainbusinesses Pilbara Bauxite Canadian smelters Oyu Tolgoi,
Escondida
Competitive advantages
Low-cost, world-class assetsIntegrated infrastructureBenchmark productTechnical marketing
Large, low-cost bauxite assetsTechnical leadership and marketing
First quartile smeltersLow-cost renewable power
Large, long-life, low-cost Attractive growth optionsTechnology and innovation
H1 2016 margins
58%FOB EBITDA margin
48%1
FOB EBITDA margin
21%1
Operating EBITDA margin
47%1
Operating EBITDA margin
8
1 Margins exclude product group overheads
©2016, Rio Tinto, All Rights Reserved
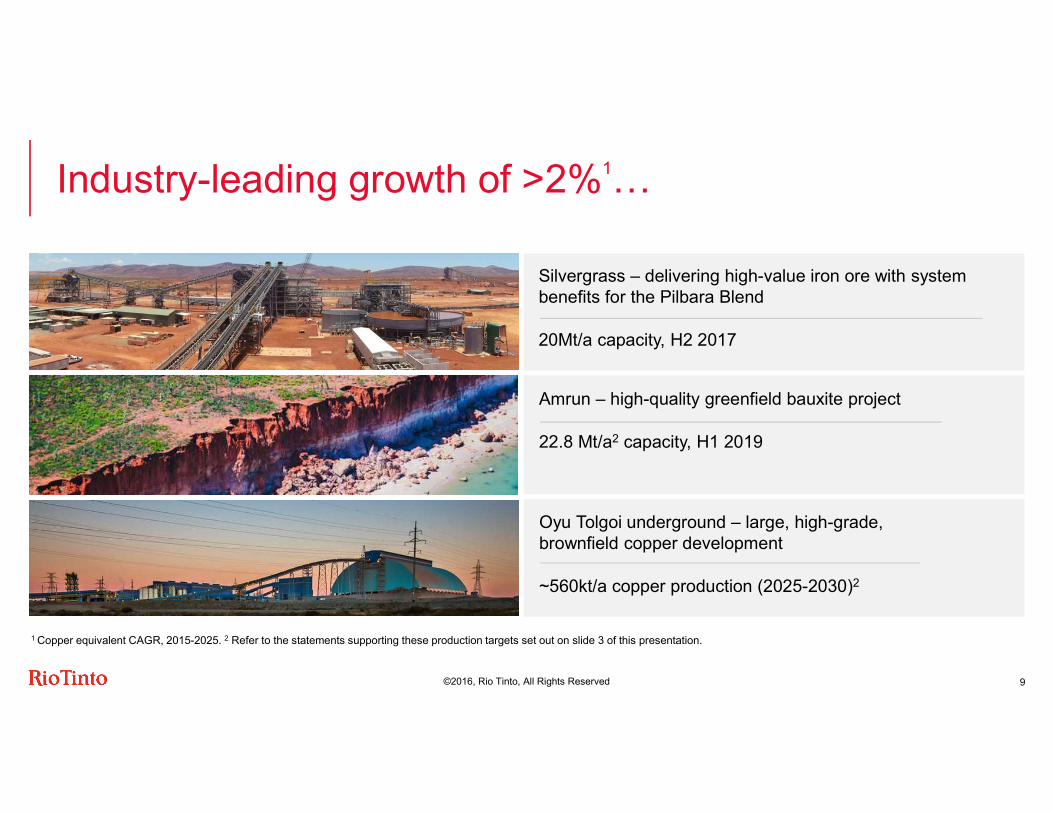
Oyu Tolgoi underground – large, high-grade, brownfield copper development~560kt/a copper production (2025-2030)2
Amrun – high-quality greenfield bauxite project22.8 Mt/a2 capacity, H1 2019
Silvergrass – delivering high-value iron ore with system benefits for the Pilbara Blend20Mt/a capacity, H2 2017
Industry-leading growth of >2%1…
9
1 Copper equivalent CAGR, 2015-2025. 2 Refer to the statements supporting these production targets set out on slide 3 of this presentation.
©2016, Rio Tinto, All Rights Reserved
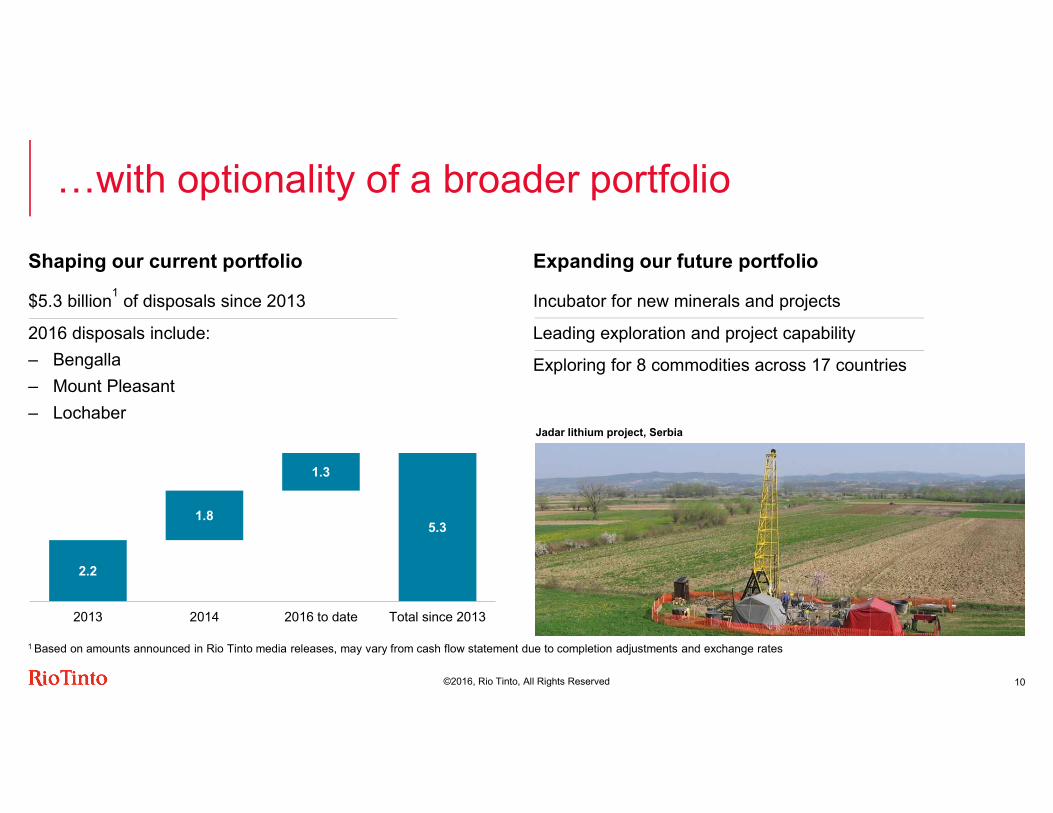
…with optionality of a broader portfolio
Incubator for new minerals and projectsLeading exploration and project capabilityExploring for 8 commodities across 17 countries
$5.3 billion1 of disposals since 20132016 disposals include:– Bengalla– Mount Pleasant – Lochaber
3,208
2.2
1.8
1.3
5.3
2013 2014 2016 to date Total since 2013
Jadar lithium project, Serbia
New picture
Shaping our current portfolio Expanding our future portfolio
10
1 Based on amounts announced in Rio Tinto media releases, may vary from cash flow statement due to completion adjustments and exchange rates
©2016, Rio Tinto, All Rights Reserved
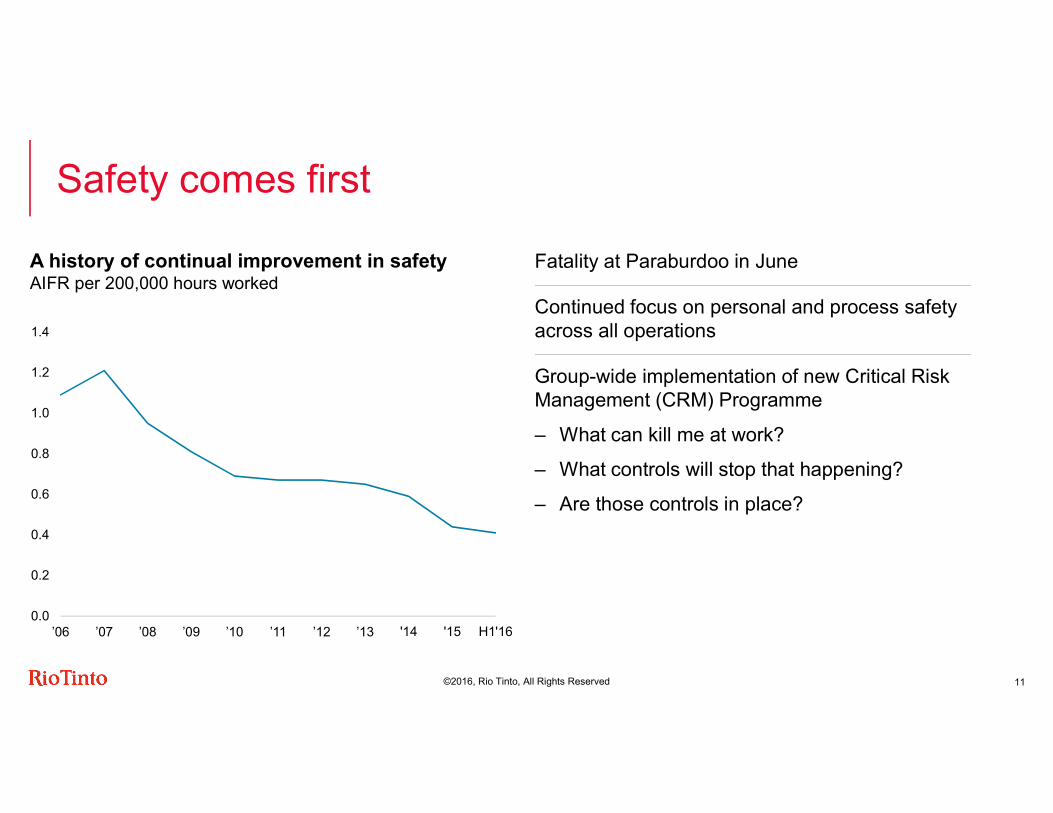
Safety comes first
0.0
0.2
0.4
0.6
0.8
1.0
1.2
1.4
’06 ’07 ’08 ’09 ’10 ’11 ’12 ’13 '14 '15 H1'16
A history of continual improvement in safetyAIFR per 200,000 hours worked
Fatality at Paraburdoo in JuneContinued focus on personal and process safety across all operationsGroup-wide implementation of new Critical Risk Management (CRM) Programme– What can kill me at work?– What controls will stop that happening? – Are those controls in place?
11
©2016, Rio Tinto, All Rights Reserved
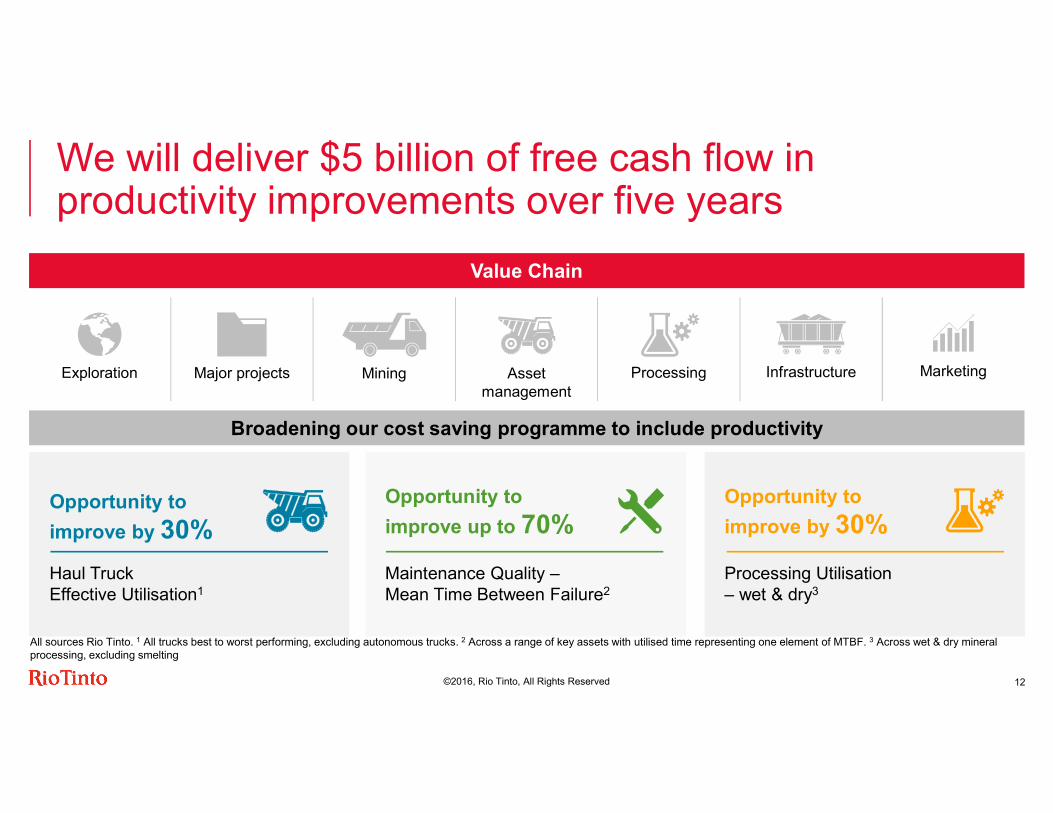
We will deliver $5 billion of free cash flow in productivity improvements over five years
Opportunity to improve up to 70%Maintenance Quality –Mean Time Between Failure2
Opportunity to improve by 30%
All sources Rio Tinto. 1 All trucks best to worst performing, excluding autonomous trucks. 2 Across a range of key assets with utilised time representing one element of MTBF. 3 Across wet & dry mineral processing, excluding smelting
Processing Utilisation – wet & dry3
Value Chain
Broadening our cost saving programme to include productivity
Mining Asset management
Opportunity to improve by 30%Haul Truck Effective Utilisation1
ProcessingExploration InfrastructureMajor projects Marketing
12
©2016, Rio Tinto, All Rights Reserved
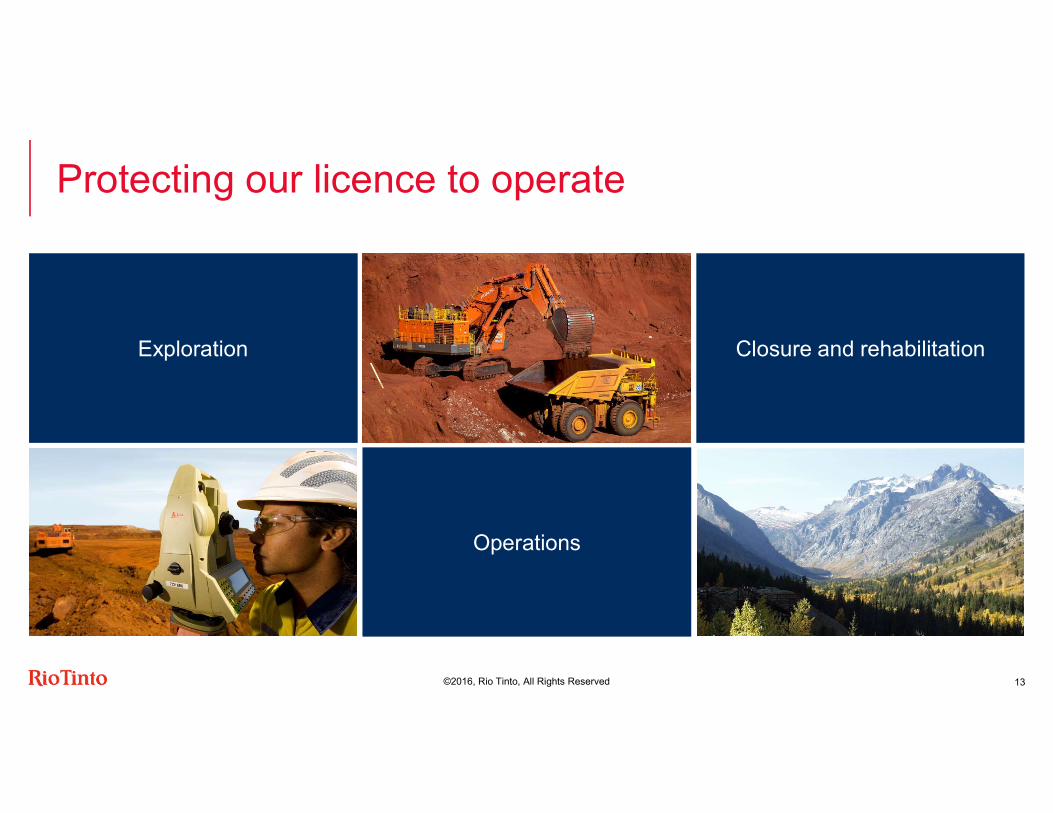
Protecting our licence to operate
13
Closure and rehabilitationExploration
Operations
©2016, Rio Tinto, All Rights Reserved
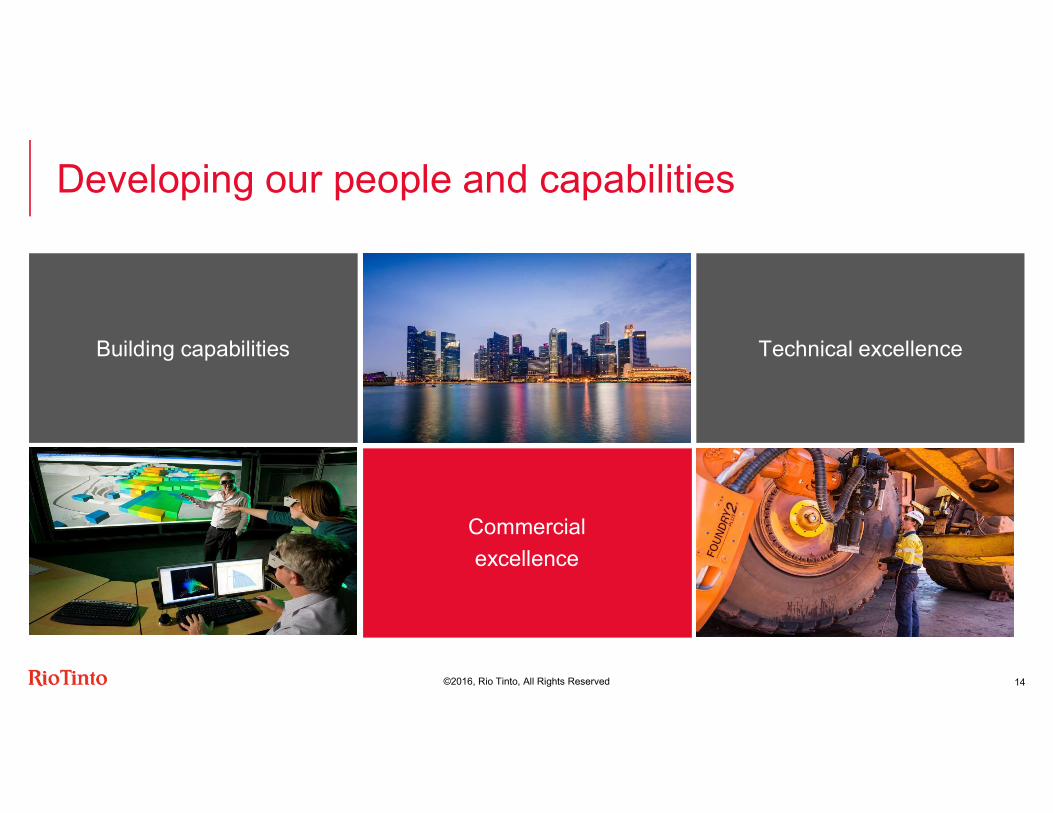
Developing our people and capabilities
14
Technical excellenceBuilding capabilities
Commercial excellence
©2016, Rio Tinto, All Rights Reserved
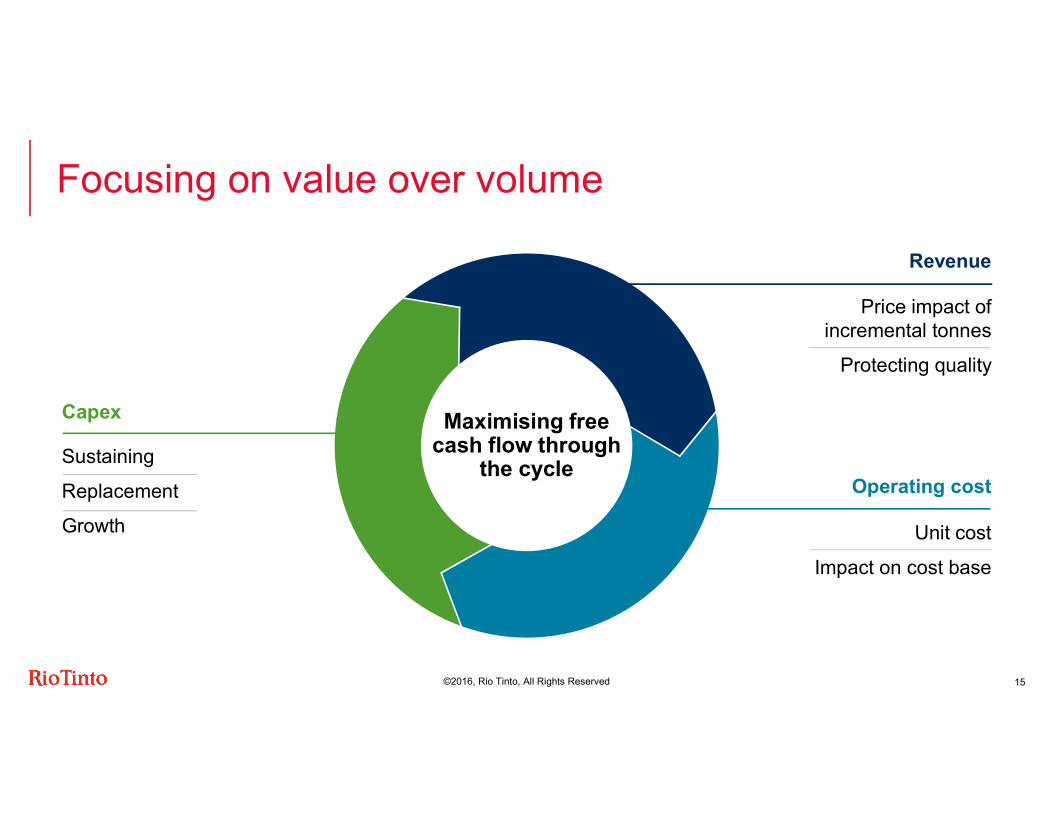
Focusing on value over volume
CapexSustainingReplacementGrowth
Operating costUnit cost
Impact on cost base
RevenuePrice impact of
incremental tonnesProtecting quality
Maximising free cash flow through the cycle
15
©2016, Rio Tinto, All Rights Reserved
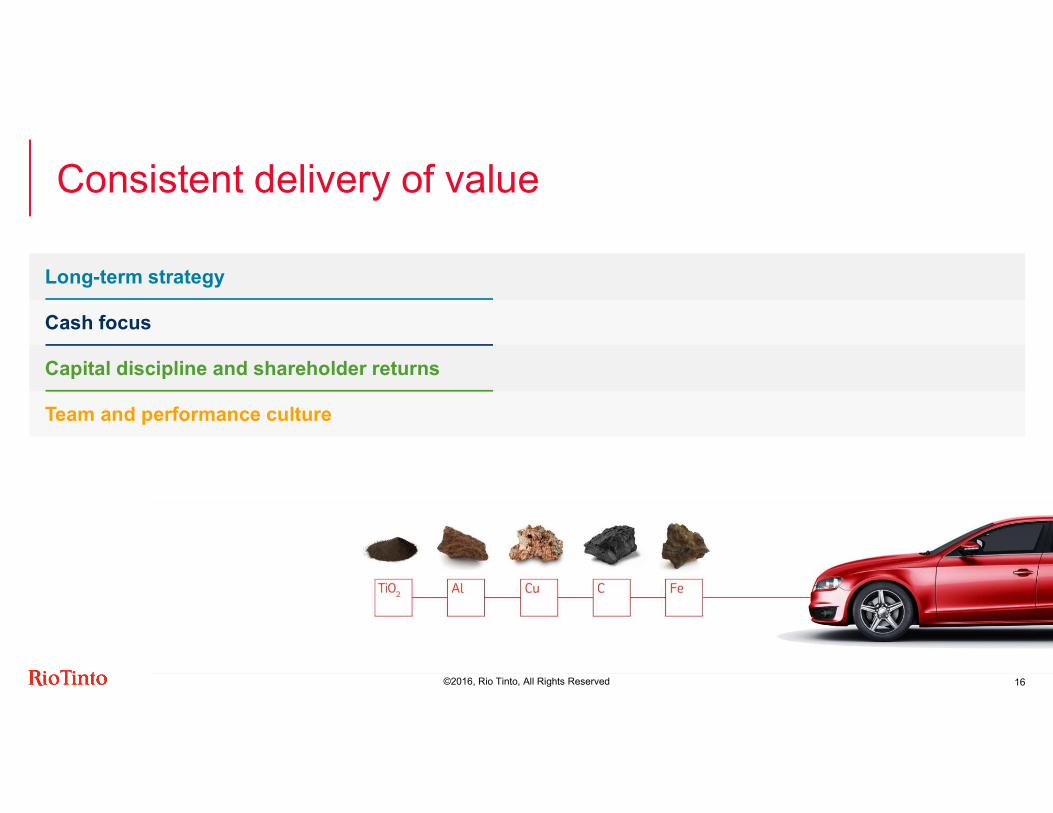
Consistent delivery of value
16
Long-term strategyCash focusCapital discipline and shareholder returnsTeam and performance culture

Chris Lynch
Investor SeminarChief financial officer
©2016, Rio Tinto, All Rights Reserved
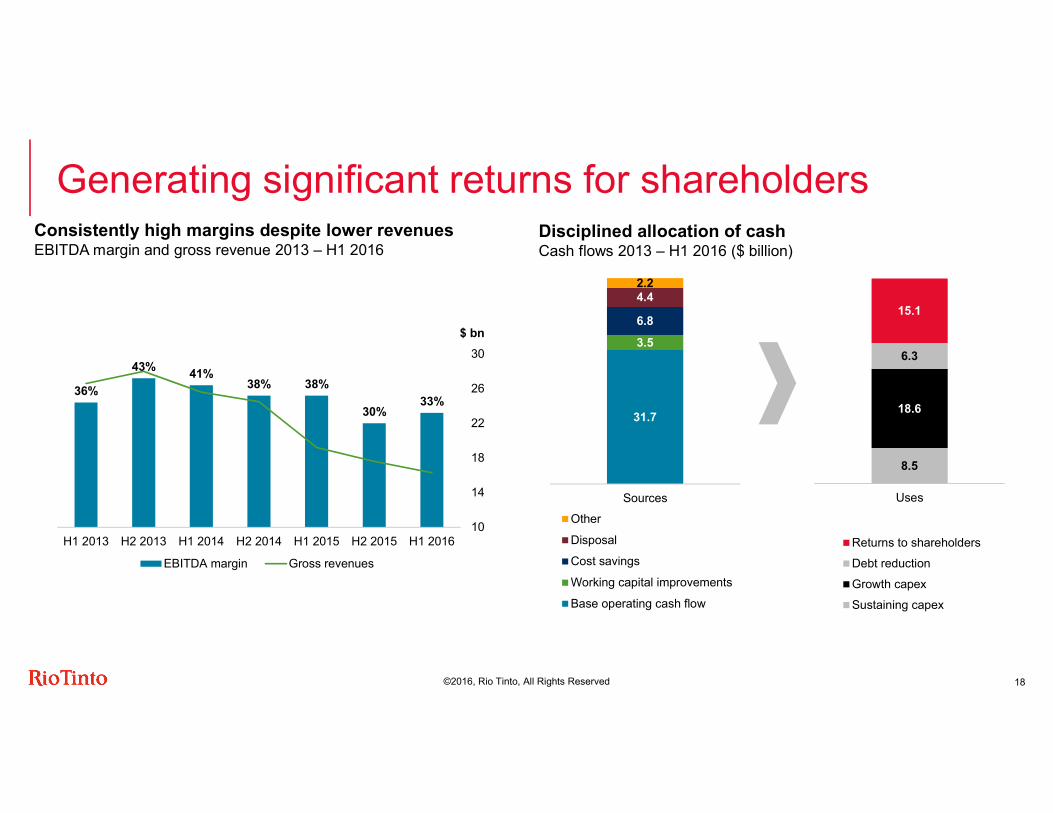
Consistently high margins despite lower revenuesEBITDA margin and gross revenue 2013 – H1 2016
Generating significant returns for shareholders
36%43% 41% 38% 38%
30% 33%
101418222630
H1 2013 H2 2013 H1 2014 H2 2014 H1 2015 H2 2015 H1 2016
$ bn
EBITDA margin Gross revenues
8.5
18.6
6.3
15.1
Uses
Returns to shareholdersDebt reductionGrowth capexSustaining capex
31.7
3.56.84.42.2
SourcesOtherDisposalCost savingsWorking capital improvementsBase operating cash flow
18
Disciplined allocation of cashCash flows 2013 – H1 2016 ($ billion)
©2016, Rio Tinto, All Rights Reserved
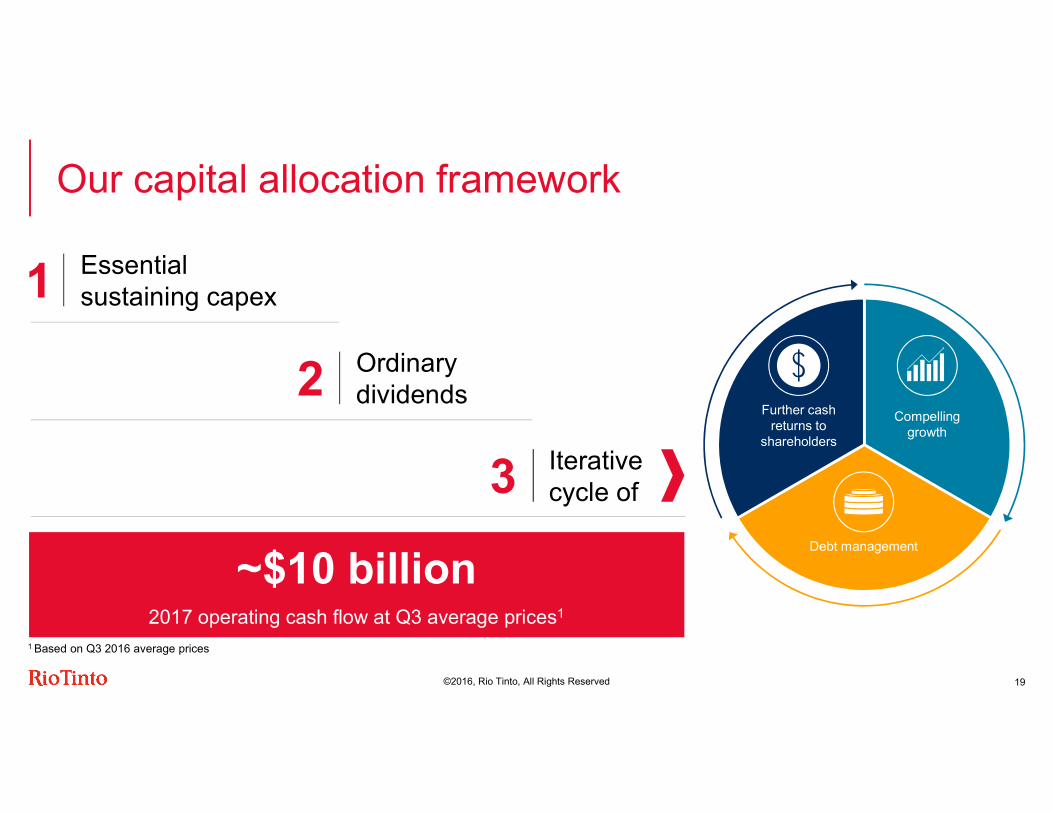
Further cash returns to
shareholdersCompelling
growth
Debt management
Essential sustaining capex1
Our capital allocation framework
~$10 billion2017 operating cash flow at Q3 average prices1
Ordinary dividends2
Iterative cycle of3
19
~$10 billion2017 operating cash flow at Q3 average prices1
1 Based on Q3 2016 average prices
©2016, Rio Tinto, All Rights Reserved
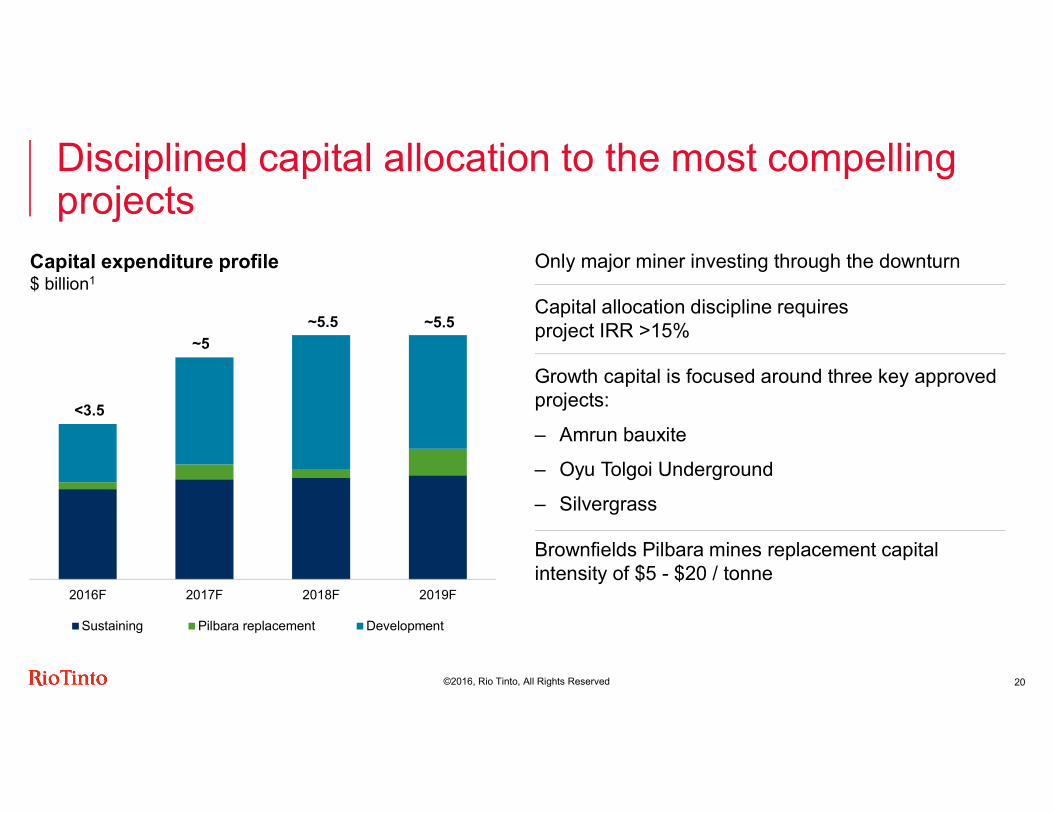
Disciplined capital allocation to the most compelling projectsOnly major miner investing through the downturnCapital allocation discipline requires project IRR >15%Growth capital is focused around three key approved projects:– Amrun bauxite– Oyu Tolgoi Underground – SilvergrassBrownfields Pilbara mines replacement capital intensity of $5 - $20 / tonne
20
2016F 2017F 2018F 2019FSustaining Pilbara replacement Development
Capital expenditure profile$ billion1
<3.5
~5~5.5 ~5.5

©2016, Rio Tinto, All Rights Reserved
Net debt and gearing ratio1 at 30 June 2016$ billion
12.9
26.1
11.7
23.6
23%30%
35%36%
Rio Tinto Peer 1 Peer 2 Peer 3
Best in sector balance sheet is a competitive advantageStable foundation during market volatilityEnables counter-cyclical investment in compelling growth Supports shareholder returns through the cycleGuidance of 20-30% gearing ratio through the cycle – Remains in lower half of gearing range
22.118.1 16.1
12.5 13.7 13.8 12.928%25%
22% 19% 21%24% 23%
Jun-13 Dec-13 Jun-14 Dec-14 Jun-15 Dec-15 Jun-16
Rio Tinto net debt and gearing ratio1$ billion
21
1 Gearing ratio ( ) = net debt / (net debt + book equity)
©2016, Rio Tinto, All Rights Reserved
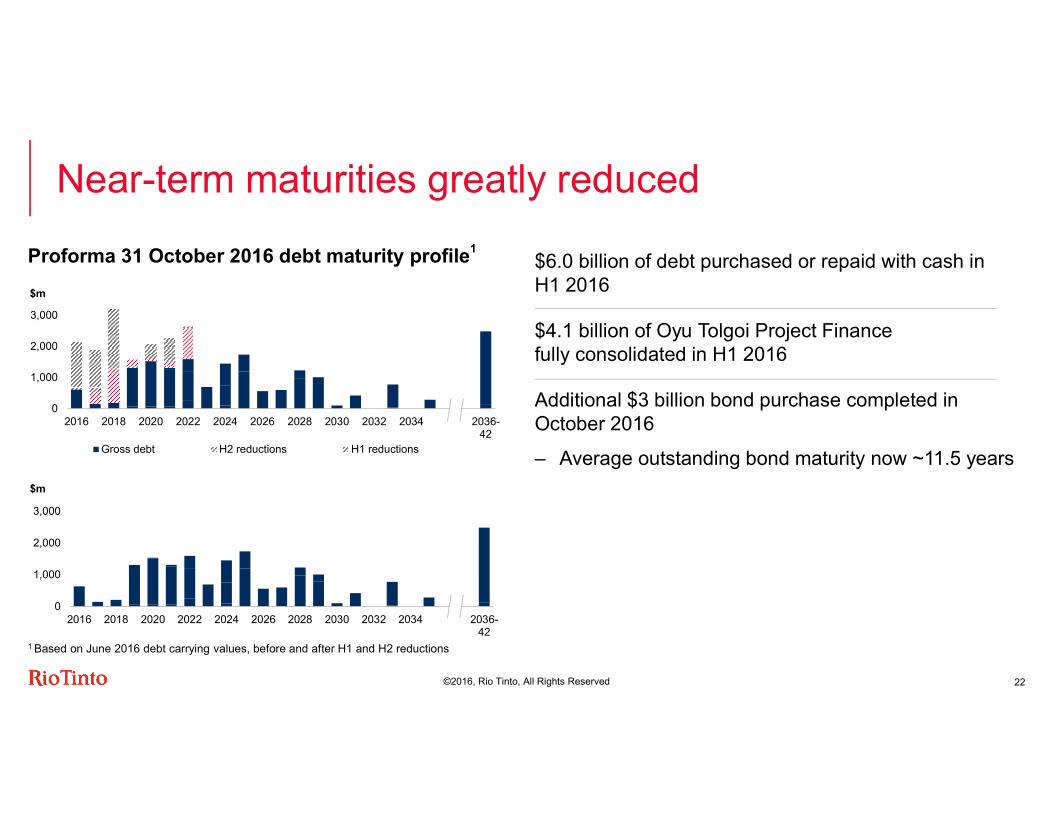
Proforma 31 October 2016 debt maturity profile1
Near-term maturities greatly reduced$6.0 billion of debt purchased or repaid with cash in H1 2016$4.1 billion of Oyu Tolgoi Project Finance fully consolidated in H1 2016Additional $3 billion bond purchase completed in October 2016– Average outstanding bond maturity now ~11.5 years
22
01,0002,0003,000
2016 2018 2020 2022 2024 2026 2028 2030 2032 2034 2036-42
Gross debt H2 reductions H1 reductions
$m
0
1,000
2,000
3,000
2016 2018 2020 2022 2024 2026 2028 2030 2032 2034 2036-42
$m
1 Based on June 2016 debt carrying values, before and after H1 and H2 reductions
©2016, Rio Tinto, All Rights Reserved
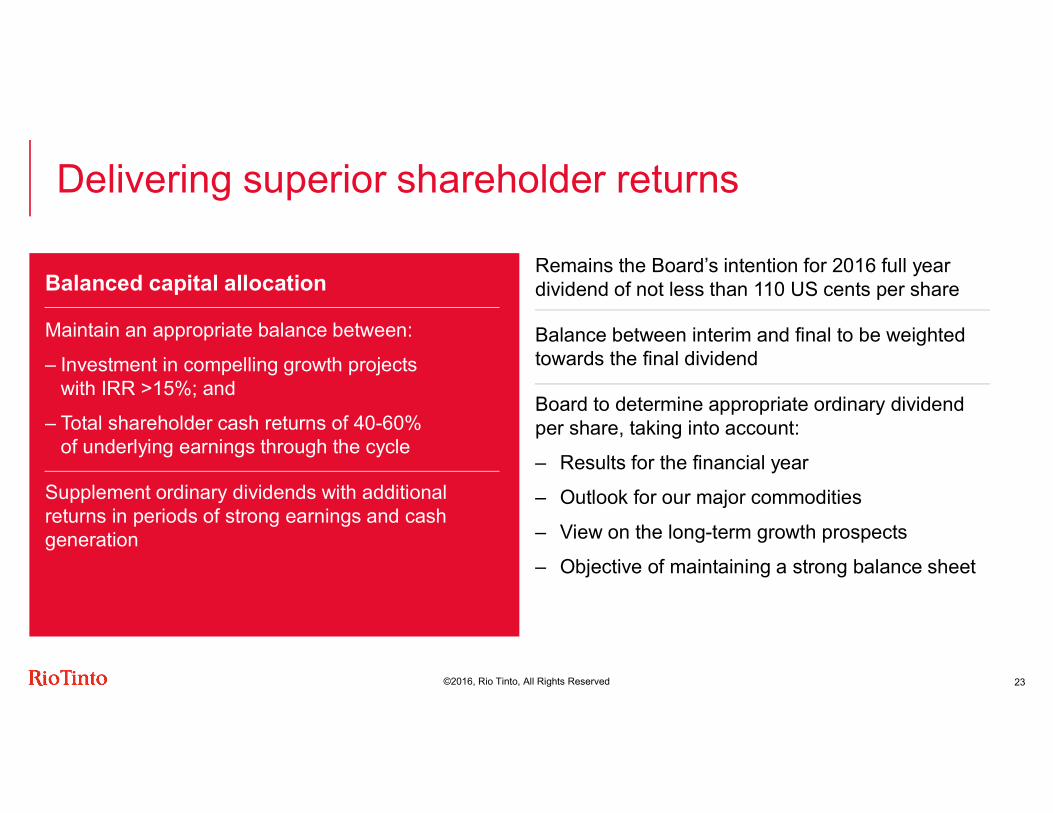
Delivering superior shareholder returnsBalanced capital allocationMaintain an appropriate balance between: – Investment in compelling growth projects
with IRR >15%; and– Total shareholder cash returns of 40-60%
of underlying earnings through the cycleSupplement ordinary dividends with additional returns in periods of strong earnings and cash generation
Remains the Board’s intention for 2016 full year dividend of not less than 110 US cents per shareBalance between interim and final to be weighted towards the final dividendBoard to determine appropriate ordinary dividend per share, taking into account:– Results for the financial year– Outlook for our major commodities– View on the long-term growth prospects– Objective of maintaining a strong balance sheet
23

Chris Salisbury
Delivering optimal valueChief executive, Iron Ore
©2016, Rio Tinto, All Rights Reserved
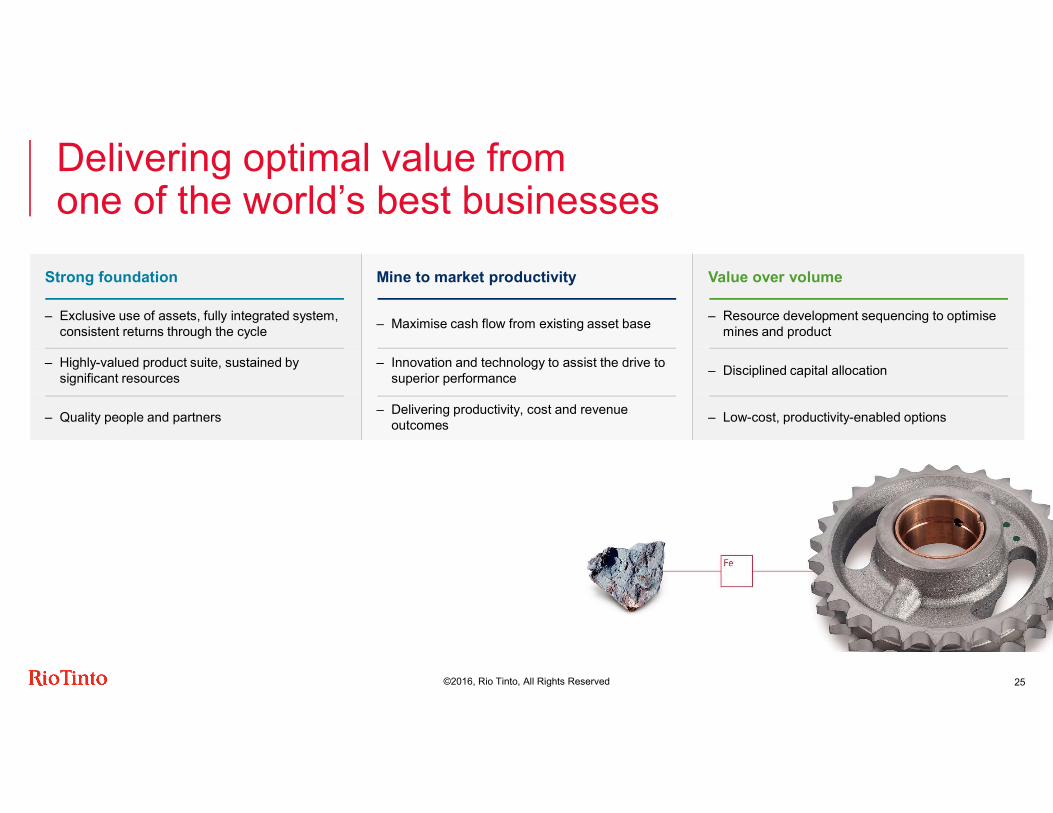
Delivering optimal value from one of the world’s best businessesStrong foundation Mine to market productivity Value over volume– Exclusive use of assets, fully integrated system,
consistent returns through the cycle – Maximise cash flow from existing asset base – Resource development sequencing to optimise mines and product
– Highly-valued product suite, sustained by significant resources
– Innovation and technology to assist the drive to superior performance – Disciplined capital allocation
– Quality people and partners – Delivering productivity, cost and revenue outcomes – Low-cost, productivity-enabled options
25
©2016, Rio Tinto, All Rights Reserved
0.0
0.2
0.4
0.6
0.8
1.0
1.2
1.4
2006
2007
2008
2009
2010
2011
2012
2013
2014
2015
2016
12 mo
nth ro
lling A
IFR
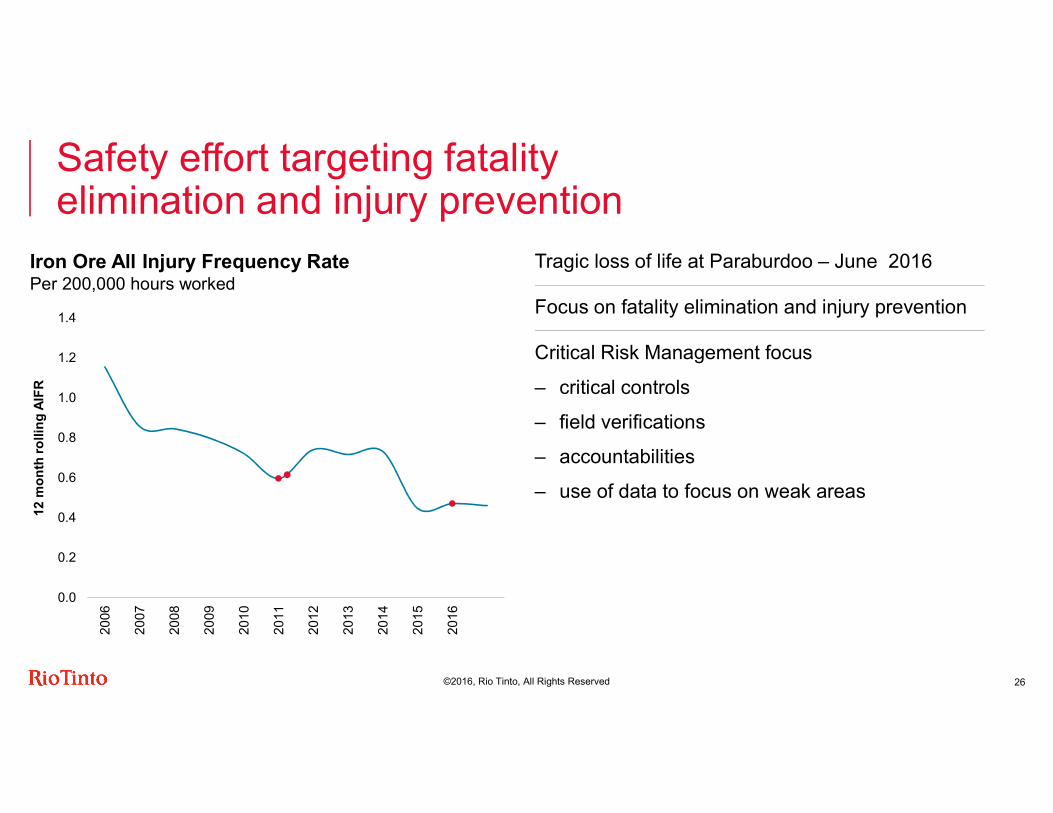
Safety effort targeting fatality elimination and injury prevention
26
Tragic loss of life at Paraburdoo – June 2016 Focus on fatality elimination and injury preventionCritical Risk Management focus– critical controls– field verifications– accountabilities– use of data to focus on weak areas
Iron Ore All Injury Frequency Rate Per 200,000 hours worked
©2016, Rio Tinto, All Rights Reserved
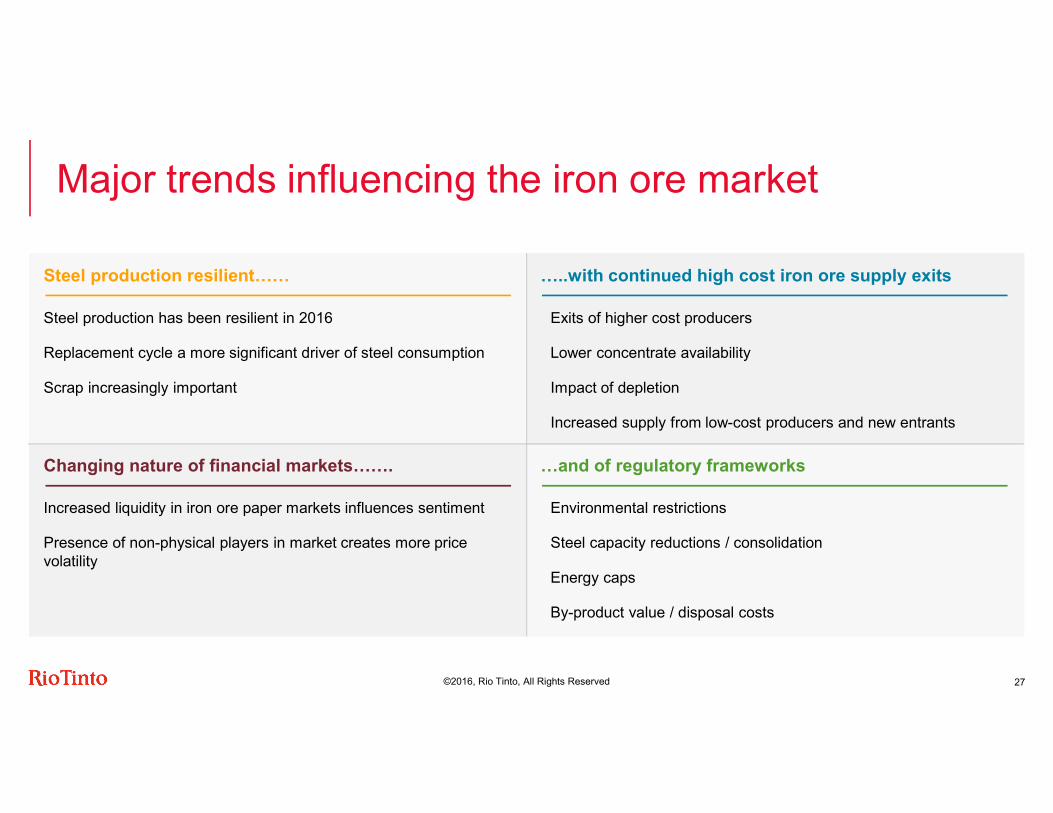
Major trends influencing the iron ore marketSteel production resilient……Steel production has been resilient in 2016Replacement cycle a more significant driver of steel consumptionScrap increasingly important
…..with continued high cost iron ore supply exits
Changing nature of financial markets……. …and of regulatory frameworks
27
Exits of higher cost producersLower concentrate availabilityImpact of depletionIncreased supply from low-cost producers and new entrants
Increased liquidity in iron ore paper markets influences sentimentPresence of non-physical players in market creates more price volatility
Environmental restrictionsSteel capacity reductions / consolidationEnergy capsBy-product value / disposal costs
©2016, Rio Tinto, All Rights Reserved
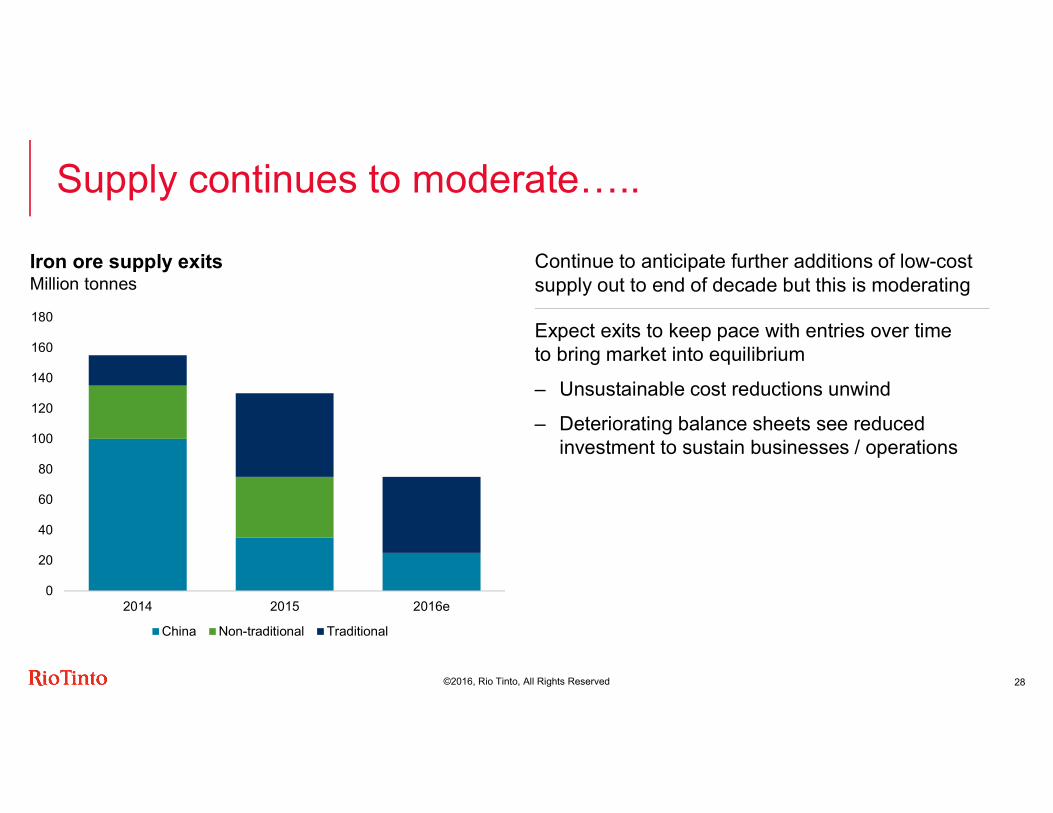
Supply continues to moderate…..
28
Continue to anticipate further additions of low-cost supply out to end of decade but this is moderatingExpect exits to keep pace with entries over time to bring market into equilibrium– Unsustainable cost reductions unwind– Deteriorating balance sheets see reduced
investment to sustain businesses / operations
Iron ore supply exitsMillion tonnes
020406080
100120140160180
2014 2015 2016eChina Non-traditional Traditional
©2016, Rio Tinto, All Rights Reserved
Fines Lump
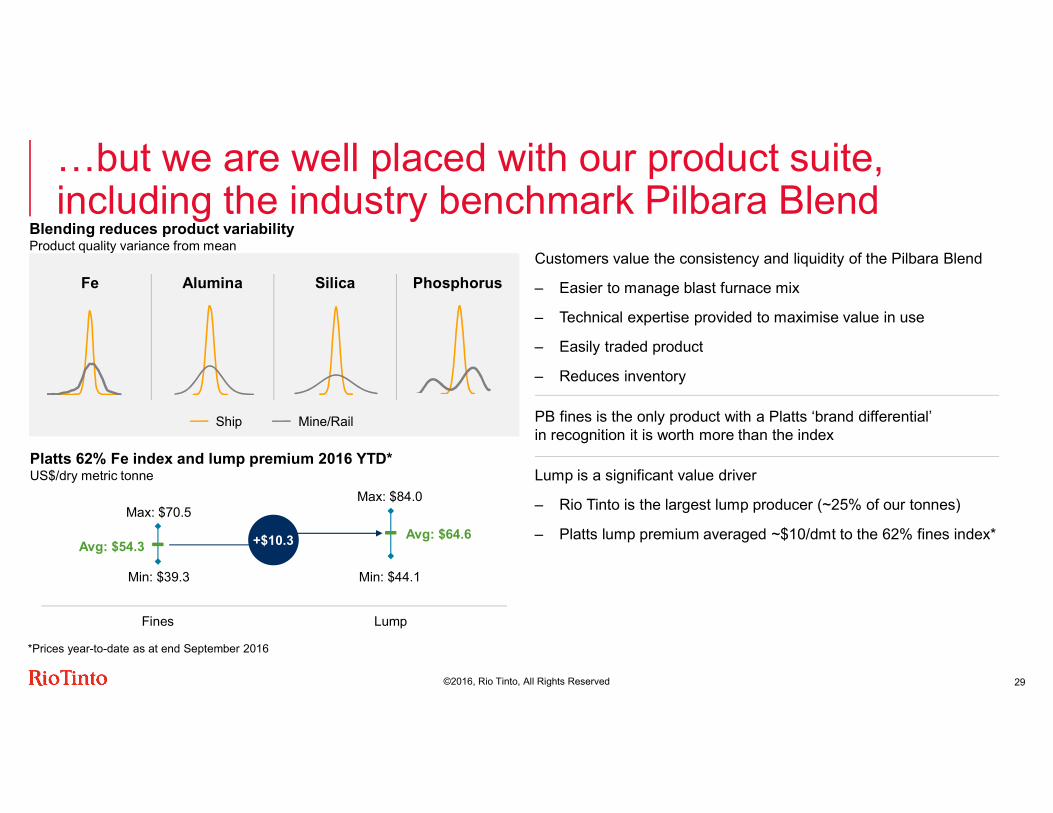
…but we are well placed with our product suite, including the industry benchmark Pilbara Blend
29
Customers value the consistency and liquidity of the Pilbara Blend– Easier to manage blast furnace mix– Technical expertise provided to maximise value in use– Easily traded product– Reduces inventoryPB fines is the only product with a Platts ‘brand differential’ in recognition it is worth more than the indexLump is a significant value driver– Rio Tinto is the largest lump producer (~25% of our tonnes)– Platts lump premium averaged ~$10/dmt to the 62% fines index*
Platts 62% Fe index and lump premium 2016 YTD*US$/dry metric tonne
*Prices year-to-date as at end September 2016
Avg: $54.3Max: $70.5
Min: $39.3
Avg: $64.6Max: $84.0
Min: $44.1+$10.3
Alumina Silica PhosphorusFe
Ship Mine/Rail
Blending reduces product variabilityProduct quality variance from mean
©2016, Rio Tinto, All Rights Reserved
0
75
150
225
300
0
5,000
10,000
15,000
20,000
25,000
2012 2013 2014 2015Inferred Indicated MeasuredProbable Proved Production
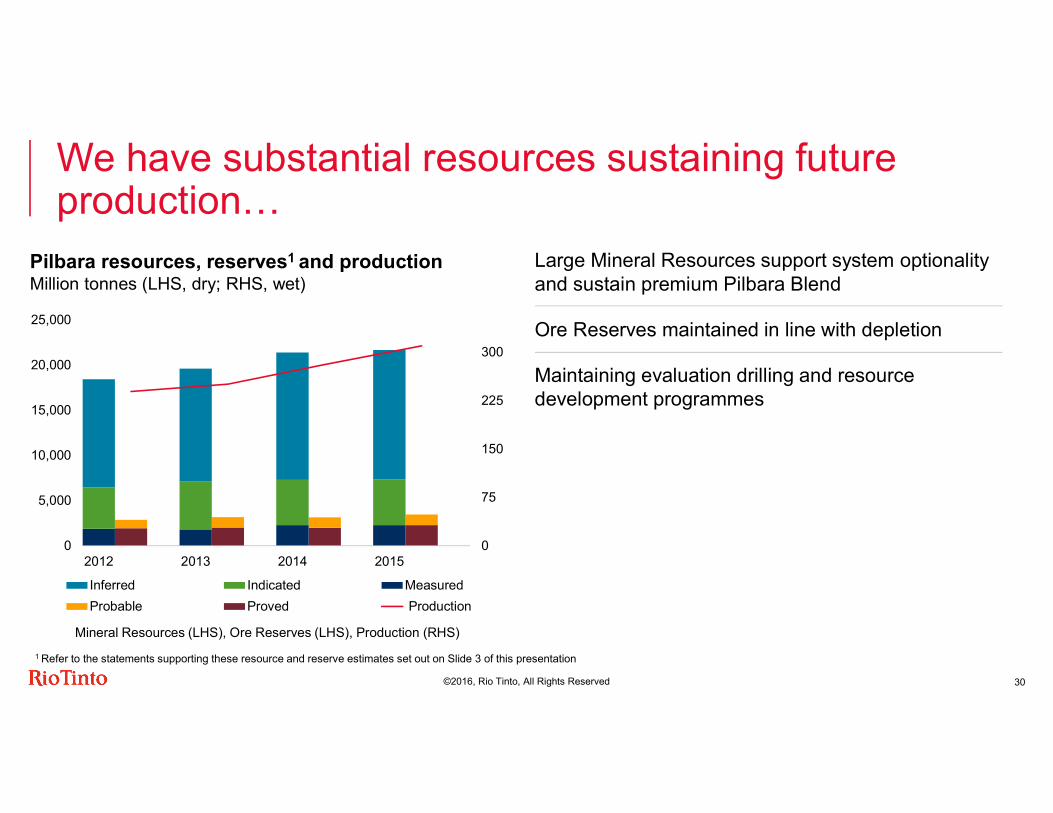
We have substantial resources sustaining future production…
30
Large Mineral Resources support system optionality and sustain premium Pilbara BlendOre Reserves maintained in line with depletionMaintaining evaluation drilling and resource development programmes
Pilbara resources, reserves1 and productionMillion tonnes (LHS, dry; RHS, wet)
1 Refer to the statements supporting these resource and reserve estimates set out on Slide 3 of this presentationMineral Resources (LHS), Ore Reserves (LHS), Production (RHS)
©2016, Rio Tinto, All Rights Reserved
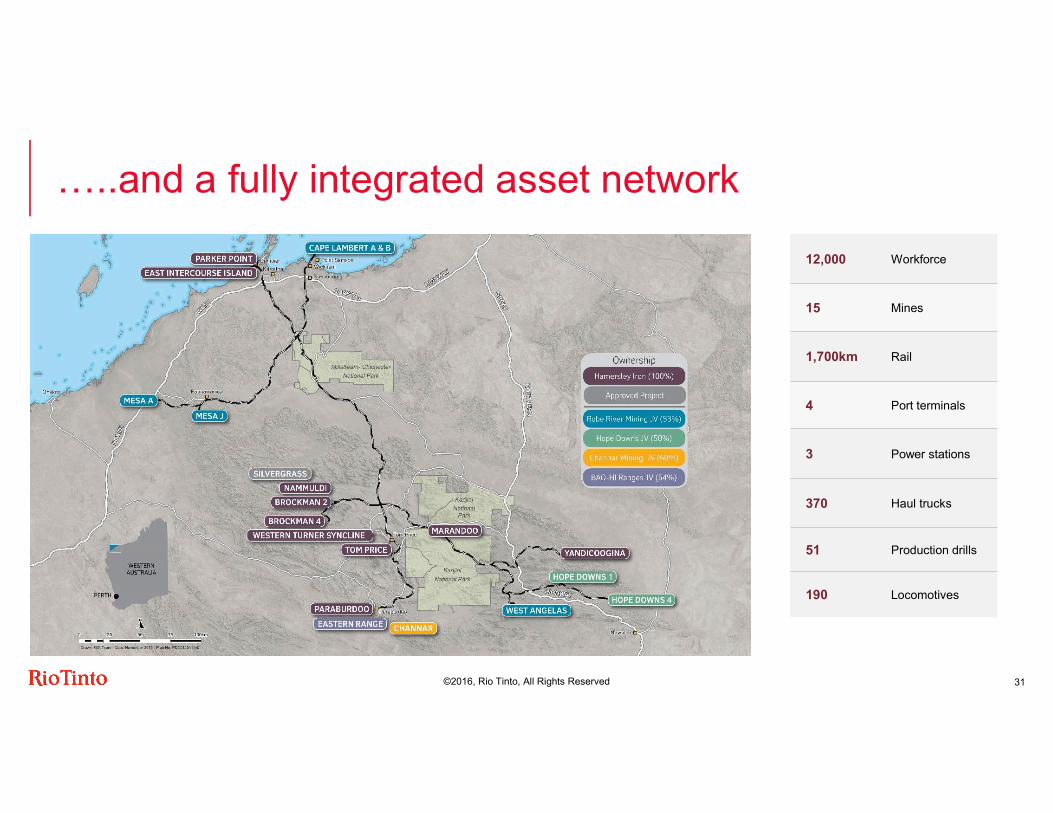
…..and a fully integrated asset network
31
12,000 Workforce
15 Mines
1,700km Rail
4 Port terminals
3 Power stations
370 Haul trucks
51 Production drills
190 Locomotives

©2016, Rio Tinto, All Rights Reserved
Maximising cash flow and sustaining our competitive advantage
32
EBITDA margin RTIO Pilbara vs PeersUS$ per tonne (15/16 FY)
Pre-tax operating cash cost improvements Reduction vs. 2012 US$m
1H 2016 cash unit cost of $14.30/t ~ $1.2 billion in pre-tax cost improvements since 2012Pipeline of >1000 productivity and cost improvement initiatives
05
1015202530
Rio Tinto Peer 1 Peer 2 Peer 3
-25%
323
359
371 138
2013 2014 2015 H1 2016
$1.2bn
©2016, Rio Tinto, All Rights Reserved
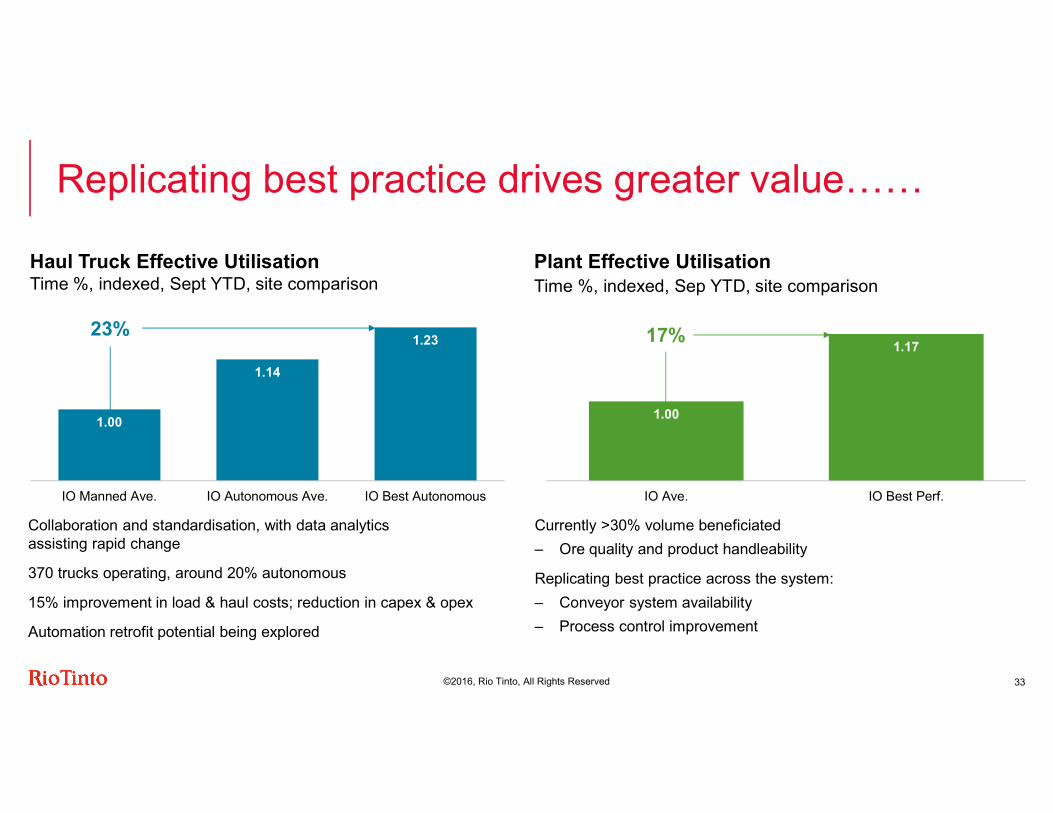
Replicating best practice drives greater value……
33
Haul Truck Effective UtilisationTime %, indexed, Sept YTD, site comparison
Plant Effective UtilisationTime %, indexed, Sep YTD, site comparison
Collaboration and standardisation, with data analytics assisting rapid change370 trucks operating, around 20% autonomous15% improvement in load & haul costs; reduction in capex & opexAutomation retrofit potential being explored
Currently >30% volume beneficiated– Ore quality and product handleabilityReplicating best practice across the system:– Conveyor system availability– Process control improvement
1.00
1.141.23
IO Manned Ave. IO Autonomous Ave. IO Best Autonomous
1.00
1.17
IO Ave. IO Best Perf.
23% 17%
©2016, Rio Tinto, All Rights Reserved
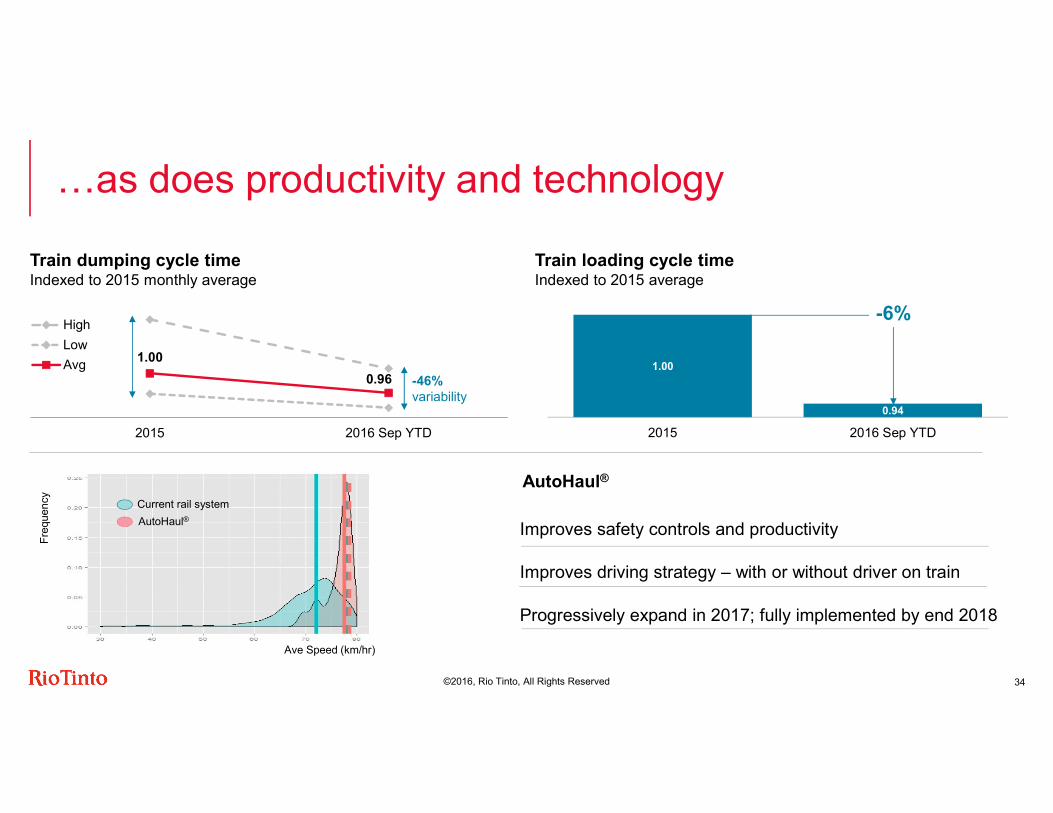
…as does productivity and technology
34
AutoHaul®
1.000.96
2015 2016 Sep YTD
HighLowAvg 1.00
0.942015 2016 Sep YTD
Freque
ncy
Ave Speed (km/hr)
Current rail systemAutoHaul®
Train dumping cycle timeIndexed to 2015 monthly average
Train loading cycle timeIndexed to 2015 average
-6%
-46%variability
Improves safety controls and productivityImproves driving strategy – with or without driver on trainProgressively expand in 2017; fully implemented by end 2018
©2016, Rio Tinto, All Rights Reserved
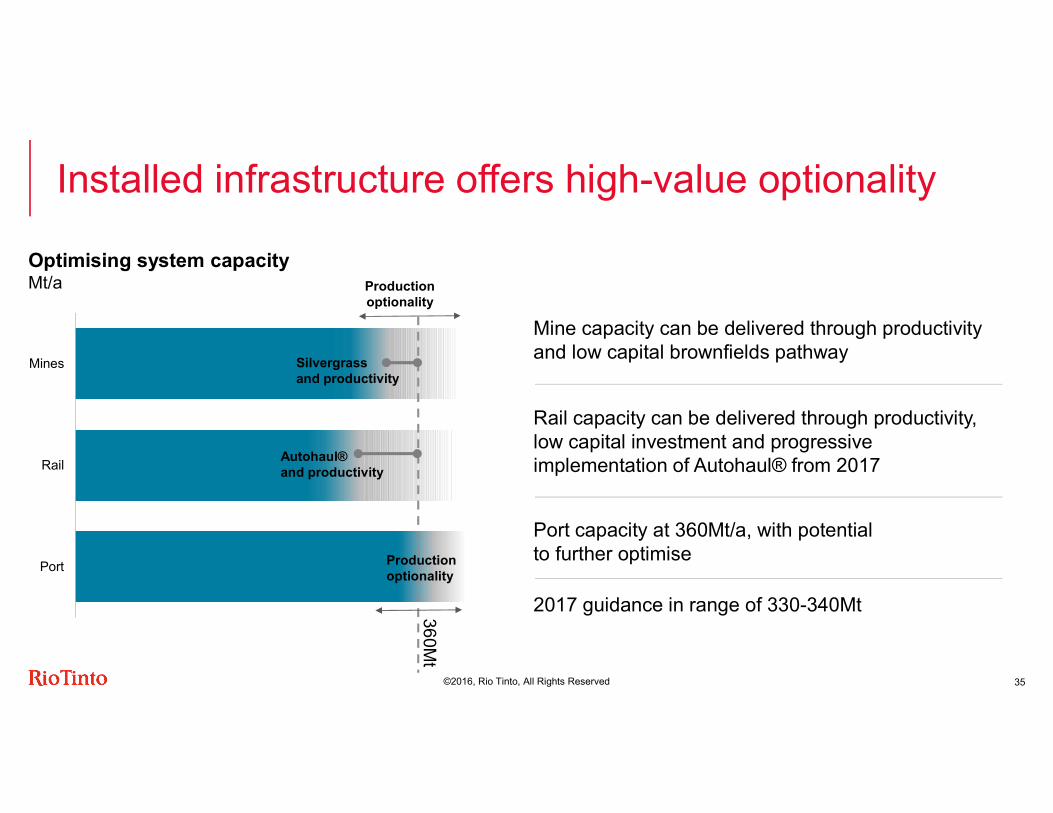
Installed infrastructure offers high-value optionality
35
Port
Rail
Mines Silvergrass and productivity
Autohaul® and productivity
Productionoptionality
Optimising system capacityMt/a
360Mt
Mine capacity can be delivered through productivity and low capital brownfields pathway
Rail capacity can be delivered through productivity, low capital investment and progressive implementation of Autohaul® from 2017
Port capacity at 360Mt/a, with potential to further optimise2017 guidance in range of 330-340Mt
Productionoptionality
©2016, Rio Tinto, All Rights Reserved
Sustaining best value production
36
Hope Downs 4
Marandoo Phase II
Nammuldi Below Water
Table
Nammuldi Incremental
Brownfields Mine
Expansions
Yandi Sustaining West Angelas
Deposit B Silvergrass
-30
-
30
60
90
120
20122012 2016
Bubble size indicates capacity
Nammuldi Incremental and Silvergrass in development (~20 Mt/a capacity)
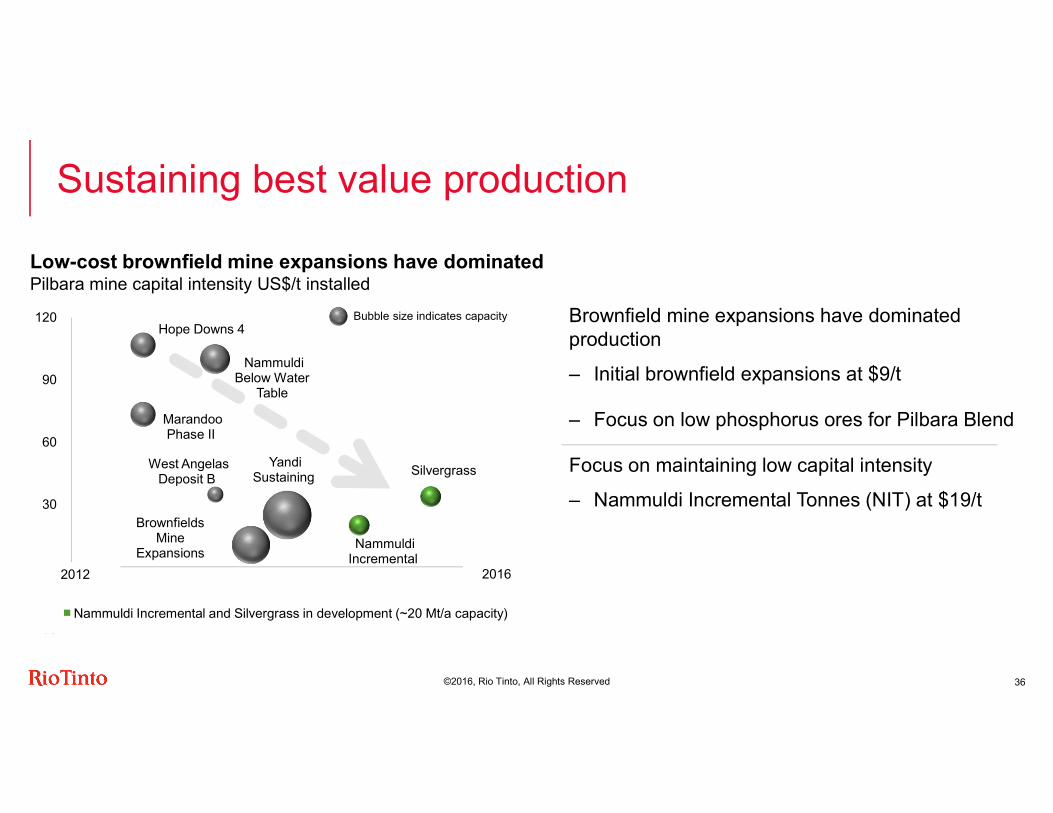
Low-cost brownfield mine expansions have dominated Pilbara mine capital intensity US$/t installed
Brownfield mine expansions have dominated production– Initial brownfield expansions at $9/t– Focus on low phosphorus ores for Pilbara BlendFocus on maintaining low capital intensity – Nammuldi Incremental Tonnes (NIT) at $19/t
©2016, Rio Tinto, All Rights Reserved
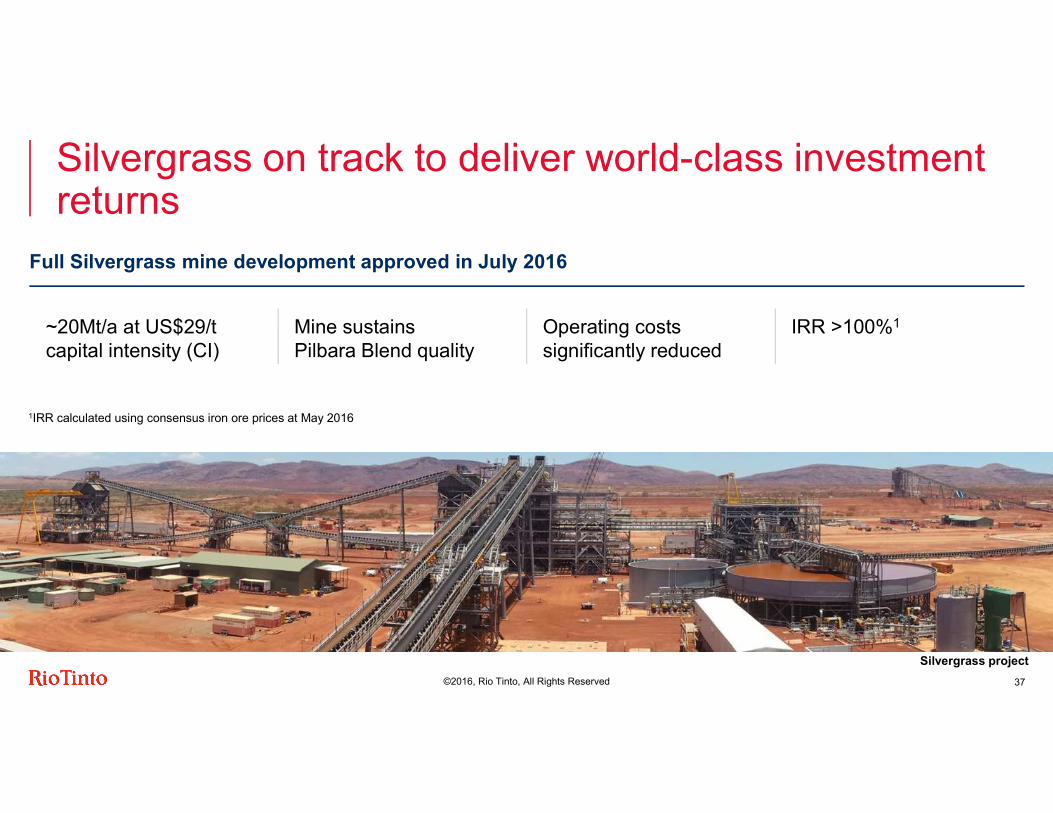
Silvergrass on track to deliver world-class investment returnsFull Silvergrass mine development approved in July 2016
37Silvergrass project
1IRR calculated using consensus iron ore prices at May 2016
Mine sustains Pilbara Blend quality
Operating costs significantly reduced
IRR >100%1~20Mt/a at US$29/t capital intensity (CI)

©2016, Rio Tinto, All Rights Reserved
High-quality, low-cost options available to offset depletion
38
Yandi Oxbow
West Angelas Deposit F
Koodaiderioption
-30
-
30
60
90
120
2012 2016
Bubble size indicates capacity
Greenfield replacement mineNew brownfield replacement mine
Approved replacement mines
Pilbara mine development optionsUS$/t Installed capital intensity
Multiple options leveraging existing infrastructure– West Angelas Deposit F and Yandi Oxbow Capital
Intensity <$10/t; IRR >100%1
Brownfield replacement mines to sustain current production range (Capital Intensity $5-$20/t)Koodaideri option underpins Pilbara Blend, low-cost operations. Present view:– Phase 1 ~40Mt/a plant capacity at $55/t Capital
Intensity ($2.2bn) – Potential capital spend from 2019– Potential for first ore available around 2021
1 IRR calculated using consensus iron ore prices at May 2016
©2016, Rio Tinto, All Rights Reserved
Sustaining best value production
39
0.0
0.5
1.0
1.5
2016F 2017F 2018F 2019FGrowth (mainly Silvergrass in 2017) Unapproved replacement mine capitalApproved replacement mine capital Sustaining capital
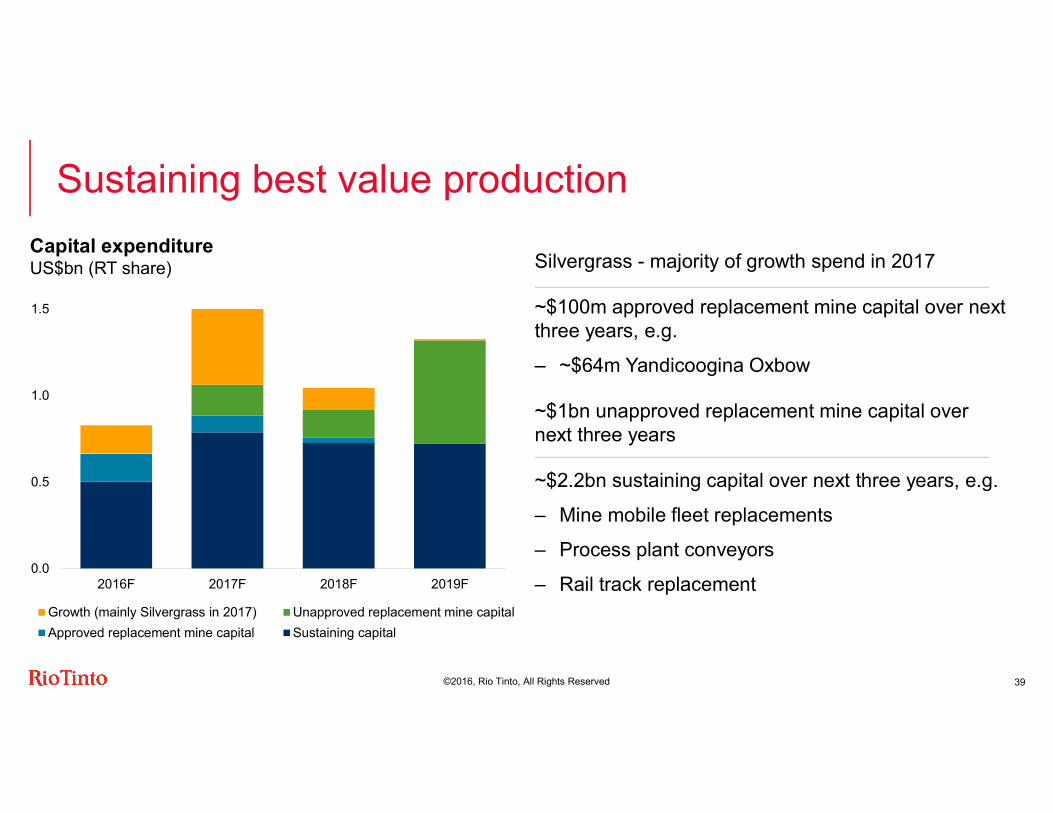
Capital expenditureUS$bn (RT share) Silvergrass - majority of growth spend in 2017
~$100m approved replacement mine capital over next three years, e.g.– ~$64m Yandicoogina Oxbow~$1bn unapproved replacement mine capital over next three years ~$2.2bn sustaining capital over next three years, e.g.– Mine mobile fleet replacements– Process plant conveyors– Rail track replacement
©2016, Rio Tinto, All Rights Reserved
A workforce of fully-engaged employees
40
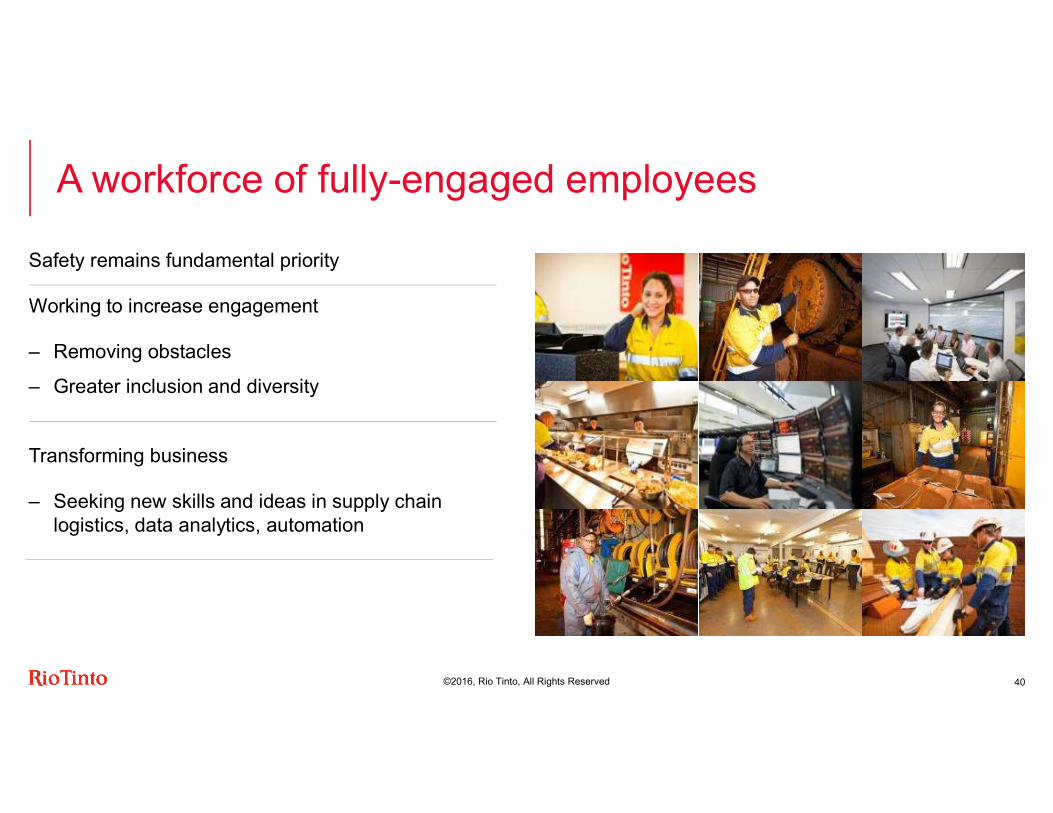
Safety remains fundamental priorityWorking to increase engagement– Removing obstacles– Greater inclusion and diversity
Transforming business– Seeking new skills and ideas in supply chain
logistics, data analytics, automation
©2016, Rio Tinto, All Rights Reserved
Highly-valued partners and sustainable local and regional investment remain a priority
41
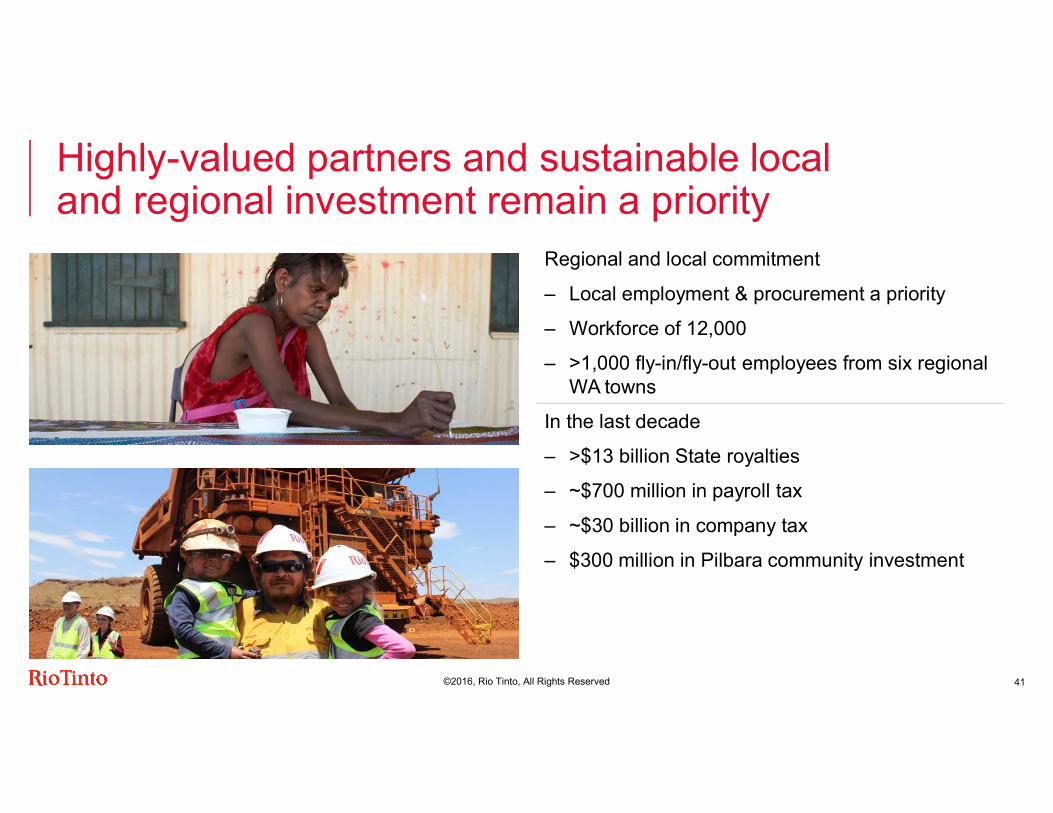
Regional and local commitment– Local employment & procurement a priority– Workforce of 12,000– >1,000 fly-in/fly-out employees from six regional
WA townsIn the last decade– >$13 billion State royalties – ~$700 million in payroll tax– ~$30 billion in company tax– $300 million in Pilbara community investment
©2016, Rio Tinto, All Rights Reserved
Delivering optimal value from one of the world’s best businesses
42
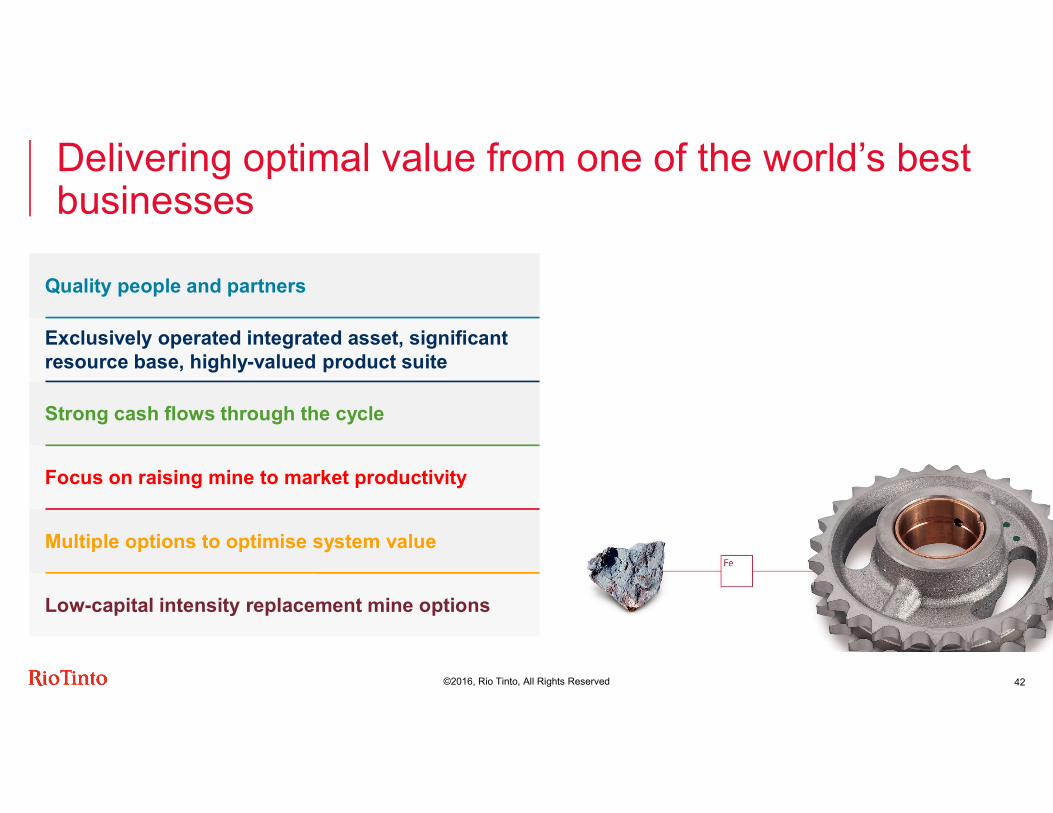
Quality people and partnersExclusively operated integrated asset, significant resource base, highly-valued product suiteStrong cash flows through the cycle
Focus on raising mine to market productivity
Multiple options to optimise system value
Low-capital intensity replacement mine options
Break6 December 2016
Arnaud Soirat
CopperChief executive, Copper & Diamonds

©2016, Rio Tinto, All Rights Reserved
Safety is our first priorityContinual improvement in safetyAIFR per 200,000 hours worked
Continuous improvements in All Injury Frequency Rate Focus on fatality and catastrophic event prevention – Embedding Critical Risk Management – Process and Underground safetyBalanced safety approach with high employee engagement across the groupSharing best practice and lessons with our joint-venture partners
45
Copper
0
0.20.40.6
0.81
1.21.4
1.6
2006 2007 2008 2009 2010 2011 2012 2013 2014 2015 YTD2016Fatalities at managed operations
©2016, Rio Tinto, All Rights Reserved
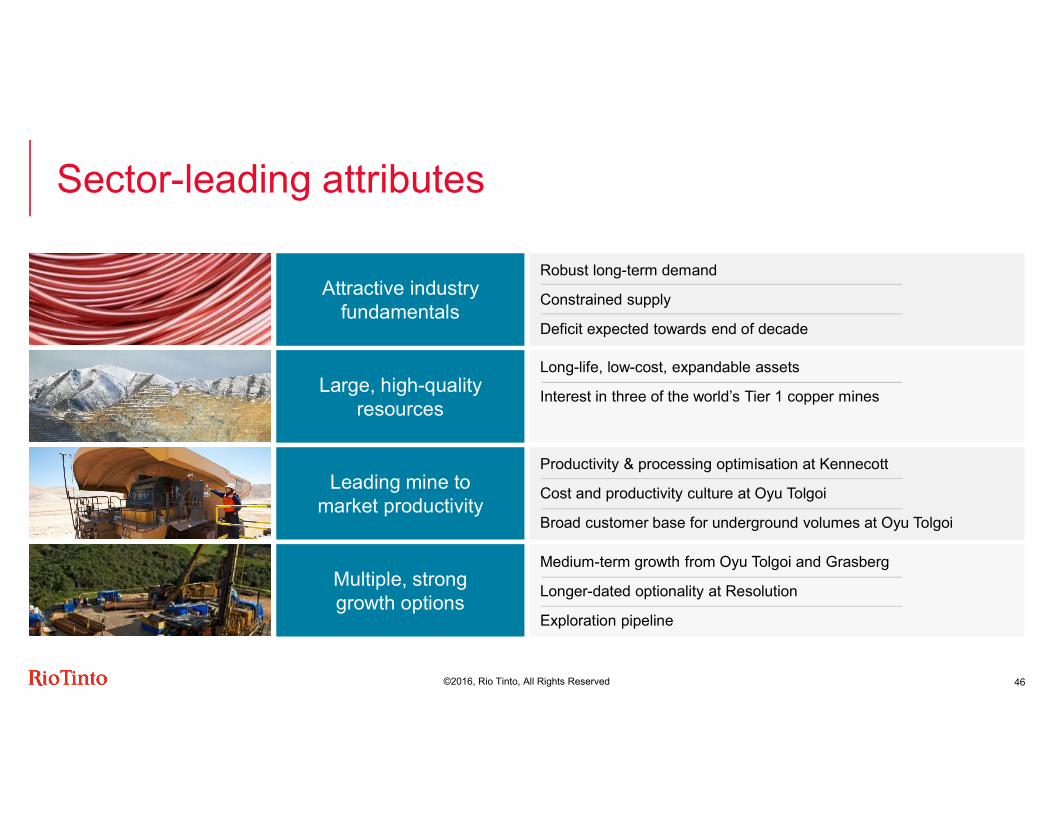
Sector-leading attributes
46
Robust long-term demandConstrained supplyDeficit expected towards end of decadeLong-life, low-cost, expandable assetsInterest in three of the world’s Tier 1 copper mines
Productivity & processing optimisation at KennecottCost and productivity culture at Oyu TolgoiBroad customer base for underground volumes at Oyu TolgoiMedium-term growth from Oyu Tolgoi and Grasberg Longer-dated optionality at ResolutionExploration pipeline
Attractive industryfundamentals
Multiple, stronggrowth options
Leading mine to market productivity
Large, high-quality resources
©2016, Rio Tinto, All Rights Reserved
10
15
20
25
2015 2017 2019 2021 2023 2025 2027 2029Base Highly Probable Demand
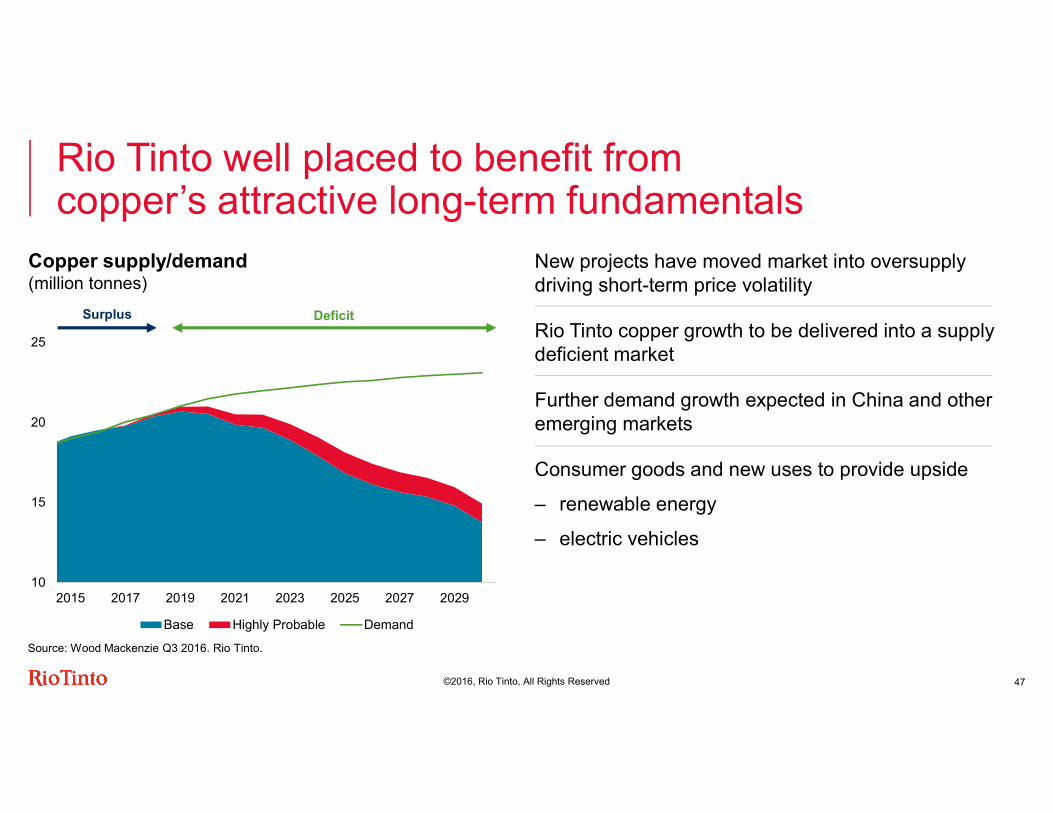
Rio Tinto well placed to benefit from copper’s attractive long-term fundamentals
47
Copper supply/demand (million tonnes)
New projects have moved market into oversupply driving short-term price volatilityRio Tinto copper growth to be delivered into a supply deficient marketFurther demand growth expected in China and other emerging marketsConsumer goods and new uses to provide upside– renewable energy– electric vehicles
Source: Wood Mackenzie Q3 2016. Rio Tinto.
DeficitSurplus

©2016, Rio Tinto, All Rights Reserved
Develop our people & partnershipsDeliver medium-term growth and progress long-term options
Strategy to deliver further value
48
Maximise value from existing operations
Unlock additional value through productivity initiatives
©2016, Rio Tinto, All Rights Reserved
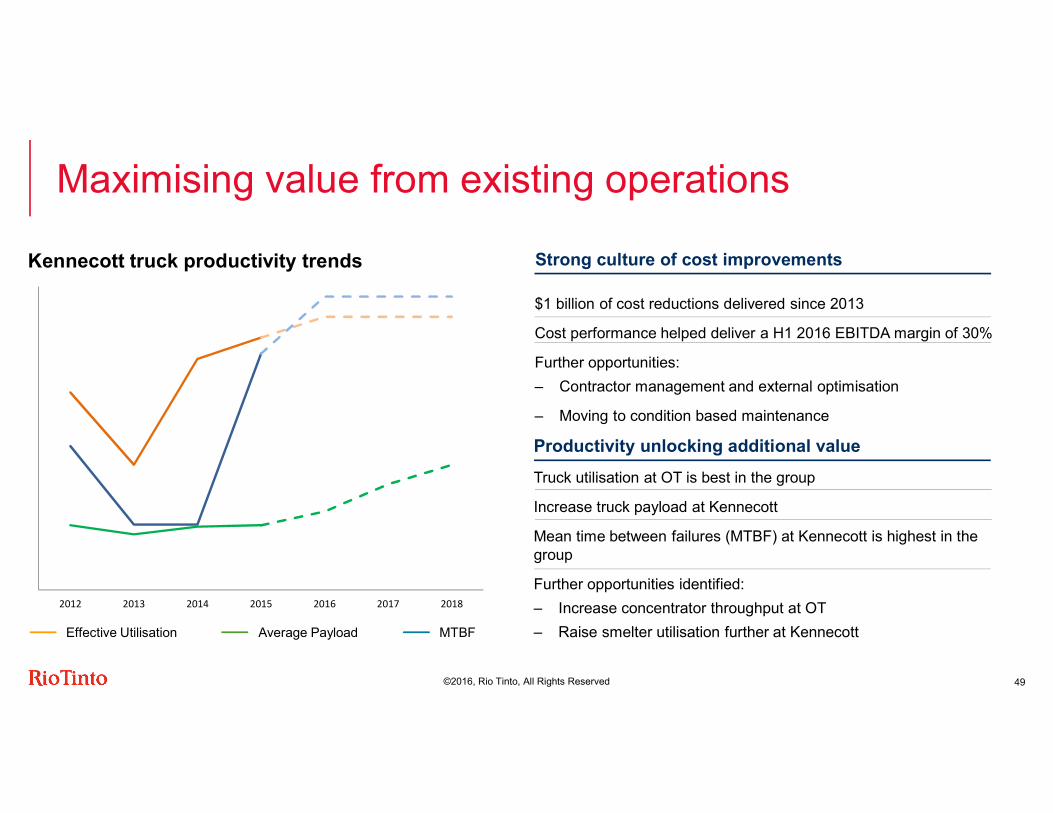
Maximising value from existing operations
49
Kennecott truck productivity trends
Effective Utilisation Average Payload MTBF
$1 billion of cost reductions delivered since 2013 Cost performance helped deliver a H1 2016 EBITDA margin of 30%Further opportunities:– Contractor management and external optimisation – Moving to condition based maintenance
Strong culture of cost improvements
Truck utilisation at OT is best in the groupIncrease truck payload at KennecottMean time between failures (MTBF) at Kennecott is highest in the groupFurther opportunities identified:– Increase concentrator throughput at OT– Raise smelter utilisation further at Kennecott
Productivity unlocking additional value
2012 2013 2014 2015 2016 2017 2018
©2016, Rio Tinto, All Rights Reserved
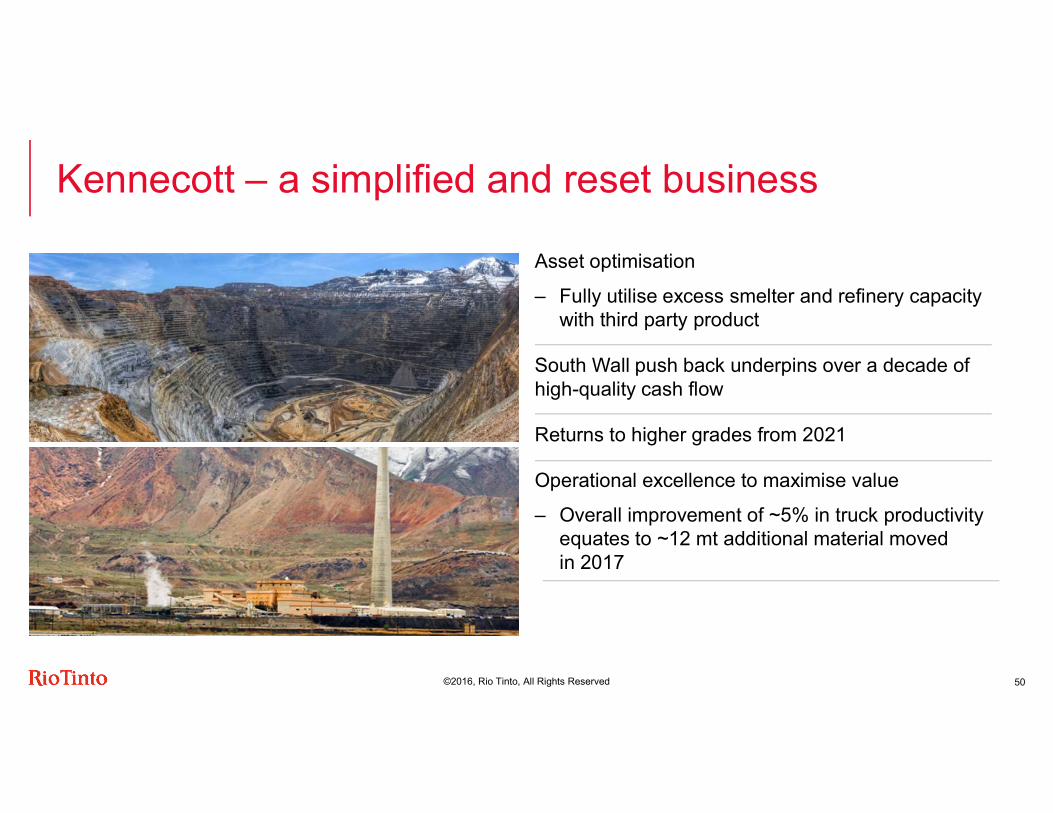
Kennecott – a simplified and reset business
50
Asset optimisation– Fully utilise excess smelter and refinery capacity
with third party productSouth Wall push back underpins over a decade of high-quality cash flowReturns to higher grades from 2021Operational excellence to maximise value– Overall improvement of ~5% in truck productivity
equates to ~12 mt additional material moved in 2017
©2016, Rio Tinto, All Rights Reserved
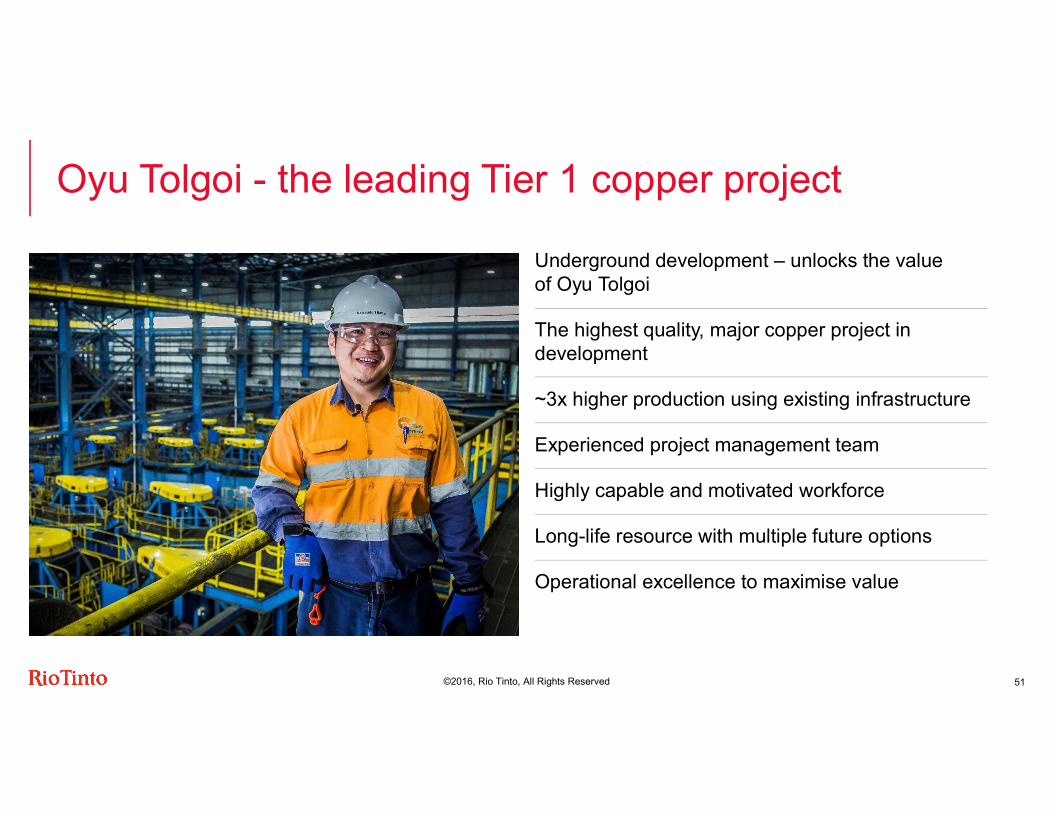
Oyu Tolgoi - the leading Tier 1 copper project
51
Underground development – unlocks the value of Oyu TolgoiThe highest quality, major copper project in development~3x higher production using existing infrastructureExperienced project management teamHighly capable and motivated workforceLong-life resource with multiple future optionsOperational excellence to maximise value
©2016, Rio Tinto, All Rights Reserved
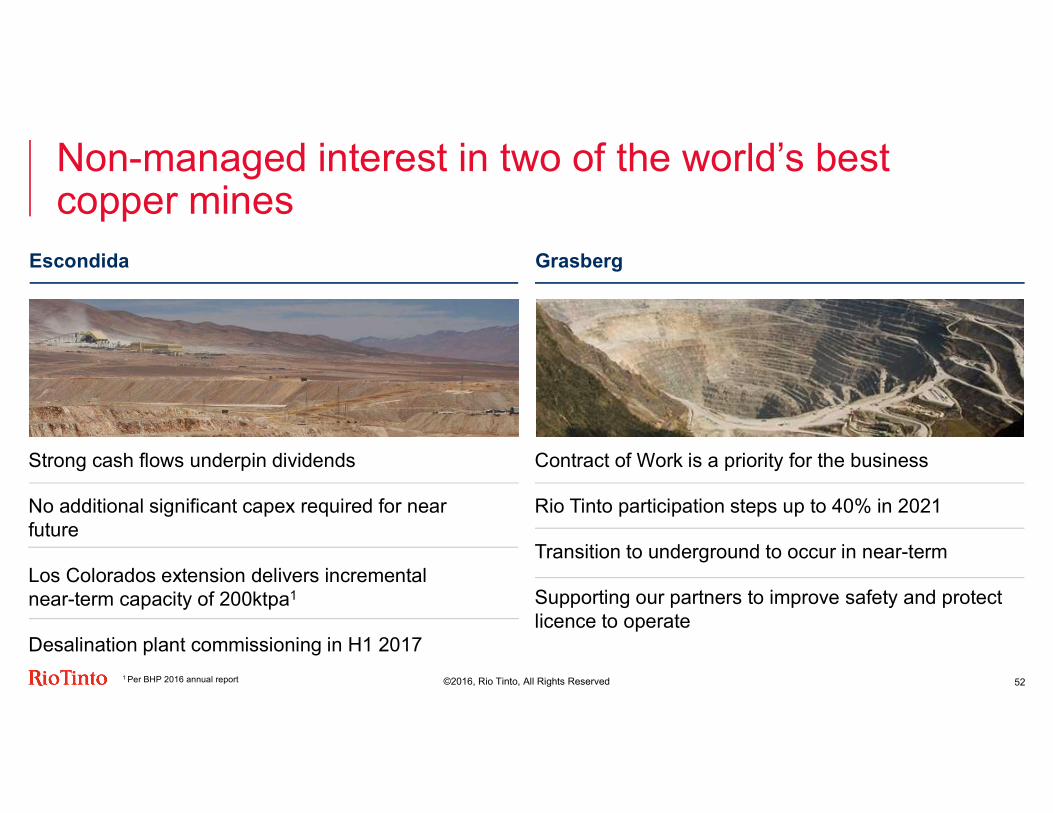
Non-managed interest in two of the world’s best copper mines
52
GrasbergEscondida
Contract of Work is a priority for the businessRio Tinto participation steps up to 40% in 2021Transition to underground to occur in near-termSupporting our partners to improve safety and protect licence to operate
Strong cash flows underpin dividendsNo additional significant capex required for near futureLos Colorados extension delivers incremental near-term capacity of 200ktpa1
Desalination plant commissioning in H1 20171 Per BHP 2016 annual report
©2016, Rio Tinto, All Rights Reserved
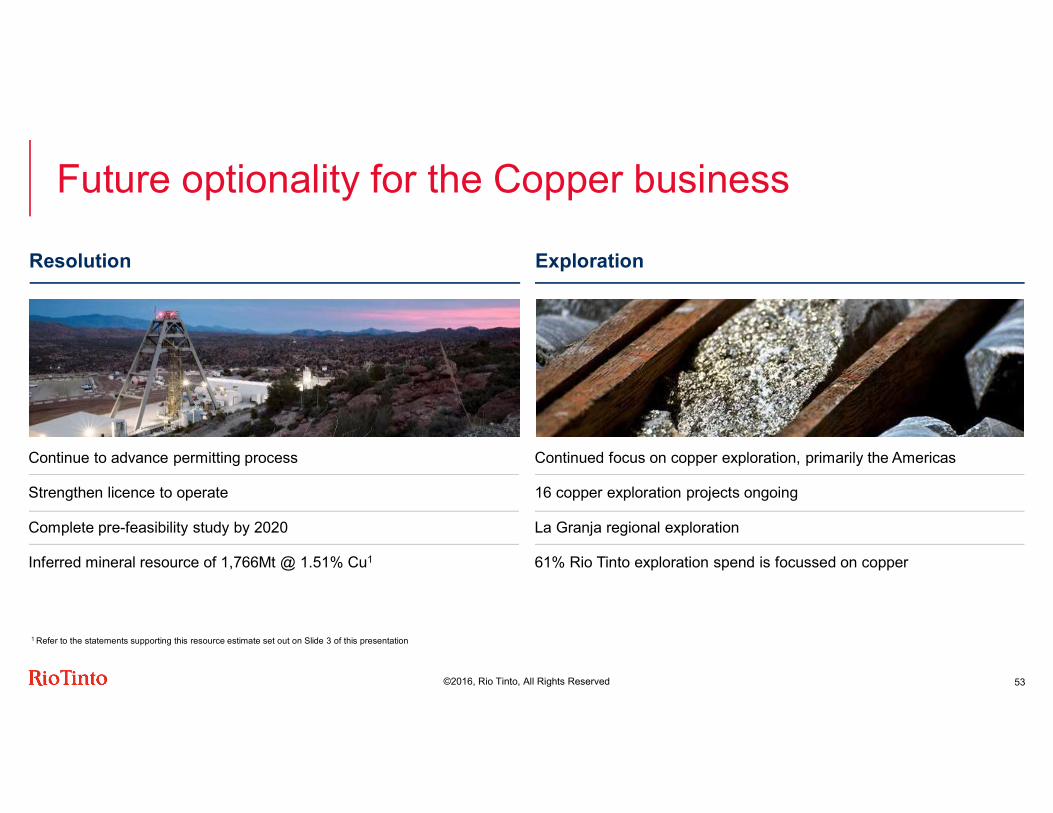
Future optionality for the Copper business
53
ExplorationResolution
Continued focus on copper exploration, primarily the Americas16 copper exploration projects ongoingLa Granja regional exploration 61% Rio Tinto exploration spend is focussed on copper
Continue to advance permitting processStrengthen licence to operateComplete pre-feasibility study by 2020Inferred mineral resource of 1,766Mt @ 1.51% Cu1
1 Refer to the statements supporting this resource estimate set out on Slide 3 of this presentation
©2016, Rio Tinto, All Rights Reserved
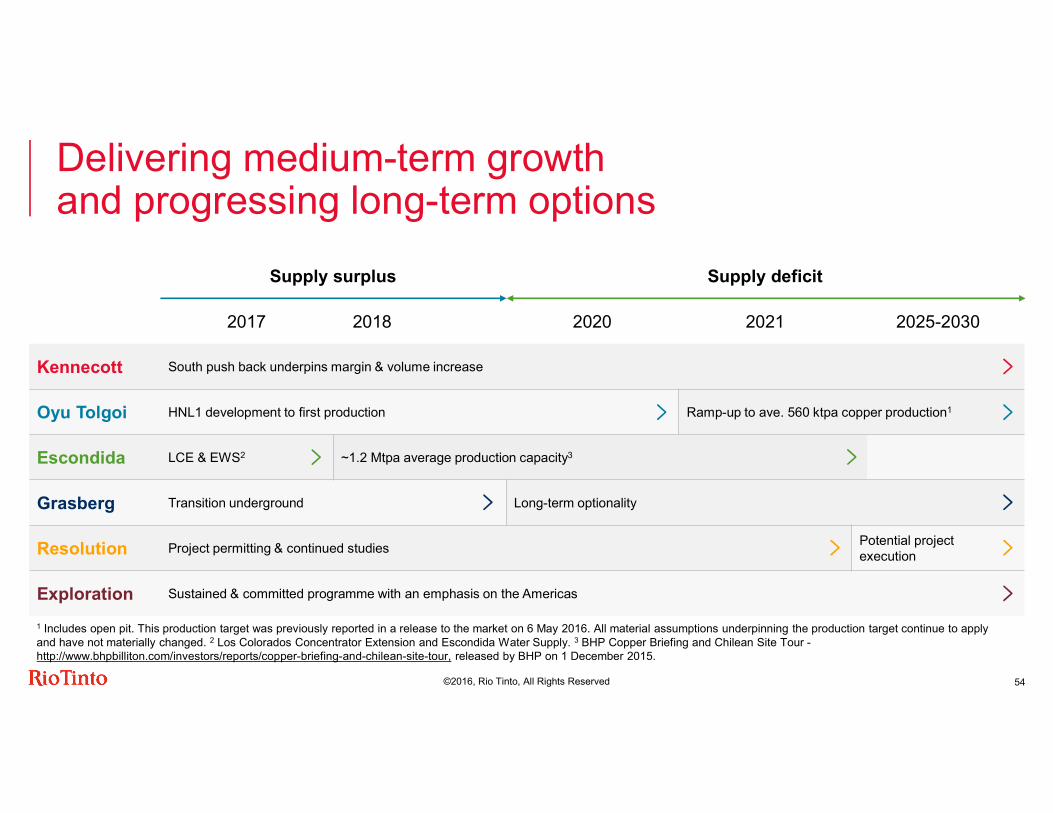
Delivering medium-term growth and progressing long-term options
54
1 Includes open pit. This production target was previously reported in a release to the market on 6 May 2016. All material assumptions underpinning the production target continue to apply and have not materially changed. 2 Los Colorados Concentrator Extension and Escondida Water Supply. 3 BHP Copper Briefing and Chilean Site Tour -http://www.bhpbilliton.com/investors/reports/copper-briefing-and-chilean-site-tour, released by BHP on 1 December 2015.
Supply surplus Supply deficit2017 2020 2021 2025-2030
Kennecott South push back underpins margin & volume increase
Oyu Tolgoi HNL1 development to first production Ramp-up to ave. 560 ktpa copper production1
Escondida LCE & EWS2 ~1.2 Mtpa average production capacity3
Grasberg Transition underground Long-term optionality
Resolution Project permitting & continued studies Potential project execution
Exploration Sustained & committed programme with an emphasis on the Americas
2018
©2016, Rio Tinto, All Rights Reserved
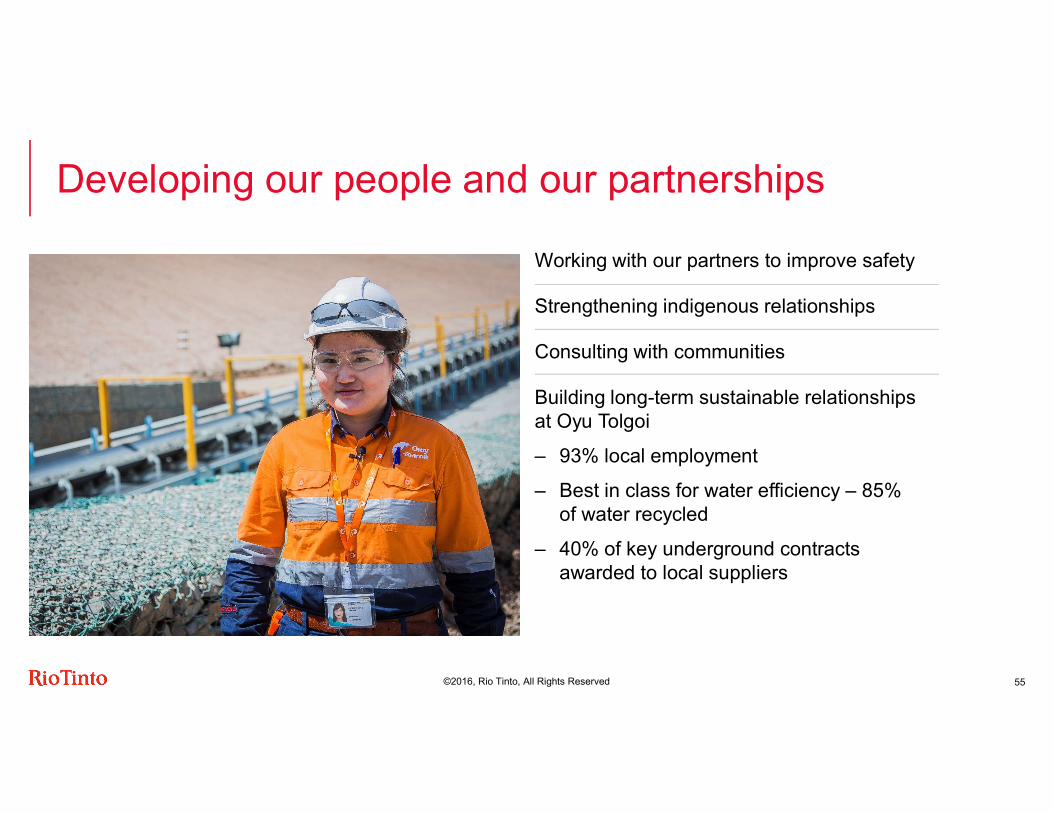
Developing our people and our partnerships
55
Working with our partners to improve safety Strengthening indigenous relationships Consulting with communitiesBuilding long-term sustainable relationships at Oyu Tolgoi– 93% local employment– Best in class for water efficiency – 85%
of water recycled– 40% of key underground contracts
awarded to local suppliers
©2016, Rio Tinto, All Rights Reserved
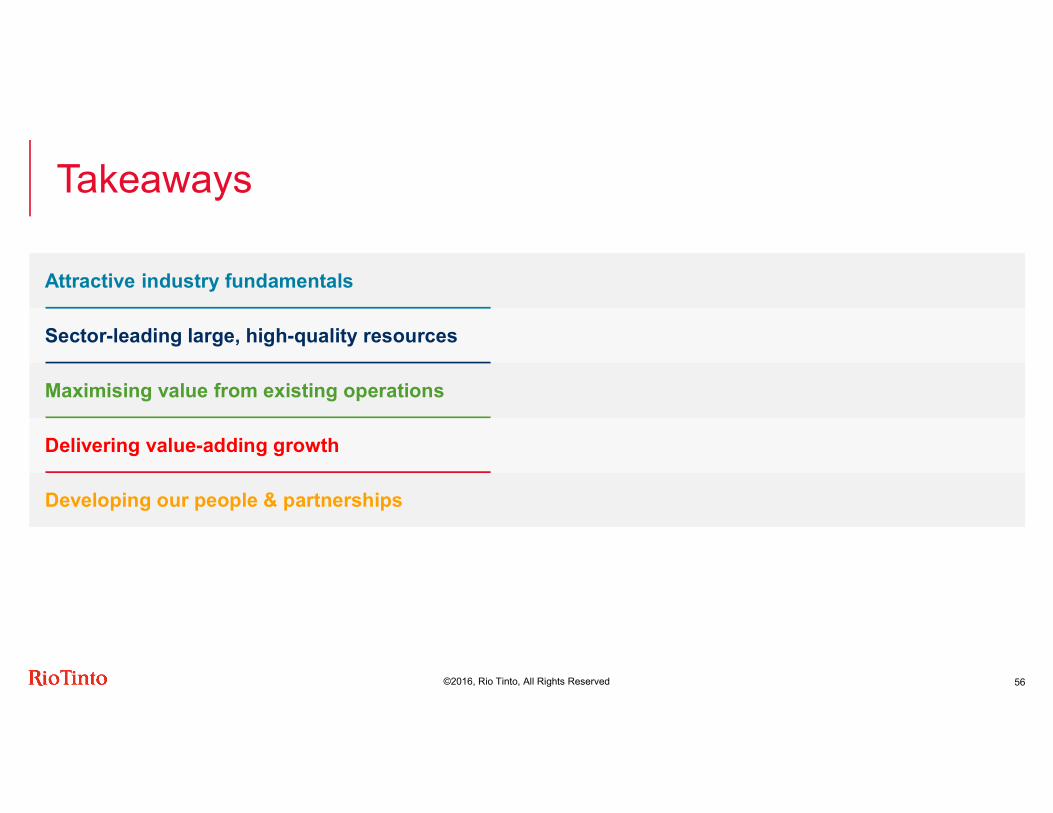
Attractive industry fundamentalsSector-leading large, high-quality resourcesMaximising value from existing operationsDelivering value-adding growthDeveloping our people & partnerships
Takeaways
56
Steve McIntosh
Growth & InnovationGroup executive, Growth & Innovation
©2016, Rio Tinto, All Rights Reserved
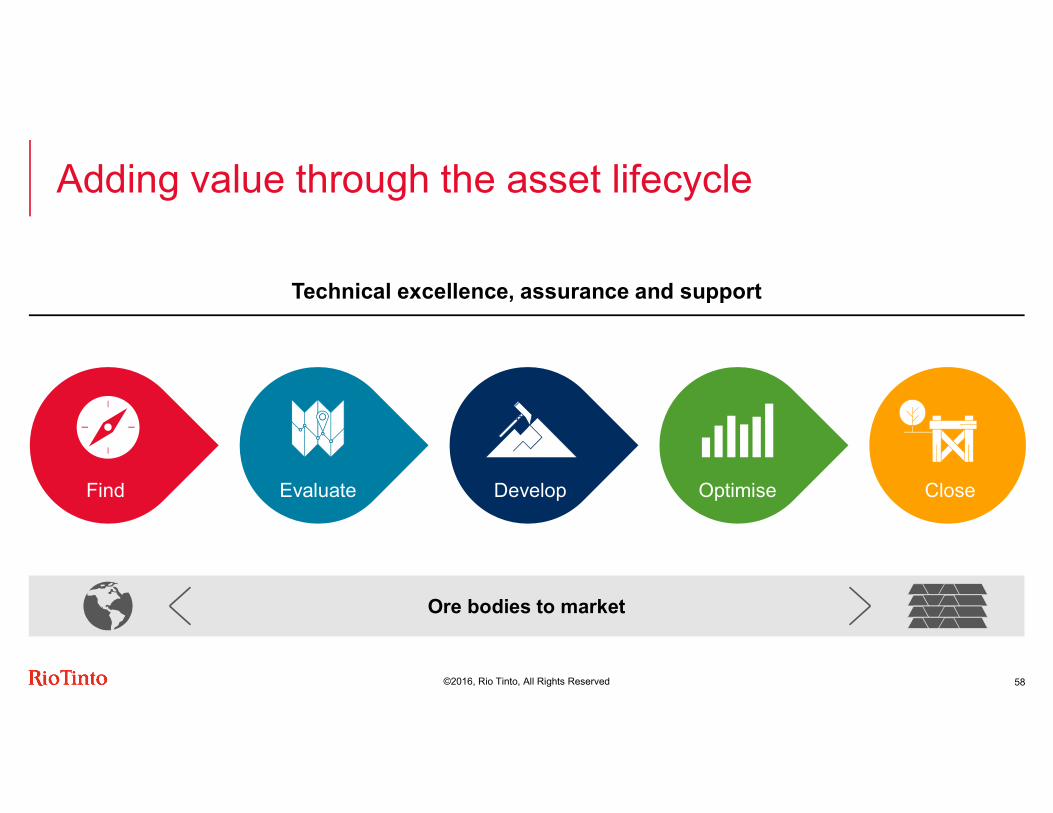
Ore bodies to market
Adding value through the asset lifecycle Technical excellence, assurance and support
58
Find Evaluate Develop Optimise Close
©2016, Rio Tinto, All Rights Reserved
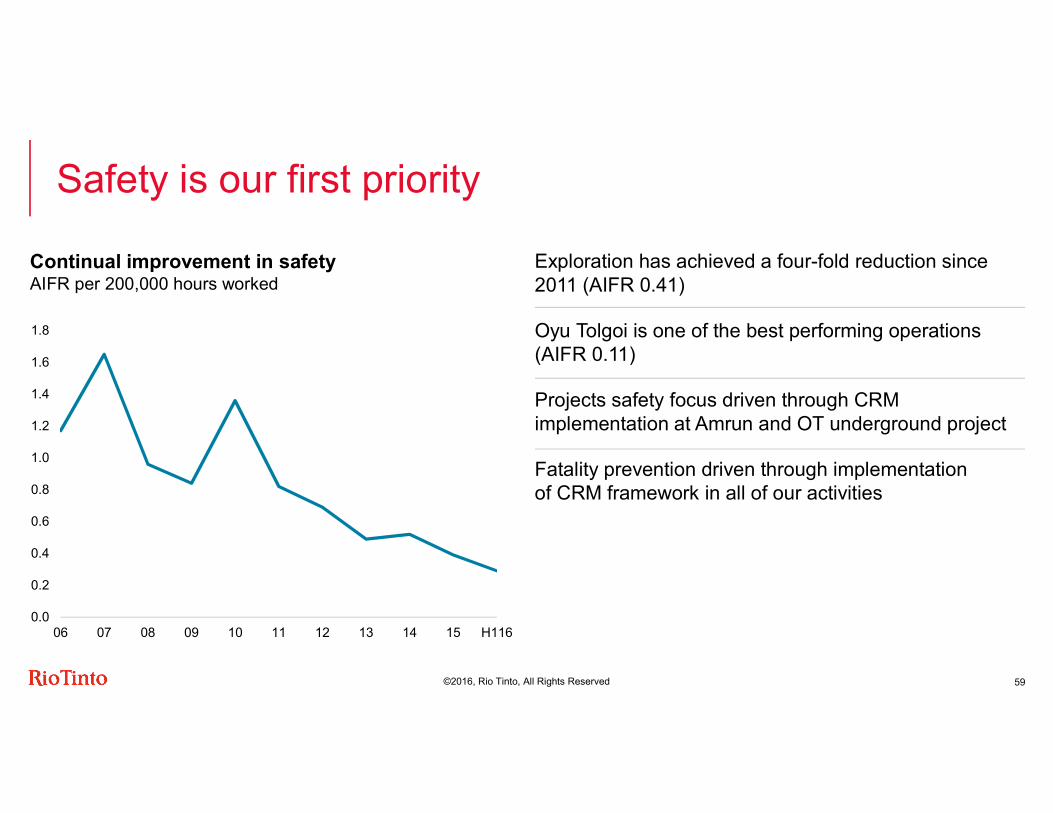
Safety is our first priority
0.00.20.40.60.81.01.21.41.61.8
06 07 08 09 10 11 12 13 14 15 H116
Continual improvement in safetyAIFR per 200,000 hours worked
Exploration has achieved a four-fold reduction since 2011 (AIFR 0.41)Oyu Tolgoi is one of the best performing operations (AIFR 0.11)Projects safety focus driven through CRM implementation at Amrun and OT underground projectFatality prevention driven through implementation of CRM framework in all of our activities
59
©2016, Rio Tinto, All Rights Reserved
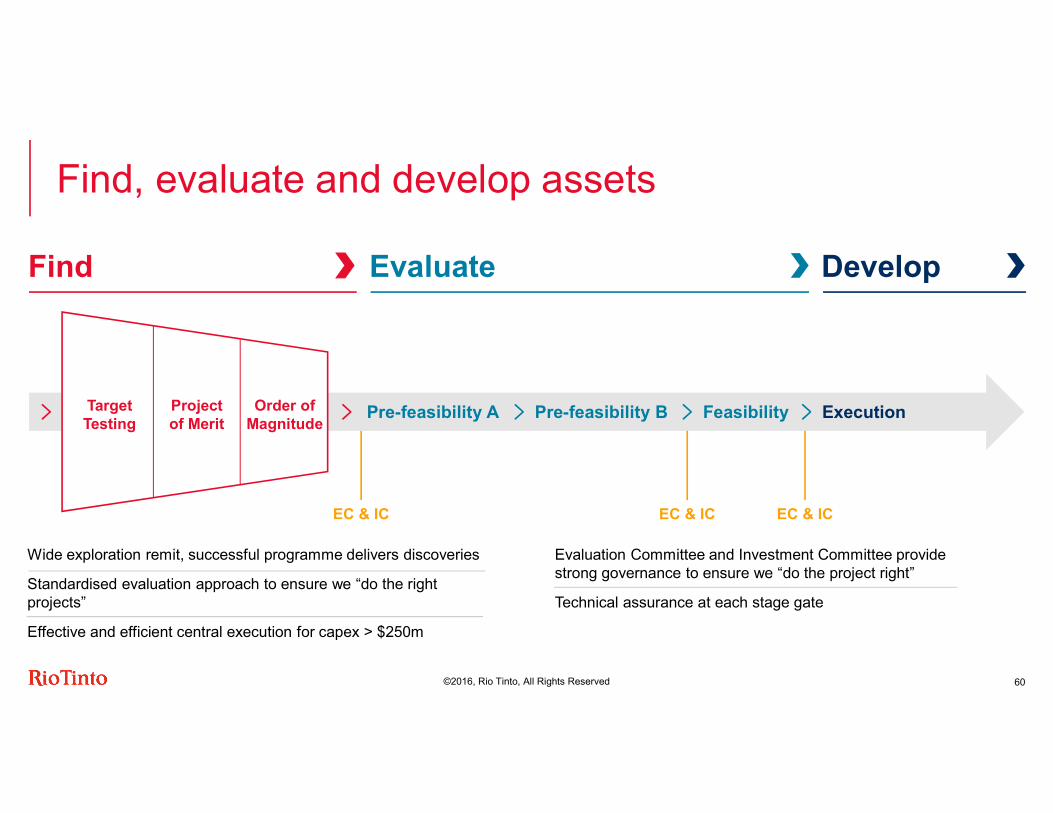
EC & IC EC & ICEC & IC
Find, evaluate and develop assetsFind Evaluate Develop
Wide exploration remit, successful programme delivers discoveriesStandardised evaluation approach to ensure we “do the right projects”Effective and efficient central execution for capex > $250m
Evaluation Committee and Investment Committee provide strong governance to ensure we “do the project right”Technical assurance at each stage gate
Pre-feasibility A Pre-feasibility B Feasibility ExecutionProject of Merit
Order ofMagnitude
TargetTesting
60
©2016, Rio Tinto, All Rights Reserved
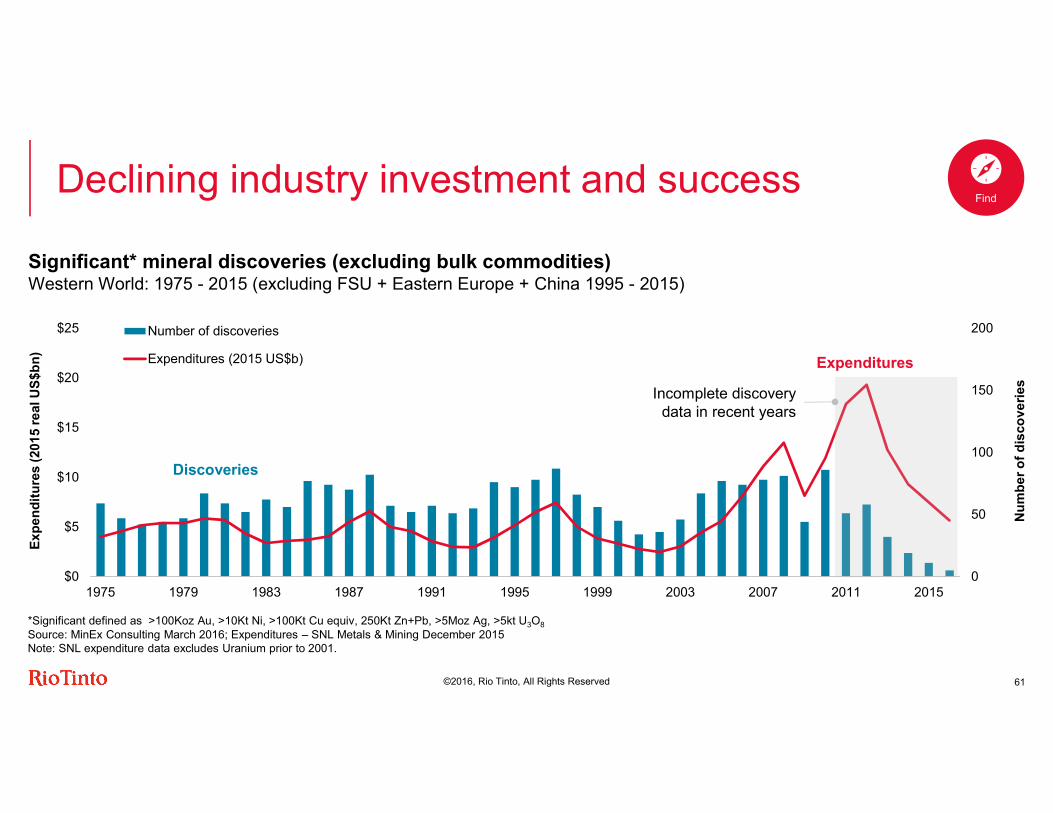
Declining industry investment and success
0
50
100
150
200
$0
$5
$10
$15
$20
$25
1975 1979 1983 1987 1991 1995 1999 2003 2007 2011 2015
Number of discoveriesExpenditures (2015 US$b)
Expe
nditu
res (20
15 rea
l US$
bn)
Numb
er of
disco
veries
Discoveries
ExpendituresIncomplete discovery
data in recent years
Significant* mineral discoveries (excluding bulk commodities)Western World: 1975 - 2015 (excluding FSU + Eastern Europe + China 1995 - 2015)
*Significant defined as >100Koz Au, >10Kt Ni, >100Kt Cu equiv, 250Kt Zn+Pb, >5Moz Ag, >5kt U3O8Source: MinEx Consulting March 2016; Expenditures – SNL Metals & Mining December 2015Note: SNL expenditure data excludes Uranium prior to 2001.
Find
61
©2016, Rio Tinto, All Rights Reserved
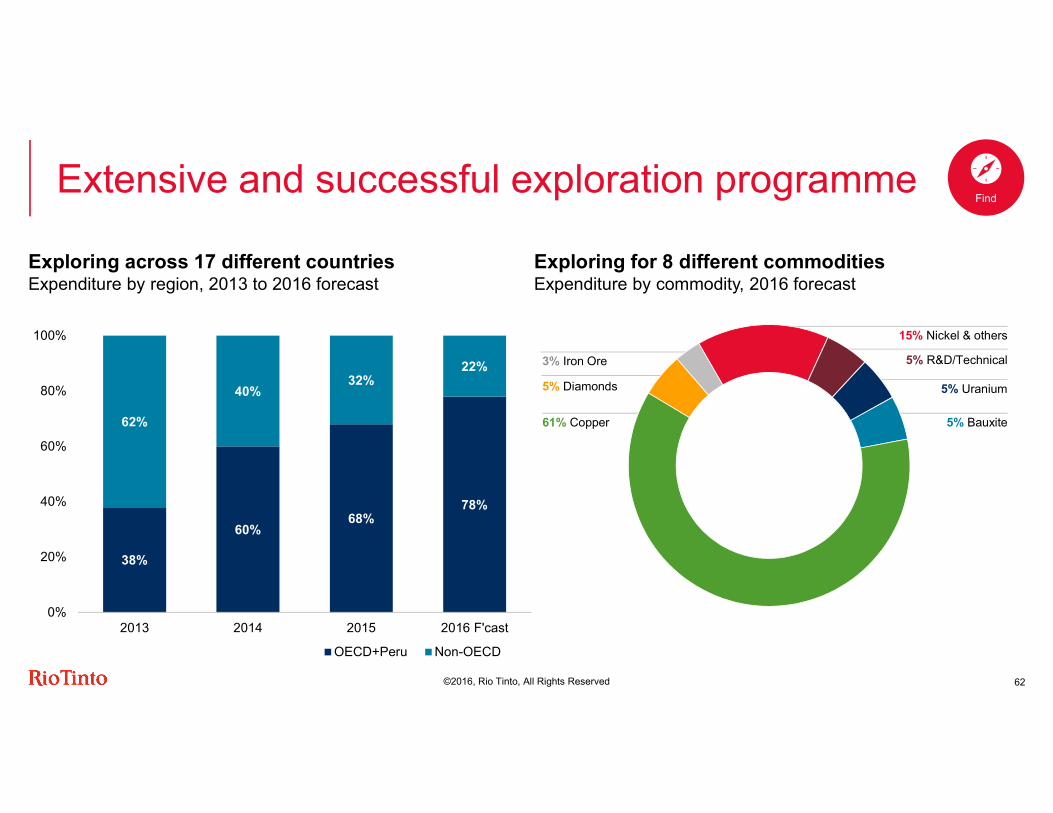
Extensive and successful exploration programme
38%60% 68% 78%
62%40% 32% 22%
0%
20%
40%
60%
80%
100%
2013 2014 2015 2016 F'castOECD+Peru Non-OECD
Exploring across 17 different countriesExpenditure by region, 2013 to 2016 forecast
3% Iron Ore
61% Copper
5% Diamonds
15% Nickel & others
5% Uranium5% R&D/Technical
5% Bauxite
Exploring for 8 different commoditiesExpenditure by commodity, 2016 forecast
Find
62
©2016, Rio Tinto, All Rights Reserved
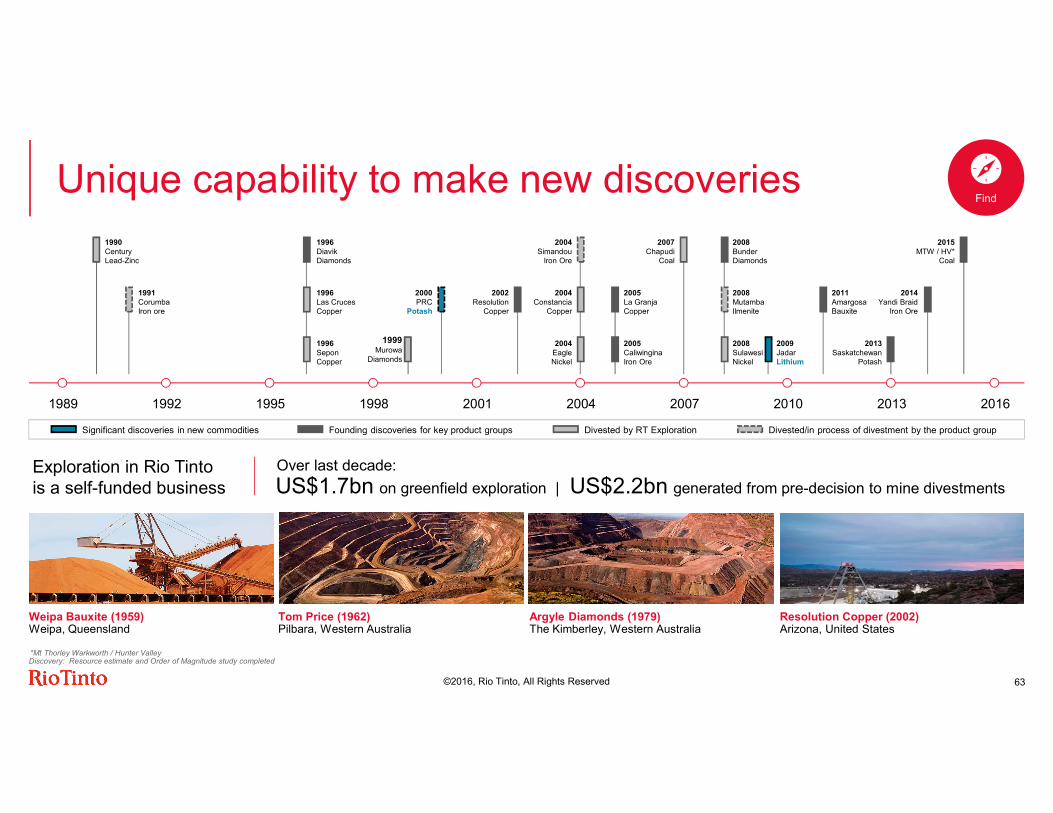
Unique capability to make new discoveries
201620102007 2013200420011998199519921989
1990CenturyLead-Zinc
2015MTW / HV*
Coal1996DiavikDiamonds
2008BunderDiamonds
2000PRC
Potash2011AmargosaBauxite
2013Saskatchewan
Potash2009JadarLithium
2004Constancia
Copper1991CorumbaIron ore
2014Yandi Braid
Iron Ore1996Las CrucesCopper
1996SeponCopper
2004Simandou
Iron Ore
2005La GranjaCopper
2005CaliwinginaIron Ore
2008SulawesiNickel
2008MutambaIlmenite
2004EagleNickel
2002Resolution
Copper
2007Chapudi
Coal
Over last decade:Exploration in Rio Tinto is a self-funded business US$1.7bn on greenfield exploration | US$2.2bn generated from pre-decision to mine divestments
Weipa Bauxite (1959)Weipa, Queensland Tom Price (1962)Pilbara, Western Australia Argyle Diamonds (1979)The Kimberley, Western Australia Resolution Copper (2002)Arizona, United States
Founding discoveries for key product groups Divested by RT Exploration Divested/in process of divestment by the product groupSignificant discoveries in new commodities
Find
63
1999Murowa
Diamonds
*Mt Thorley Warkworth / Hunter ValleyDiscovery: Resource estimate and Order of Magnitude study completed
©2016, Rio Tinto, All Rights Reserved
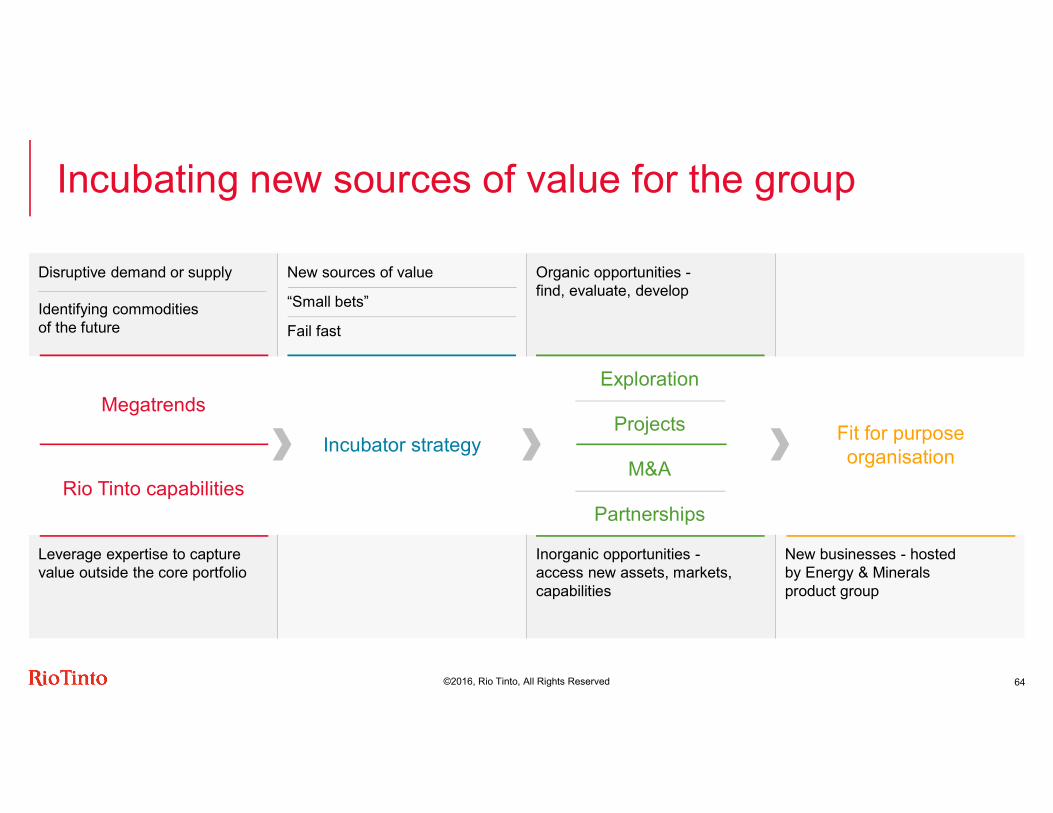
Incubating new sources of value for the group Disruptive demand or supplyIdentifying commoditiesof the future
New sources of value“Small bets” Fail fast
Organic opportunities -find, evaluate, develop
Leverage expertise to capture value outside the core portfolio
Inorganic opportunities -access new assets, markets,capabilities
New businesses - hosted by Energy & Minerals product group
Megatrends
Rio Tinto capabilitiesIncubator strategy
Exploration
M&AProjects
Partnerships
Fit for purpose organisation
64
©2016, Rio Tinto, All Rights Reserved
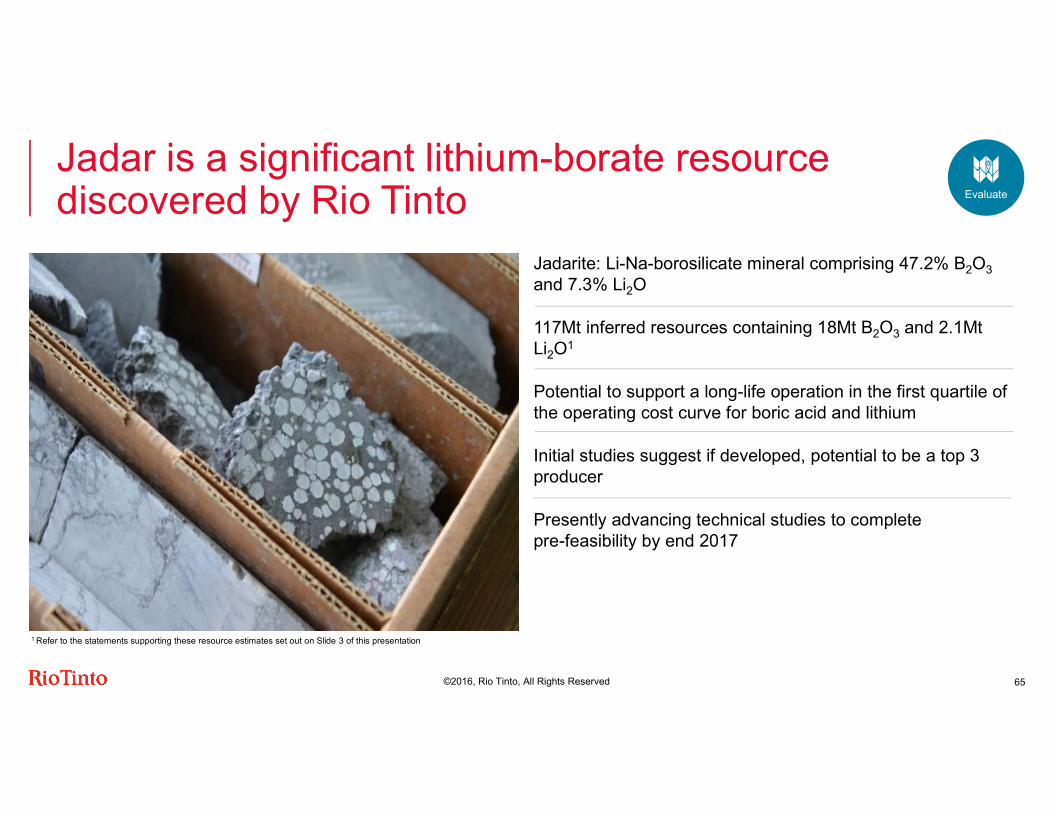
Jadar is a significant lithium-borate resource discovered by Rio TintoJadarite: Li-Na-borosilicate mineral comprising 47.2% B2O3and 7.3% Li2O117Mt inferred resources containing 18Mt B2O3 and 2.1Mt Li2O1
Potential to support a long-life operation in the first quartile of the operating cost curve for boric acid and lithiumInitial studies suggest if developed, potential to be a top 3 producerPresently advancing technical studies to complete pre-feasibility by end 2017
1 Refer to the statements supporting these resource estimates set out on Slide 3 of this presentation
65
Evaluate
©2016, Rio Tinto, All Rights Reserved
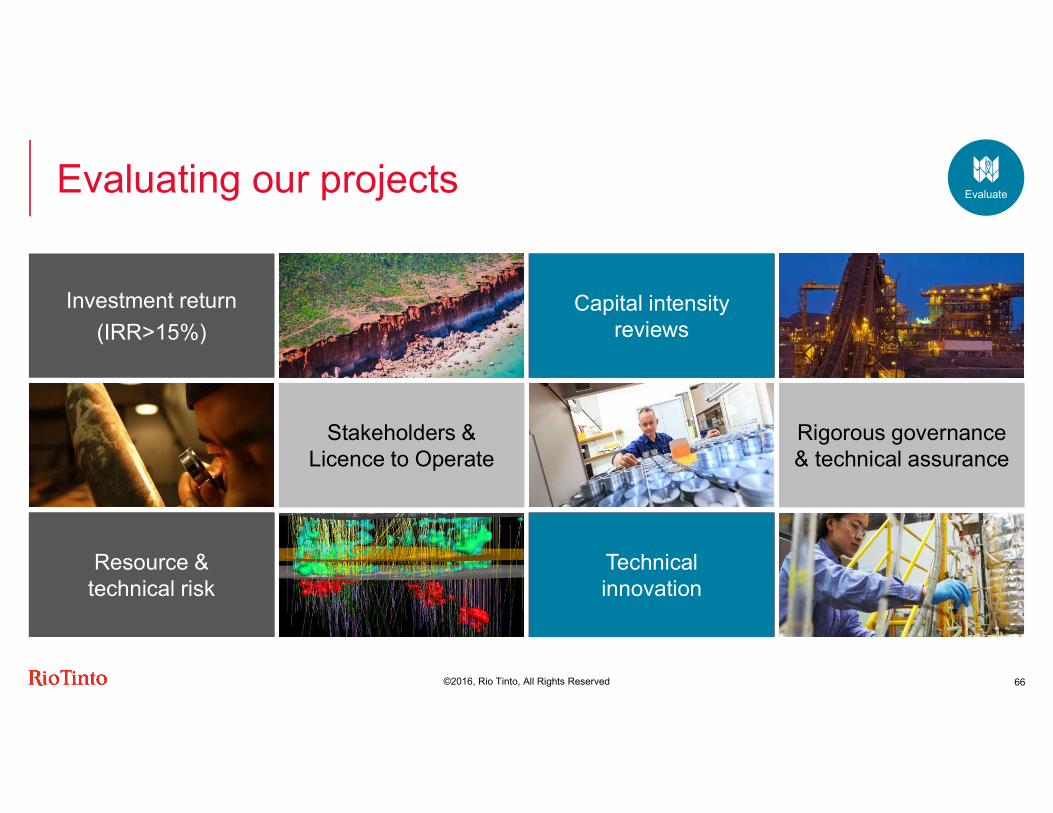
Evaluating our projects
Capital intensity reviews
Technical innovation
Investment return(IRR>15%)
Resource & technical risk
Stakeholders & Licence to Operate
Rigorous governance & technical assurance
66
Evaluate
©2016, Rio Tinto, All Rights Reserved
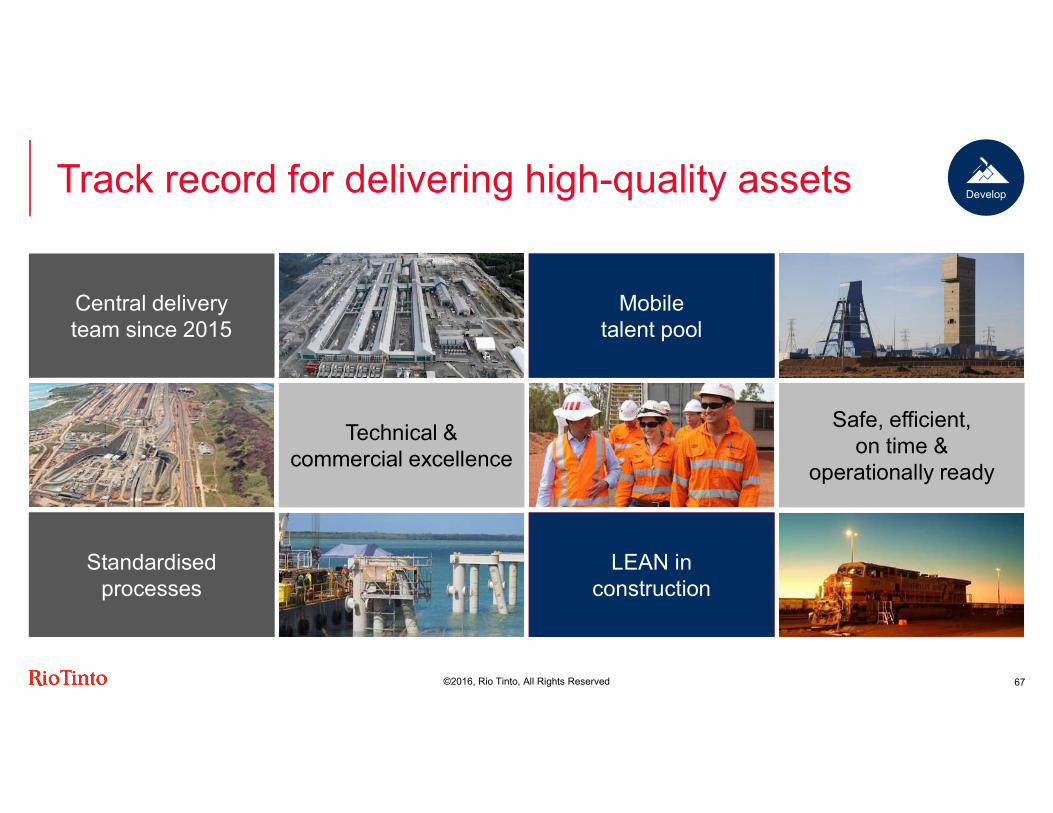
Track record for delivering high-quality assets
Mobile talent pool
LEAN in construction
Central delivery team since 2015
Standardised processes
Technical & commercial excellence
Safe, efficient, on time &
operationally ready
67
Develop

©2016, Rio Tinto, All Rights Reserved
Delivering value through technical excellence
Orebody visualisation with RTVisTM
Technicalexcellence, assurance & support
Our core disciplines;– Geoscience & ore body knowledge– Mining – Processing– Infrastructure– Asset ManagementStrength in mining and processing Replication across large asset base Platforms to deliver automation End to end to fully utilise embedded capability
68
©2016, Rio Tinto, All Rights Reserved
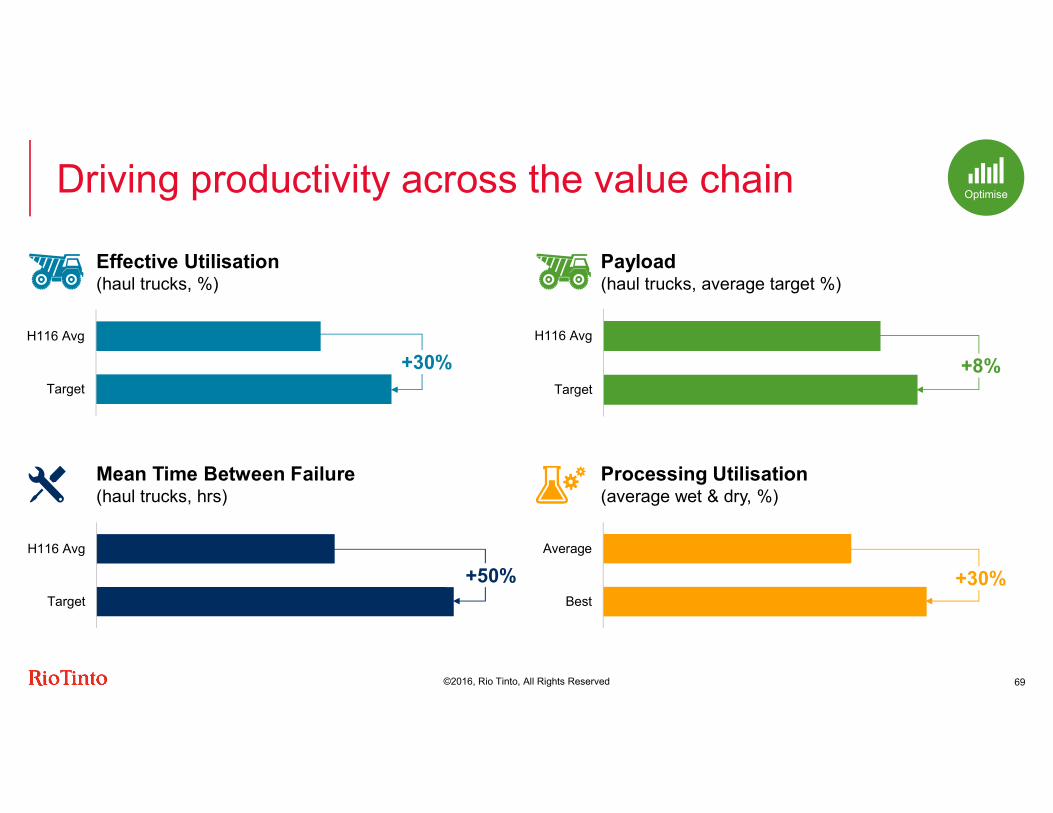
Driving productivity across the value chainEffective Utilisation(haul trucks, %)
Mean Time Between Failure(haul trucks, hrs)
Payload(haul trucks, average target %)
Processing Utilisation (average wet & dry, %)
Target
H116 Avg
Target
H116 Avg
Target
H116 Avg
Best
Average+50%
+8%
+30%
+30%
69
Optimise
©2016, Rio Tinto, All Rights Reserved
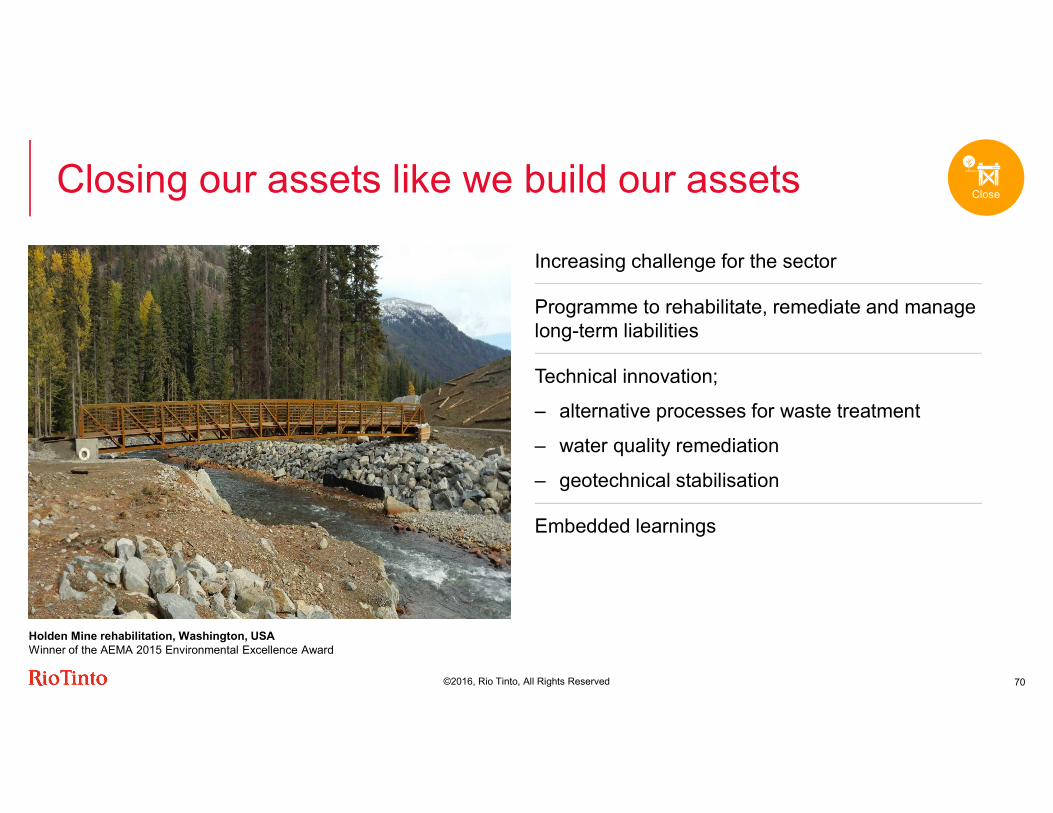
Closing our assets like we build our assets
Holden Mine rehabilitation, Washington, USA Winner of the AEMA 2015 Environmental Excellence Award
Increasing challenge for the sectorProgramme to rehabilitate, remediate and manage long-term liabilities Technical innovation;– alternative processes for waste treatment – water quality remediation– geotechnical stabilisationEmbedded learnings
Close
70
©2016, Rio Tinto, All Rights Reserved
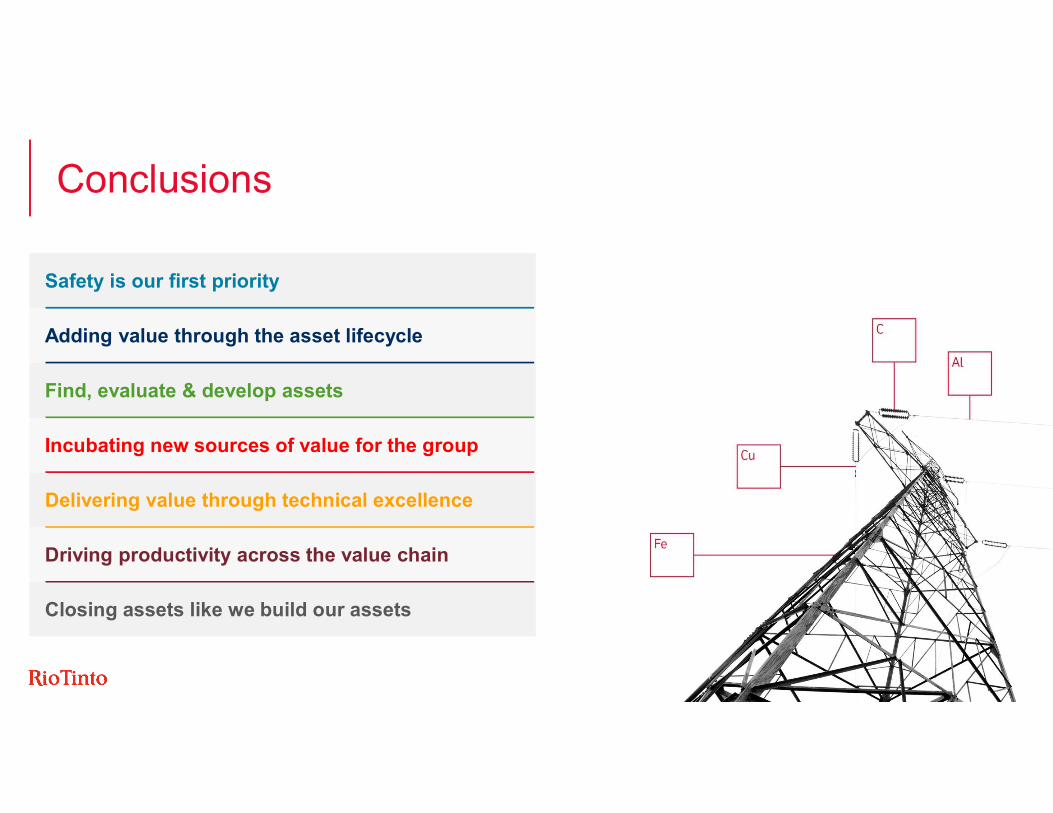
Safety is our first priorityAdding value through the asset lifecycleFind, evaluate & develop assetsIncubating new sources of value for the groupDelivering value through technical excellenceDriving productivity across the value chainClosing assets like we build our assets
Conclusions
Chief executive
J-S Jacques6 December 2016
©2016, Rio Tinto, All Rights Reserved
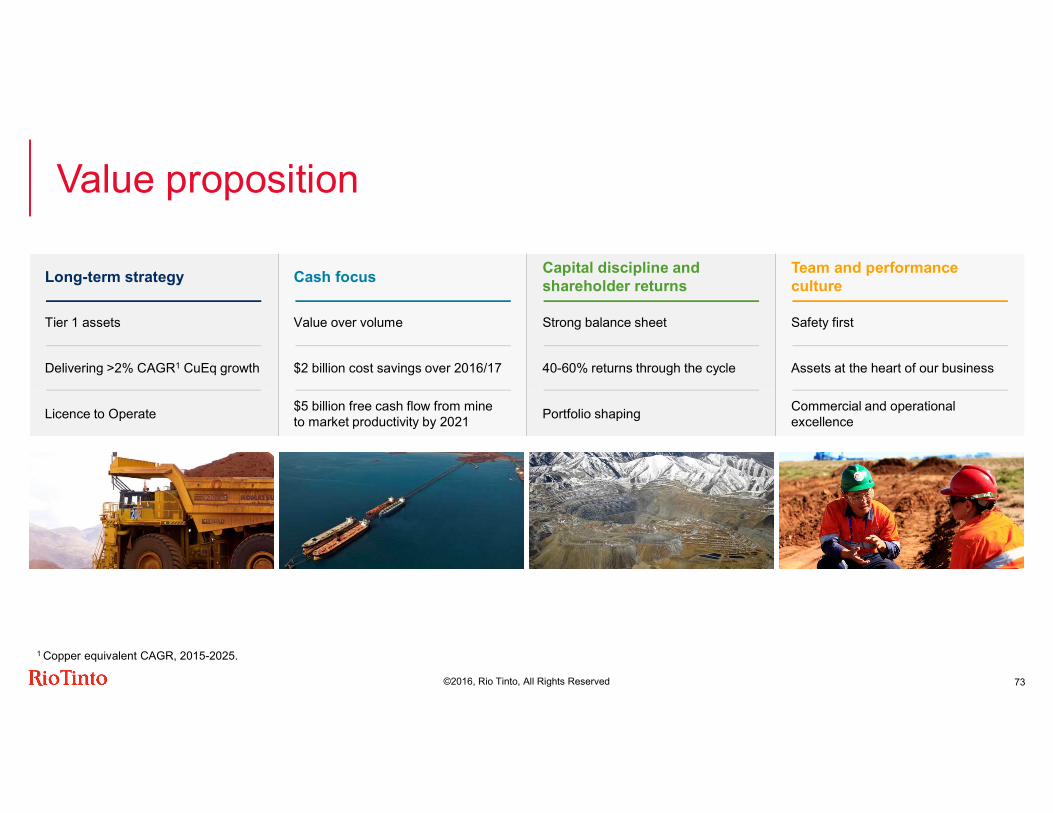
Value proposition Long-term strategy Cash focus Capital discipline and
shareholder returnsTeam and performance culture
Tier 1 assets Value over volume Strong balance sheet Safety first
Delivering >2% CAGR1 CuEq growth $2 billion cost savings over 2016/17 40-60% returns through the cycle Assets at the heart of our business
Licence to Operate $5 billion free cash flow from mine to market productivity by 2021 Portfolio shaping Commercial and operational
excellence
73
1 Copper equivalent CAGR, 2015-2025.
6 December 2016
Investor SeminarLondon
Appendix

©2016, Rio Tinto, All Rights Reserved
Our five highly-valued iron ore products
3%
25%
47%
RVL RVF HIY PBL PBF
18%7%
76
Shipments by product and market 2016 YTD*
* Year-to-date as at end September 2016
Product Strengths
Pilbara BlendFines
– The most traded iron ore product globally– Base load sinter blend in Asian markets
Pilbara BlendLump – Avoids the costs of sintering
HIYFines
– Ideal chemical composition for the Asian sinter blends and favourable coarse sizing.
Robe Valley Fines – Favourable coarse sizing, low phosphorus
Robe Valley Lump
– Low phosphorus– Avoids the costs of sintering
74%
17%
5% 4%
China Japan Korea Taiwan & other
©2016, Rio Tinto, All Rights Reserved
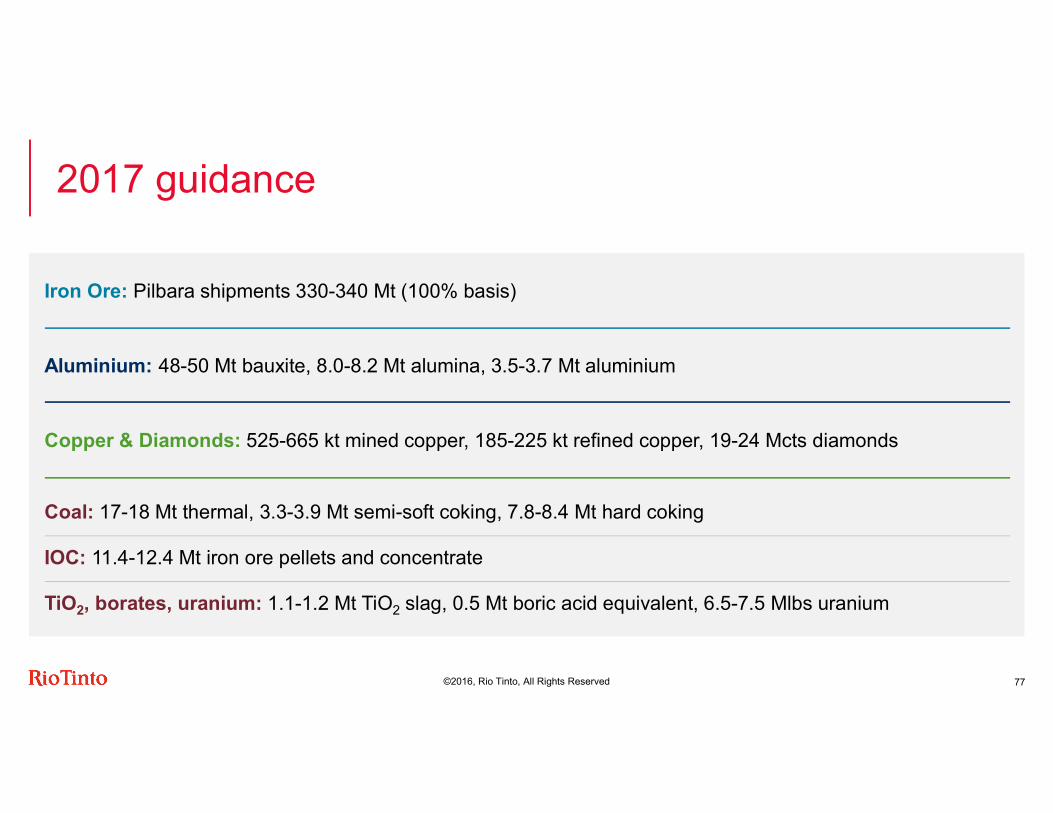
2017 guidance
77
Iron Ore: Pilbara shipments 330-340 Mt (100% basis)
Aluminium: 48-50 Mt bauxite, 8.0-8.2 Mt alumina, 3.5-3.7 Mt aluminium
Copper & Diamonds: 525-665 kt mined copper, 185-225 kt refined copper, 19-24 Mcts diamonds
Coal: 17-18 Mt thermal, 3.3-3.9 Mt semi-soft coking, 7.8-8.4 Mt hard cokingIOC: 11.4-12.4 Mt iron ore pellets and concentrateTiO2, borates, uranium: 1.1-1.2 Mt TiO2 slag, 0.5 Mt boric acid equivalent, 6.5-7.5 Mlbs uranium