
Investors’ Guide1st half of the fiscal yearending … packed with precooked ingredients and...
44
Investors’ Guide 1st half of the fiscal year ending March 31, 2017 Consolidated Results Announced on November 10, 2016 Stock Code 2897 Presentation material followed by Supplemental Data
Transcript of Investors’ Guide1st half of the fiscal yearending … packed with precooked ingredients and...

Investors’ Guide 1st half of the fiscal year ending March 31, 2017
Consolidated Results
Announced on November 10, 2016
Stock Code 2897
Presentation material followed by Supplemental Data

Intentionally Blank

Consolidated Resultsfor the First Half of
the Fiscal Year ending March 31, 2017(1H of FY2017)
Announced on November 10, 2016
1(Reference) Notes for this Material
This presentation material is available in the Financial Statements section of our IR website in PDF format. URL: https://www.nissin.com/en_jp/ir/library/materials/
The amounts in this material are rounded to the nearest 100 million yen; totals may not agree with the sums of their components.
FY2016 in domestic companies means the fiscal year from April 1, 2016 to March 31, 2017.
FY2016 in overseas companies means the fiscal year from Jan. 1, 2016 to Dec. 31, 2016.Exceptions
- The Americas(excluding Colombia): from April 1, 2016 to March 31, 2017
- China area: from April 1, 2016 to March 31, 2017
- India included in Asia: its term of consolidation was changed from FY2017. FY2016 was from Jan 1, 2015 to Dec. 31, 2015 and FY2017 is from April 1, 2016 to Mar. 31, 2017
Regarding the scope of consolidation- Bonchi Co., Ltd.: Its B/S was consolidated from the end of FY2016. Its P/L was consolidated from the
first quarter of FY2017
- Brazil Nissin was consolidated from the third quarter of FY2016
- Indonesia Nissin was consolidated from the first quarter of FY2017
The same ±notation as used in the Summary of Consolidated Financial Statements has been applied to percentage change in sales and income
The average foreign exchange rates for the period have been applied to translating revenues and expenses at affiliates overseas..
Slide numbers appear at the top of right of each slide.
Executive Summary2
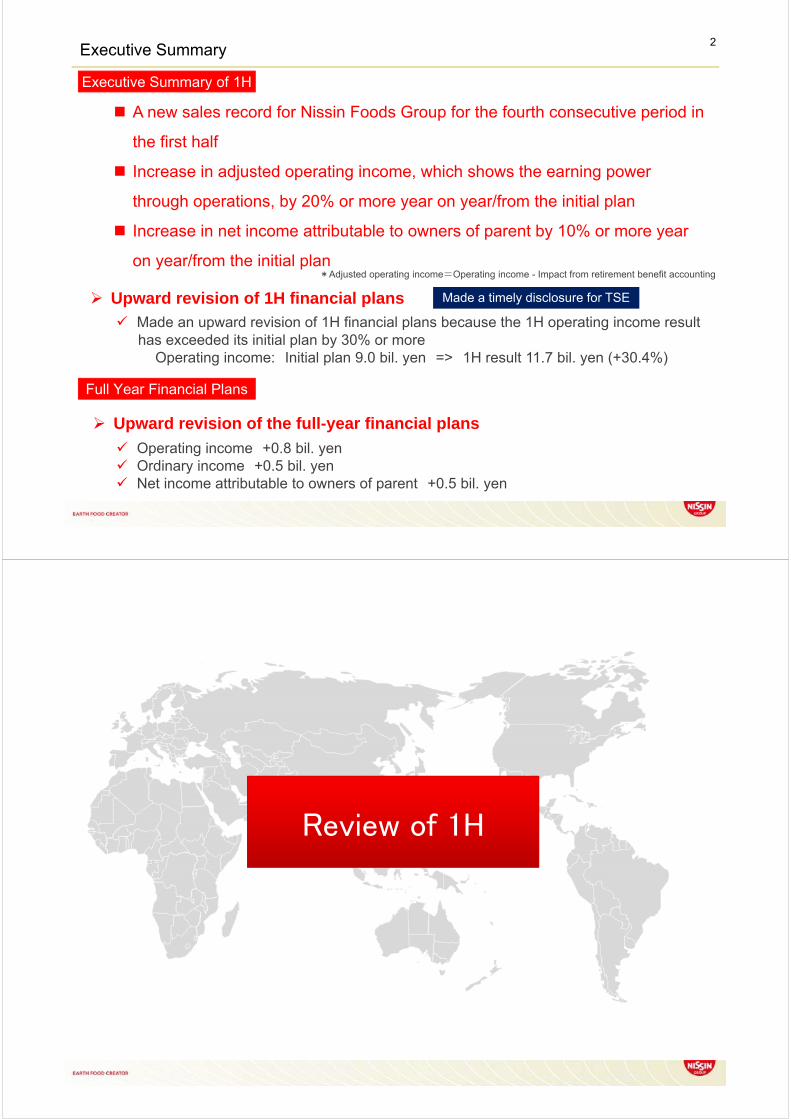
Executive Summary of 1H
* *Adjusted operating income=Operating income - Impact from retirement benefit accounting
Made a timely disclosure for TSE
A new sales record for Nissin Foods Group for the fourth consecutive period in
the first half
Increase in adjusted operating income, which shows the earning power
through operations, by 20% or more year on year/from the initial plan
Increase in net income attributable to owners of parent by 10% or more year
on year/from the initial plan
Upward revision of 1H financial plans
Made an upward revision of 1H financial plans because the 1H operating income result has exceeded its initial plan by 30% or more
Operating income: Initial plan 9.0 bil. yen => 1H result 11.7 bil. yen (+30.4%)
Full Year Financial Plans
Upward revision of the full-year financial plans
Operating income +0.8 bil. yen Ordinary income +0.5 bil. yen Net income attributable to owners of parent +0.5 bil. yen
Review of 1H

vs. FY2016 vs. Initial Plan
235.8 +8.2% -1.7% 217.9 240.0
11.7 -5.3% +30.4% 12.4 9.0
13.9 +21.5% +23.6% 11.5 11.3
13.8 -14.4% +19.7% 16.1 11.5
12.2 +12.9% +16.3% 10.8 10.5
5.0% -0.7pt +1.2pt 5.7% 3.8%
5.8% -1.5pt +1.0pt 7.4% 4.8%
5.2% +0.2pt +0.8pt 5.0% 4.4%
FY2017 FY2016 FY2017
1H Results 1H Initial Plan
Ordinary incomemargin
Adjusted operating
income*
Net income attributable toowners of parent margin
1H Results
Sales
Operating income
Ordinary income
Net income attributable toowners of parent
OP margin
FY2017 1st Half Results: Summary 4
* Adjusted Operating income = Operating income - Impact from retirement benefit accounting
(bil. yen)
YoY Change YoY Change (%)
Instant Noodles 125.3 +3.6 +3.0% 121.7
NISSIN FOOD PRODUCTS 105.2 +3.6 +3.5% 101.6
MYOJO FOODS 20.1 +0.1 +0.4% 20.0
Chilled and frozen business 30.6 +0.5 +1.8% 30.0
Confectionery and drinks 26.3 +6.5 +32.5% 19.9
Domestic others 1.9 +0.0 +1.6% 1.8
Domestic total 184.0 +10.7 +6.1% 173.4
The Americas 27.6 +9.5 +52.5% 18.1
China (incl. H.K.) 17.5 -3.0 -14.9% 20.5
Asia 4.5 +0.7 +19.3% 3.8
EMEA 2.3 +0.1 +3.4% 2.2
Overseas total 51.8 +7.2 +16.3% 44.6
Consolidated sales 235.8 +17.9 +8.2% 217.9
FY2017 FY2016
1H Results (1H Results)
FY2017 1st Half Results: Sales Results by Segment5
Note: 1H plans by segment are not disclosed. Only YoY changes are presented.
(bil. yen)
217.9
2,179
2,215
2,216
2,221
2,286
2,286
2,350
2,350
2,358
235.8
+3.6
+0.1
+0.5
+6.5
+0.0
+9.5
+0.7
+0.1
-3.0
FY2016 Sales
NISSIN FOODPRODUCTS
MYOJO FOODS
Chilled andfrozen business
Confectioneryand drinks
Domestic others
The Americas
China (incl. H.K.)
Asia
EMEA
FY2017 Sales
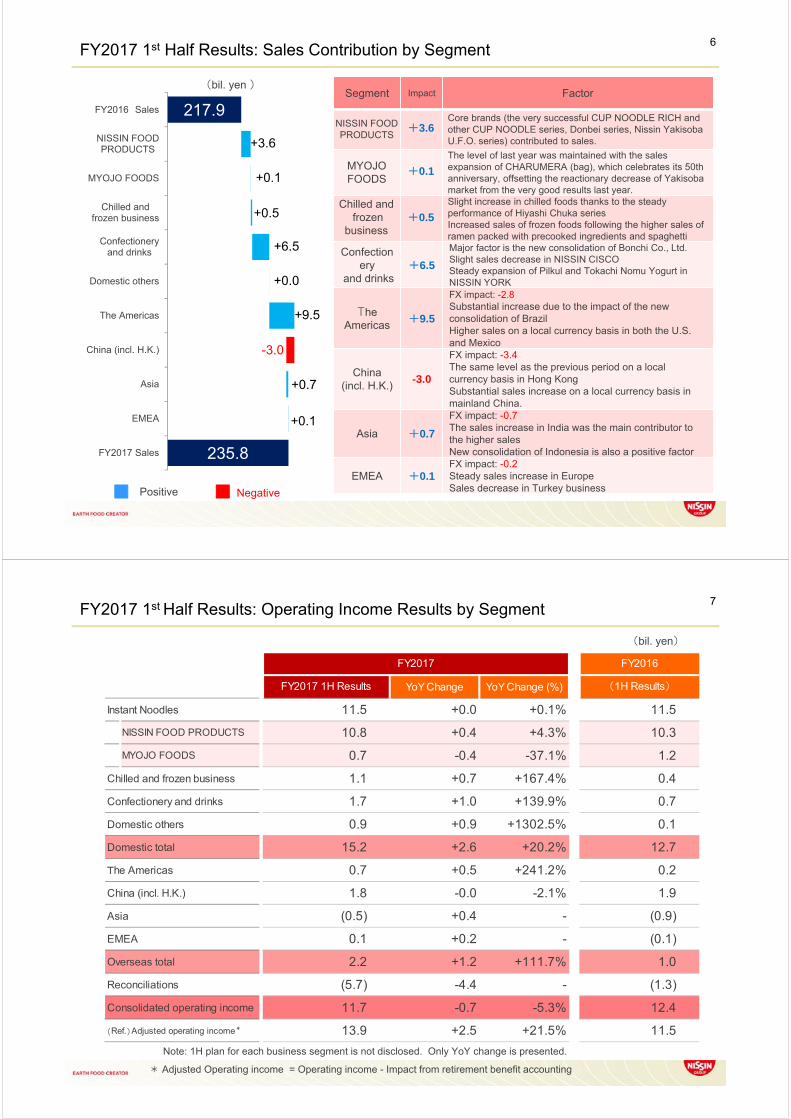
6FY2017 1st Half Results: Sales Contribution by Segment
Positive
(bil. yen )Segment Impact Factor
NISSIN FOOD PRODUCTS
+3.6Core brands (the very successful CUP NOODLE RICH and other CUP NOODLE series, Donbei series, Nissin Yakisoba U.F.O. series) contributed to sales.
MYOJO FOODS
+0.1
The level of last year was maintained with the sales expansion of CHARUMERA (bag), which celebrates its 50th anniversary, offsetting the reactionary decrease of Yakisoba market from the very good results last year.
Chilled andfrozen
business+0.5
Slight increase in chilled foods thanks to the steady performance of Hiyashi Chuka seriesIncreased sales of frozen foods following the higher sales of ramen packed with precooked ingredients and spaghetti
Confectionery
and drinks+6.5
Major factor is the new consolidation of Bonchi Co., Ltd.Slight sales decrease in NISSIN CISCOSteady expansion of Pilkul and Tokachi Nomu Yogurt in NISSIN YORK
The Americas
+9.5
FX impact: -2.8Substantial increase due to the impact of the new consolidation of BrazilHigher sales on a local currency basis in both the U.S. and Mexico
China(incl. H.K.)
-3.0
FX impact: -3.4The same level as the previous period on a local currency basis in Hong KongSubstantial sales increase on a local currency basis in mainland China.
Asia +0.7
FX impact: -0.7The sales increase in India was the main contributor to the higher salesNew consolidation of Indonesia is also a positive factor
EMEA +0.1FX impact: -0.2Steady sales increase in EuropeSales decrease in Turkey businessNegative
YoY Change YoY Change (%)
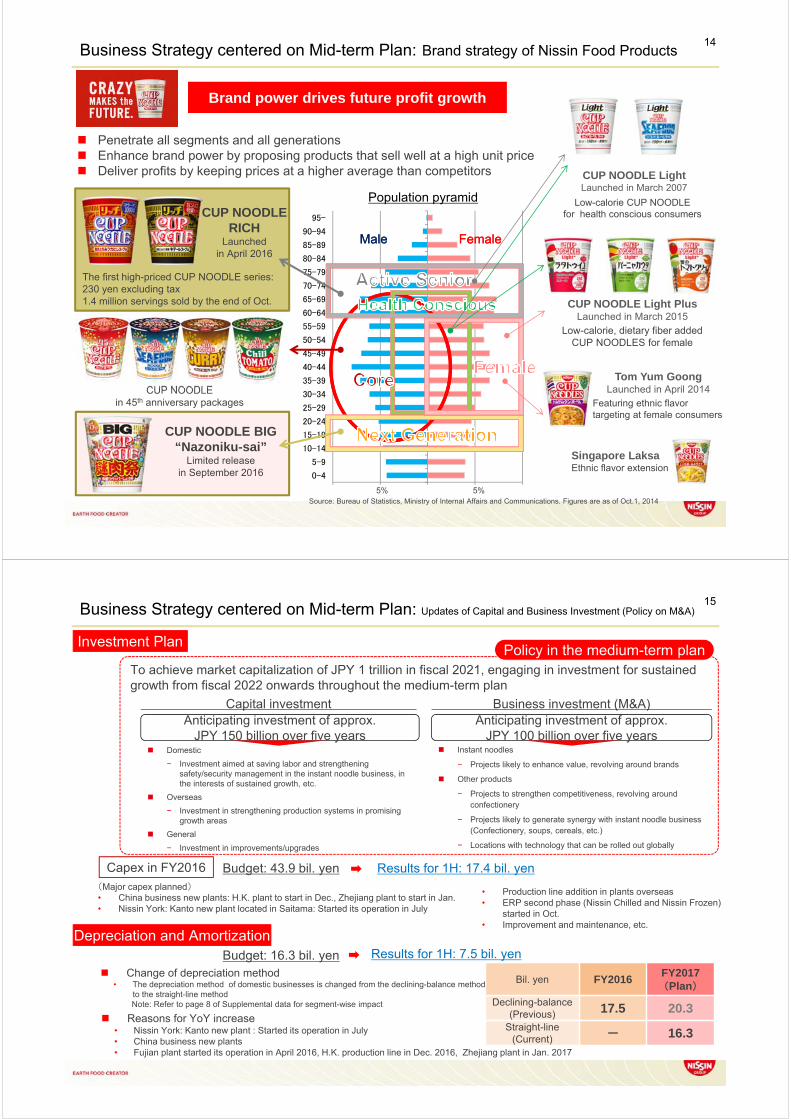
Instant Noodles 11.5 +0.0 +0.1% 11.5
NISSIN FOOD PRODUCTS 10.8 +0.4 +4.3% 10.3
MYOJO FOODS 0.7 -0.4 -37.1% 1.2
Chilled and frozen business 1.1 +0.7 +167.4% 0.4
Confectionery and drinks 1.7 +1.0 +139.9% 0.7
Domestic others 0.9 +0.9 +1302.5% 0.1
Domestic total 15.2 +2.6 +20.2% 12.7
The Americas 0.7 +0.5 +241.2% 0.2
China (incl. H.K.) 1.8 -0.0 -2.1% 1.9
Asia (0.5) +0.4 - (0.9)
EMEA 0.1 +0.2 - (0.1)
Overseas total 2.2 +1.2 +111.7% 1.0
Reconciliations (5.7) -4.4 - (1.3)
Consolidated operating income 11.7 -0.7 -5.3% 12.4
(Ref.)Adjusted operating income* 13.9 +2.5 +21.5% 11.5
FY2017 FY2016
FY2017 1H Results (1H Results)
FY2017 1st Half Results: Operating Income Results by Segment7
(bil. yen)
Note: 1H plan for each business segment is not disclosed. Only YoY change is presented.
* Adjusted Operating income = Operating income - Impact from retirement benefit accounting

12.4
11.7
+0.4
+0.7
+1.0
+0.9
+0.5
+0.4
+0.2
-0.4
-0.0
-3.1
-1.0
-0.3
FY2016 Operating income
NISSIN FOOD PRODUCTS
MYOJO FOODS
Chilled and frozen business
Confectionery and drinks
Domestic others
The Americas
China (incl. H.K.)
Asia
EMEA
The effect of retirement
benefit accounting
Amortization of goodwill and
elimination of intersegment…
Group expenses
FY2017 Operating income
8
Positive Negative
(bil. yen )
FY2017 1st Half Results: Operating Income Contribution by Segment
Segment Impact Factor
NISSIN FOOD PRODUCTS +0.4
Profit increase due to impact of sales increase, offsetting the rise in the ratio of sales expansion costs given the change in product mix associated with the promotion of select brands Note: Special sale price maintained.
MYOJO FOODS -0.4
Profit decrease due to product mix (decrease of the ratio of Cup-type) and depreciation cost increase due to Saitama 2nd
plant.
Chilled and
frozen business
+0.7
Profit increase of chilled foods due to increase in sales ratio of value-added productsSubstantial profit increase due to impact of profit increase arising from higher sales of frozen foods and productivity improvement from strengthened appeal as single item
Confectionery
and drinks+1.0
The new consolidation of Bonchi Co., Ltd.Profits increase of NISSIN CISCO with the improved profitability of granola and other productsImpact of profit increase due to sales increase of NISSIN YORK
Domestic others +0.9 Stable balance of income expenditure of Holdings
The Americas +0.5
FX impact: -0.0The new consolidation of BrazilTemporary increase in marketing costs, etc. due to release of new products in the U.S.
China(incl. H.K.) -0.0
FX impact: -0.4Profit increases both in H.K. and mainland China on a local currency basis
Asia +0.4FX impact: +0.1Decreased operating losses in Vietnam and Thailand
EMEA +0.2FX impact: +0.0Higher income in Europe and marketing cost reductions in Turkey business
Reconciliations -4.4
Impact from retirement benefit accounting: -3.1Goodwill amortization of Brazil business: -0.7
Amortization of goodwill and elimination of intersegment
transactions
C:Promotional expense ratio
+1.2
-0.9
-0.6
-0.1
+0.3
+0.1
+1.1
+1.4
+2.6
-0.6
+0.2
+0.9
-0.3
-1.6
+1.5
+2.6
▲20 0 20 40
FY2017 1H: Analysis of Operating Income: Consolidated (Domestic/Overseas)9
【Calculation method】 (1) Variable costs (A,B,C,D)=(Current FY sales*Previous FY sales ratio)- Current FY costs
(2) Fixed costs (E,F,G)=(Previous FY costs - Current FY costs)
Increase factorsDecrease factors
A:Sales increase
Increase inoperating income
(bil. yen)
B:CoGS ratio
E:Depreciation and amortization
F:Advertisingexpenses
G:General and administrative expenses
(Domestic)
(Overseas)
(Domestic)
(Overseas)
(Domestic)
(Overseas)
(Domestic)
(Overseas)
(Domestic)
(Overseas)
(Domestic)
(Overseas)
(Domestic)
(Overseas)
Increase/decrease of marginal profit
Increase/decrease of fixed expenses
Change of CoGS ratio+ Change of product mix
+ Improvement of production efficiency due to streamlining of
production functions
Change of Promotional Expenses Ratio- Nissin Food Products: Change in sales composition ratio
- Myojo Foods: Change in sales composition ratio
Depreciation and Amortization+ Change of depreciation method to straight-line method:
+ 1.4 bil. yen
- Newly added capital investments
General and Administrative Expenses - Increase by the consolidation of Bonchi Co. Ltd.
Domestic
Sales Increase+ Consolidation of Brazil business
- Negative FX impact
Change of CoGS ratio+ Lower law material cost
+ CoGS ratio improvement by consolidating new companies
Advertising Expenses- Increase by consolidating new companies
General and Administrative Expenses - Increase by consolidating Brazil and Indonesia
Overseas
(Domestic)
(Overseas)
D:Distribution costratio
-2.0 0.0 +2.0 +4.0
YoY change
Note: The chart above omits the negative impact of 4.4 billion yen from “Reconciliations.”

12.2
13.8
11.7
-0.2
-6.2
-2.1
-1.4
Net incomeattributble to owners
of parent
Net incomeattributable to non-controlling interests
Income taxes andothers
Extraordinary loss
Extraordinary gain
Ordinary income
Non-operating loss
Non-operatingincome
Operating income
+3.4
Non-operating Income/Expenses and Extraordinary Gain/Loss10
Non-operating income• Interest income• Dividend income• Gain from sales of marketable securities• Equity in earnings of associates• Others
Non-operating loss• Interest expenses• Foreign exchange loss• Others
Extraordinary gain• Gain on sales of investment in securities
Extraordinary loss• Loss on disposal of fixed assets• Impairment loss• Bad debt expenses• Loss due to a fire• Loss on valuation of investment in
subsidiaries and affiliates• Settlement payout due to contract change
(bil. yen)
Positive
3.4(4.1)0.4(0.4)
0.9(0.8)
1.0(0.8)
0.6(1.5)
0.4(0.6)
(bil. Yen)Figures in parentheses are the results
of the FY ended Mar. 31, 2016
+6.9
Major reasons
0.5(-)
0.4(-)
Negative
1.4(0.4)0.2(0.1)
1.0(0.1)
0.2(0.1)
6.9(0.9)6.8(0.9)
2.1(0.7)0.1(0.2)
0.5(-)-(0.5)
0.5(-)
11Business Strategy centered on Mid-term Plan: FY2021 KPIs and Financial Targets
Setting out KPI based on “earning power through operations” and “value in capital markets” (market capitalization), as requirements for “recognition as a global company”
*1 Adjusted operating income = Operating income – Impact of retirement benefit accounting*2 Market capitalization = Share price × Issued shares at end of year (after deduction of treasury shares)*3 “Net income attributable to owners of parent” under Japanese accounting standards, “profit attributable to
owners of the parent” under IFRS standards*4 Adjusted EPS = Adjusted NOPAT*5 ÷ Average issued shares for the period (after deduction of treasury shares)*5 Adjusted NOPAT = Adjusted operating income + Equity method gains or losses + Amortization of goodwill
(including equity method companies) – Net income attributable to non-controlling interests
Payout ratio: 40% or higher on the average for the five-year period

12Business Strategy centered on Mid-term Plan: Creating Cup-type instant noodle market-1
Brazil CUP NOODLES strategy finally got started!
97%Bag type97%
3%
Composition rates of bag/cup type noodles in instant noodle market(CY 2015, on a serving base)
97%Bag type79%
21%
Bag-type
Cup-type
Worldwide total Brazil market
Create “Cup-type instant noodle market” in Brazil instant noodle market
By increasing the composition rate of cup-type instant noodles in the market,
we aim to realize a significant growth of our Brazil business
Source:WINA Source:WINA
New Launched in September
Bag-type
Cup-type
Bag-type
Cup-type
13
“Seven SAMURAI in BRAZIL”Using top athletes in seven games in TV commercials
-TV commercials
-Website
1.15 -1.35 BRL
3.49 BRL
-Grand food tasting campaign
Tasting on a scale not ever seen
-Sold at/in
3.79 BRL
13.5 BRL
• Overwhelming volume of ingredients
• Paper cup that is not hot when you hold it
• Bright package print
• Six flavors to taste
Offers the best taste ever in Brazil
Development withthe target of youth
SupermarketConvenience Store
Kiosk(small retail shop)+
School, Office, Airport, Subway,
Amusement park, Beach
Business Strategy centered on Mid-term Plan: Creating Cup-type instant noodle market-2
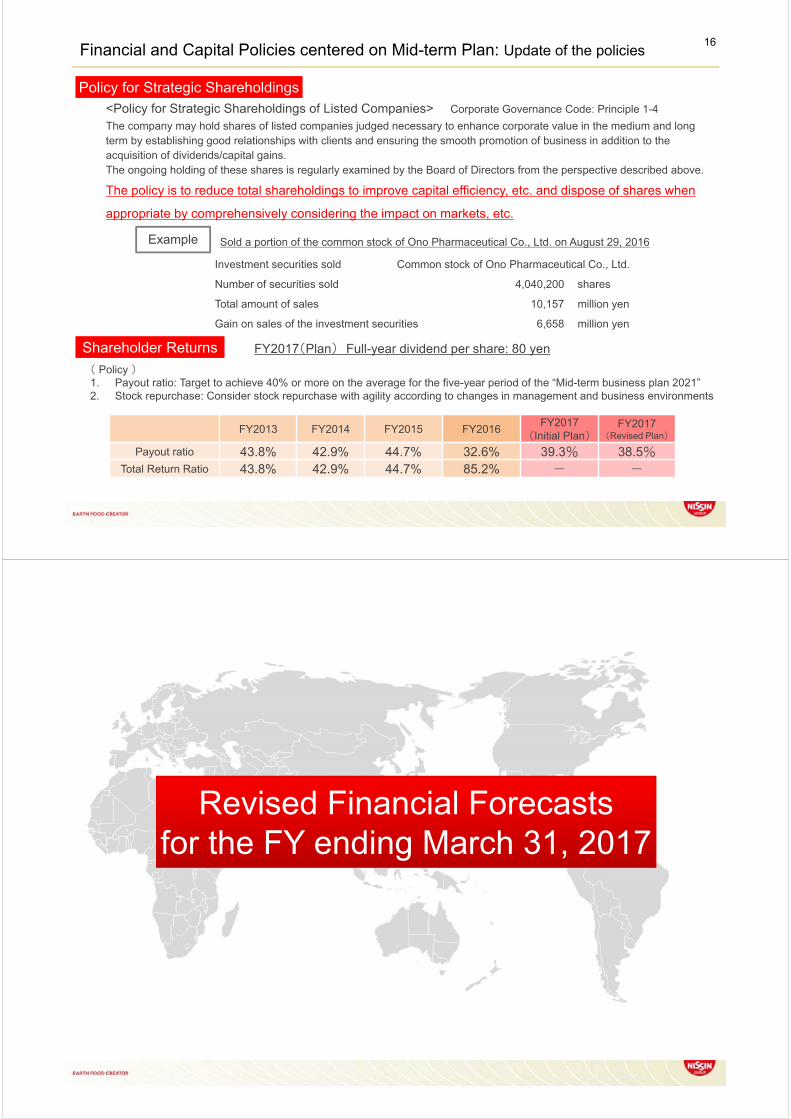
14Business Strategy centered on Mid-term Plan: Brand strategy of Nissin Food Products
-10% -5% 0% 5% 10%
0-4
5-9
10-14
15-19
20-24
25-29
30-34
35-39
40-44
45-49
50-54
55-59
60-64
65-69
70-74
75-79
80-84
85-89
90-94
95-
Population pyramid
FemaleFemaleMaleMale
5%5%
CUP NOODLE Light PlusLaunched in March 2015
CUP NOODLE LightLaunched in March 2007
Penetrate all segments and all generations Enhance brand power by proposing products that sell well at a high unit price Deliver profits by keeping prices at a higher average than competitors
CUP NOODLE RICH
Launched in April 2016
CUP NOODLE BIG“Nazoniku-sai”
Limited release in September 2016
Low-calorie CUP NOODLEfor health conscious consumers
Low-calorie, dietary fiber added CUP NOODLES for female
Featuring ethnic flavor targeting at female consumers
Tom Yum GoongLaunched in April 2014
Singapore LaksaEthnic flavor extension
The first high-priced CUP NOODLE series: 230 yen excluding tax1.4 million servings sold by the end of Oct.
CUP NOODLE in 45th anniversary packages
Brand power drives future profit growth
Source: Bureau of Statistics, Ministry of Internal Affairs and Communications. Figures are as of Oct.1, 2014
Business Strategy centered on Mid-term Plan: Updates of Capital and Business Investment (Policy on M&A)15
Investment Plan
To achieve market capitalization of JPY 1 trillion in fiscal 2021, engaging in investment for sustained growth from fiscal 2022 onwards throughout the medium-term plan
Capital investment
Domestic
− Investment aimed at saving labor and strengthening safety/security management in the instant noodle business, in the interests of sustained growth, etc.
Overseas
− Investment in strengthening production systems in promising growth areas
General
− Investment in improvements/upgrades
Business investment (M&A)Anticipating investment of approx.
JPY 150 billion over five yearsAnticipating investment of approx.
JPY 100 billion over five years Instant noodles
− Projects likely to enhance value, revolving around brands
Other products
− Projects to strengthen competitiveness, revolving around confectionery
− Projects likely to generate synergy with instant noodle business (Confectionery, soups, cereals, etc.)
− Locations with technology that can be rolled out globally
Capex in FY2016 Budget: 43.9 bil. yen(Major capex planned)• China business new plants: H.K. plant to start in Dec., Zhejiang plant to start in Jan.• Nissin York: Kanto new plant located in Saitama: Started its operation in July
• Production line addition in plants overseas• ERP second phase (Nissin Chilled and Nissin Frozen)
started in Oct.• Improvement and maintenance, etc.
Depreciation and AmortizationBudget: 16.3 bil. yen
Bil. yen FY2016FY2017(Plan)
Declining-balance(Previous) 17.5 20.3
Straight-line (Current) - 16.3
Change of depreciation method• The depreciation method of domestic businesses is changed from the declining-balance method
to the straight-line methodNote: Refer to page 8 of Supplemental data for segment-wise impact
Policy in the medium-term plan
Results for 1H: 17.4 bil. yen
Results for 1H: 7.5 bil. yen
Reasons for YoY increase• Nissin York: Kanto new plant : Started its operation in July• China business new plants• Fujian plant started its operation in April 2016, H.K. production line in Dec. 2016, Zhejiang plant in Jan. 2017
16
Policy for Strategic Shareholdings
Financial and Capital Policies centered on Mid-term Plan: Update of the policies
<Policy for Strategic Shareholdings of Listed Companies> Corporate Governance Code: Principle 1-4
The company may hold shares of listed companies judged necessary to enhance corporate value in the medium and long term by establishing good relationships with clients and ensuring the smooth promotion of business in addition to the acquisition of dividends/capital gains.The ongoing holding of these shares is regularly examined by the Board of Directors from the perspective described above.
The policy is to reduce total shareholdings to improve capital efficiency, etc. and dispose of shares when
appropriate by comprehensively considering the impact on markets, etc.
Sold a portion of the common stock of Ono Pharmaceutical Co., Ltd. on August 29, 2016
Investment securities sold
Number of securities sold
Total amount of sales
Gain on sales of the investment securities
Common stock of Ono Pharmaceutical Co., Ltd.
4,040,200
10,157
6,658
shares
million yen
million yen
Shareholder Returns
( Policy )1. Payout ratio: Target to achieve 40% or more on the average for the five-year period of the “Mid-term business plan 2021”2. Stock repurchase: Consider stock repurchase with agility according to changes in management and business environments
FY2017(Plan) Full-year dividend per share: 80 yen
FY2013 FY2014 FY2015 FY2016FY2017
(Initial Plan)FY2017
(Revised Plan)
Payout ratio 43.8% 42.9% 44.7% 32.6% 39.3% 38.5%
Total Return Ratio 43.8% 42.9% 44.7% 85.2% - -
Example
Revised Financial Forecastsfor the FY ending March 31, 2017

vs. FY2016 vs. Initial Plan
50.0 +6.8% - 468.1 500.0
27.8 +5.3% +3.0% 26.4 27.0
32.3 +31.1% +2.5% 24.7 31.5
31.5 +2.5% +1.6% 30.7 31.0
22.5 -16.3% +2.3% 26.9 22.0
5.6% -0.1pt +0.2pt 5.6% 5.4%
6.3% -0.3pt +0.1pt 6.6% 6.2%
4.5% -1.2pt +0.1pt 5.7% 4.4%
OP margin
Ordinary incomemargin
Net income attributable toowners of parent margin
Sales
Operating income
Adjusted operating
income*
Ordinary income
Net income attributable toowners of parent
FY2017 FY2016 FY2017
Revised Plan (Results) (Initial Plan)
Revised Financial Forecasts (Full Year)18
* Adjusted Operating income = Operating income - Impact from retirement benefit accounting
Gain a momentum by achieving the first-year targets of “Mid-term management plan 2021”(bil. yen)
vs. FY2016 vs. Initial Plan
NISSIN FOOD PRODUCTS 27.7 +15.5% +3.7% 24.0 26.7
Domestic others 7.3 +127.4% -2.7% 3.2 7.5
Domestic total 34.9 +28.6% +2.3% 27.2 34.1
Overseas total 4.3 +50.4% - 2.8 4.3
Reconciliations (11.4) - - (3.6) (11.4)
Consolidated operating income 27.8 +5.3% +3.0% 26.4 27.0
(Ref.)Adjusted operating income* 32.3 +31.1% +2.5% 24.7 31.5
FY2017 FY2016 FY2017
Revised Plan (Results) (Initial Plan)
vs. FY2016 vs. Initial Plan
NISSIN FOOD PRODUCTS 228.3 +2.1% - 223.6 228.3
Domestic others 155.5 +8.3% - 143.5 155.5
Domestic total 383.8 +4.5% - 367.1 383.8
Overseas total 116.2 +15.1% - 100.9 116.2
Consolidated sales 500.0 +6.8% - 468.1 500.0
FY2017 FY2016 FY2017
Revised Plan (Results) (Initial Plan)
19Revised Financial Forecasts (Full Year) Sales and Operating Income
(bil. yen)Sales
(bil. yen)
Operating income
* Adjusted Operating income = Operating income - Impact from retirement benefit accounting

NISSIN FOODS HOLDINGS CO., LTD.
APPENDIX

FY2017 Domestic Businesses Qualitative Information by Segment - 122
45th 40th 40thCUP NOODLE Nissin-no-Donbei Yakisoba U.F.O
Leverage “Anniversary Year” brands
NISSIN FOOD PRODUCTS Generate Cash and Enhance Profitability
Challenge to be a 100-brand year company Maximize existing brand value
“Beyond Instant Foods” Creating new value and new market
To achieve two-year straight record-high sales
Core brand sales expansion
Chicken Ramen Nissin MensyokuninNissin RAOH
Attract senior people and female
CUP NOODLE RICH CUP NOODLE Ethnic series
1st Half Bag-type: YoY -4%, Cup-type: YoY +5%, Nissin Food Products Sales Total: YoY +3%
HigherSales
Major three brands Significant sales increase due to effective product strategy
commemorating anniversary
Making news mainly centered around brand communications
Full-year Management Policy
Temporary suspension of sales due to lack of
production capacity caused by overwhelming popularity
Increased number of news about Donbei
Sep. 2014- Sep. 2015-
Doubling annual number of times of becoming a topic of conversation on
social media
HigherSales
HigherSales
23
MYOJO FOODS Enhance main brands and practice proposal-type marketing
Thorough enhancement of main brands Strengthen communication through ads
Develop new concept products Expansion of “Teitoshitsumen”
Clarify strategies by sales channel
Anniversary Year
Ippeichan Yomise-no-Yakisoba
New concept
(Low-carbohydrate noodles) Teitoshitsumen
1st Half
To be the No. 1 in yakisoba category
CHARUMERA
Restrengthen“MYOJO CHARUMERA”
brand commemorating 50th anniversary
Sales
increased by
10% or higher
(Ref.) MYOJO FOODS Group including intersegment salesFY2017 FY2016
1H Results Amount % 1H Results
MYOJO FOODS Group 23.0 +0.2 +0.8% 22.8
(intersegment sales) (2.9) (+0.1) (+4.2%) (2.8)
MYOJO FOODS Segment 20.1 +0.1 +0.4% 20.0
Change
Full-year Management Policy
Bag-type: YoY +4%, Cup-type: YoY -1%, MYOJO FOODS Sales Total: YoY +1%
FY2017 Domestic Businesses Qualitative Information by Segment - 2

FY2017 Domestic Businesses Qualitative Information by Segment - 324
Nissin Frozen Foods Focus on growth category, enhance strategic products and develop new sales channel
Nissin Chilled Foods Nurture value-added brands and leverage technologies
Enhance main brands Focus on growing products Selecting selling products
Nurture new generation brands Offer new value and meet market needs
Product development with originality
Gyoretsu-no-
dekiru-mise
Futomen
Yakisoba
Chukahu
Ryanmen
Mazemen
Enhance three pillars of frozen foods business Household use, Home delivery use and Professional use
Strengthen appeal as single item Improve profitability by strengthening appeal as single item
Strategy by sales channel Accommodate to growing frozen food category at
convenience stores
Spa-O PremiumMochitto Nama
PastaNISSIN GooTa
1st Half
1st Half
Hiyashi Chuka (Cold noodles) Sales expansion due to “Ryanmen” sales campaign and renewal of
“Nissin-no-Ramenyasan”
Nurture next generation brand Sales expansion of next generation products including “Mazemen”
Strengthen appeal as single item Grow to be the No. 1 product in each category: Target 1 billion yen sales
by each product
“GooTa Rajao Tan Tan Men,” “Mochitto Nama Pasta,” “Spa-O Premium”
Pursue cost benefit by streamlining production system CoGS decrease by shifting to a higher efficiency production system
in conjunction with strengthened appeal as single item
Full-year Management Policy
Full-year Management Policy
Sales: +0% yoy OP: Increased yoy
Sales: +3% yoy OP: Increased yoy
25
Nissin Cisco Promote growth with the growth business (Granola) and the starting business (Confectionery) as a pair of wheels
FY2017 Domestic Businesses Qualitative Information by Segment - 4
Improve brand value of “Gorotto Granola” Enhance product quality and value strategy
Coconut Sable: To be a 100-year brand Improvement of quality and usability Four packages in small quantity inside (from Oct.)
Bonchi Its B/S was consolidated at the end of FY2016. Its P/L was consolidated from April 2016.
Consolidated from FY2017
Consider synergy effects with Nissin Cisco and
Koikeya Co., Ltd.
Heighten supply quantity and improve productivity by starting operation at Kanto new factory
Strengthen sales activities of two big brands “Pilkul” and “Tokachi Nomu Yogurt”
Appeal functional value of “Pilkul” Sales expansion of “Tokachi Nomu Yogurt” by increasing
the number of stores that carry the product
Nissin York Improve productivity and expand production capacity by getting Kanto new factory started
1st Half
1st Half
1st Half
Improvement of earnings structure of granola Change of earnings structure by enhancing product
quality and value strategy
“Coconut Sable” Steady improvement of the purchase rate of customers
through marketing to win over younger consumers
“Choco Flakes” Improved quality and integration of brands
Sales increase of major brands centered on “Bonchi-age”
Enhance exposure by Nissin group-wide brand tie-ups
“Pilkul” Appeal its quality and expand sales space by utilizing “Ask Doctors”
“Tokachi Nomu Yogurt” Strengthen proposal power and add SKU by introducing a variety of flavors
Kanto new plant started its operation Started production in new plant from July
Full-year Management Policy
Full-year Management Policy
Full-year Management Policy
Sales: -2% yoy OP: Increased yoy
Sales: +8% yoy OP: Increased yoyBonchi was out of the scope of consolidation last year
Sales: +18% yoy OP: Increased yoy

Hong Kong Secure sales and OP of existing brands Production capacity expansion of
mainland China-oriented “Demae Iccho”
Mainland China Expand and enhance sales network Strengthen sales forces focused on “CUP NOODLES” Sales expansion of Hong Kong-made “Demae Iccho” Upgrade product availability through expansion and
enhancement of factories
Other
Expand confectionery business at Nissin Koikeya Foods
26
U.S. Secure sales and OP of existing brands Marketing accommodating to consumer’s attitude
Mexico Sales increase with the tailwind from getting out of scope
of the IEPS tax Improve profitability from price revisions
Brazil Accelerate decision-making process Establish a foothold of creating cup-type
noodle market as the market leader
Accommodate to changes of the market and enhance strategies of Brazil Nissin
FY2017 Overseas Businesses Qualitative Information by Segment - 1
The Americas
China Enhance production system with sales expansion
1st Half
1st Half
U.S. Product renewal in response to changing consumer’s sentiment
Mexico Improved profitability by price revisions
Brazil Preparation period for execution of the CUP NOODLES strategy in the
second half. Sales increase with the impact of February’s price change,
despite a decrease in the sales volume following a fire at a factory. Profit
declined on prior investment in the “CUP NOODLES” strategy.
Hong Kong Less tourists from mainland China
Mainland China Geographical area expansion
Higher turnover at store fronts in existing business area: Shanghai and Beijing
Sales promotion in Guangdong and Fujian
New plant started: Fujian Nissin from April 2016
*Contains small amounts of naturally occurring glutamates20% less sodium. No added MSG*, No artificial flavors
Full-year Management Policy
Full-year Management Policy
Sales: -0% yoy OP: Increased yoy
Sales: +7% yoy OP: Increased yoy
Sales: +4% yoy OP: Decreased yoyBrazil business was out of the scope of consolidation last year
Sales: +1% yoy OP: Decreased yoy
Sales: +13% yoy OP: Increased yoy
Note: YoY comparisons are on a local currency basis (sourced from local entities)
27FY2017 Overseas Businesses Qualitative Information by Segment - 2
Asia
EMEA Strengthen production capacityassociated with sales expansion
Quick recovery of India business, Focus on growth segments, and Alliance with Mitsubishi Corp.
India Expand market share with the early recovery from the
Maggi issue and active investment during the period when the share is changing
Expand sales of “CUP NOODLES” primarily at eight metropolitans
Thailand Approach young generation with “CUP NOODLES”
Singapore Stabilize profit base by strengthening cup/bowl types
Vietnam Improve efficiency and decrease operating loss by
focusing sales resources on major cities
Nurture CUP NOODLES
Indonesia Newly consolidated from this fiscal year
Introducing high-priced products including “CUP NOODLES” and “U.F.O.” through mimi-mart distribution channel
Europe Establish stable management base
Expand new market
Consider an alliance with Premier Foods (U.K.)
Turkey Maintain distribution and review sales system of instant
pasta “MakarNecks”
1st Half
1st Half
India*
Expand sales of “CUP NOODLES” primarily at eight metropolitans
Marketing investment to revitalize instant noodle demand
Thailand CUP NOODLES’s price revision
Singapore Strengthen sales of cup/bowl type that have higher profitability
Strengthen traditional trade distribution channel
Vietnam Focus resources on major cities for prioritizing sales efficiency
CUP NOODLES for Vietnam was launched in June 2016
Indonesia Nissin’s technology is introduced after the dissolution of the JV
CUP NOODLES for Indonesia was launched in April 2016
Sales: Nearly doubled yoy Operating loss: Flat yoy
Europe “CUP NOODLES”, “Soba”, “Demae Iccho” brands, which sold in
European area, performed well
Turkey Review sales system and product strategy
Note: YoY comparisons are on a local currency basis (sourced from local entities)* The scope of 1H financial results of India was Jan. to June in FY2015, and Apr. to Sep. in FY2016
Full-year Management Policy
Full-year Management Policy
Sales: Slightly decreased yoy Operating loss: Decreased yoy
Sales: Slightly decreased yoyOperating income: Increased yoy
Sales: Decreased yoy Operating loss: Decreased yoy
Newly consolidated from this fiscal year
Sales: Increased yoy Operating income: Increased yoy
Sales: Decreased yoy Operating loss: Decreased yoy

NISSIN FOODS HOLDINGS CO., LTD.

November 10, 2016
NISSIN FOODS HOLDINGS CO., LTD.IR Office
(TSE 2897)First Half(Six Months) ended September 30, 2016
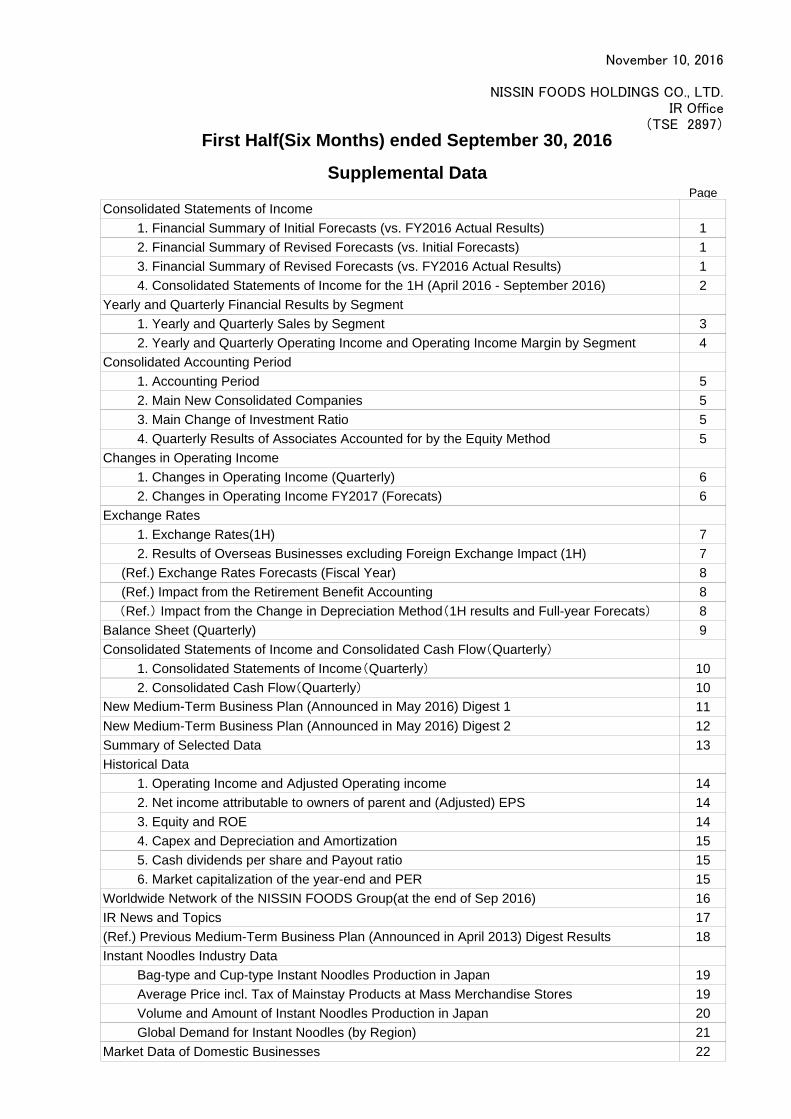
Supplemental DataPage
Consolidated Statements of Income1. Financial Summary of Initial Forecasts (vs. FY2016 Actual Results) 12. Financial Summary of Revised Forecasts (vs. Initial Forecasts) 13. Financial Summary of Revised Forecasts (vs. FY2016 Actual Results) 14. Consolidated Statements of Income for the 1H (April 2016 - September 2016) 2
Yearly and Quarterly Financial Results by Segment1. Yearly and Quarterly Sales by Segment 32. Yearly and Quarterly Operating Income and Operating Income Margin by Segment 4
Consolidated Accounting Period1. Accounting Period 52. Main New Consolidated Companies 53. Main Change of Investment Ratio 54. Quarterly Results of Associates Accounted for by the Equity Method 5
Changes in Operating Income1. Changes in Operating Income (Quarterly) 62. Changes in Operating Income FY2017 (Forecats) 6
Exchange Rates1. Exchange Rates(1H) 72. Results of Overseas Businesses excluding Foreign Exchange Impact (1H) 7
(Ref.) Exchange Rates Forecasts (Fiscal Year) 8 (Ref.) Impact from the Retirement Benefit Accounting 8 (Ref.) Impact from the Change in Depreciation Method(1H results and Full-year Forecats) 8Balance Sheet (Quarterly) 9Consolidated Statements of Income and Consolidated Cash Flow(Quarterly)
1. Consolidated Statements of Income(Quarterly) 102. Consolidated Cash Flow(Quarterly) 10
11New Medium-Term Business Plan (Announced in May 2016) Digest 2 12Summary of Selected Data 13Historical Data
1. Operating Income and Adjusted Operating income 142. Net income attributable to owners of parent and (Adjusted) EPS 143. Equity and ROE 144. Capex and Depreciation and Amortization 155. Cash dividends per share and Payout ratio 156. Market capitalization of the year-end and PER 15
Worldwide Network of the NISSIN FOODS Group(at the end of Sep 2016) 16IR News and Topics 17(Ref.) Previous Medium-Term Business Plan (Announced in April 2013) Digest Results 18Instant Noodles Industry Data
Bag-type and Cup-type Instant Noodles Production in Japan 19Average Price incl. Tax of Mainstay Products at Mass Merchandise Stores 19Volume and Amount of Instant Noodles Production in Japan 20Global Demand for Instant Noodles (by Region) 21
Market Data of Domestic Businesses 22
New Medium-Term Business Plan (Announced in May 2016) Digest 1

1. Financial Summary of Initial Forecasts (vs. FY2016 Actual Results) Bil. Yen
Adjusted Operating income*1
*1: Adjusted Operating income = Operating income - Impact from retirement benefit accounting
2. Financial Summary of Revised Forecasts (vs. Initial Forecasts) Bil. Yen
Adjusted Operating income*1
*1: Adjusted Operating income = Operating income - Impact from retirement benefit accounting
3. Financial Summary of Revised Forecasts (vs. FY2016 Actual Results) Bil. Yen
Adjusted Operating income*1
*1: Adjusted Operating income = Operating income - Impact from retirement benefit accounting-4.4 +12.9% -36.0% -16.3%
+21.5% +39.4% +31.1%
+0.8 -14.4% +21.1% +2.5%
+31.9 +8.2% +5.6%
Net income attributable to owners of parent 10.8 16.1 26.9 12.2 10.3 22.5 +1.4 -5.8
Ordinary income 16.1 14.6 30.7 13.8 17.7 31.5 -2.3 +3.1
11.5 13.2 24.7 13.9 18.4 32.3 +2.5 +5.2 +7.7
+6.8%
Operating income 12.4 14.0 26.4 11.7 16.1 27.8 -0.7 +2.1 +1.4 -5.3% +14.7% +5.3%
Net sales 217.9 250.1 468.1 235.8 264.2 500.0 +17.9 +14.0
FY2016 (Actual Results) FY2017 (RevisedForecasts) Changes in Amount Changes in Ratio
1H 2H FY 1H 2H FY 1H 2H FY 1H 2H FY
-4.9 -2.9% -28.4% -18.2%Net income attributable to owners of parent 10.8 16.1 26.9 10.5 11.5 22.0 -0.3 -4.6
-1.7% +53.6% +27.9%
Ordinary income 16.1 14.6 30.7 11.5 19.5 31.0 -4.6 +4.9 +0.3 -28.5% +33.2% +0.9%
11.5 13.2 24.7 11.3 20.3 31.5 -0.2 +7.1 +6.9
+31.9 +10.1% +3.9% +6.8%
Operating income 12.4 14.0 26.4 9.0 18.0 27.0 -3.4 +4.0 +0.6 -27.4% +28.6% +2.3%
Net sales 217.9 250.1 468.1 240.0 260.0 500.0 +22.1 +9.9
FY2016 (Actual Results) FY2017 (Initial Forecasts) Changes in Amount Changes in Ratio
1H 2H FY 1H 2H FY 1H 2H FY 1H 2H FY
FY2017 (Initial Forecasts) FY2017 (RevisedForecasts) Changes in Amount
FY FY
31.0 31.5 +0.5
Net sales +4.2 -
+3.0%
11.3 20.3 13.9 18.4 +2.7 -1.9 +23.6% -9.2%
500.0 500.0 -
27.0
31.5 32.3
27.8 +0.8
+0.8
240.0 260.0 235.8 264.2 -4.2
Changes in Ratio
1H 2H 1H 2H 1H 2H 1H 2H FYFY-1.7% +1.6%
Operating income 9.0 18.0 11.7 16.1 +2.7 -1.9 +30.4% -10.8%
+2.5%
Ordinary income 11.5 19.5 13.8 17.7 +2.3 -1.8 +19.7% -9.1% +1.6%
+2.3%Net income attributable to owners of parent 10.5 11.5 12.2 10.3 +1.7 -1.2 +16.3% -10.6%+0.522.0 22.5
Consolidated Statements of Income
1

4.Consolidated Statements of Income for the 1H (April 2016 - September 2016) Bil. Yen
1 Net SalesCost of goods sold(excl. retirement benefit expenses)
Retirement benefit expenses
Total cost of goods sold
3 Gross profit
Promotional expenses
Advertising expenses
Distribution expenses
Retirement benefit expenses
General expenses Total selling, general and administrative expenses
5 Operating income
Interest income
Dividend income
Gain on sales of marketable securities Equity in earnings of associates
Others
Total non-operating income
Interest expense
Foreign exchange loss
Others
Total non-operating expenses
7 Ordinary Income
Gain on sales of fixed assets Gain on sales of investments in securities
Others
Total extraordinary gains
Loss on disposal of fixed assets
Impairment loss
Bad debt expenses
Loss due to a fire Loss on valuation of investment in subsidiaries and affiliates
Settlement payout due to contract change
Others
Total extraordinary losses
9 Income before income taxes
10 Income taxes
11 Net income
12 Net income attributable tonon-controlling interests
13 Net income attributable toowners of parent
14 Comprehensive Income
Note: Figures are calculated based on thousand yen and rounded to the nearest 100 million yen.
Ratio
217.9 100.0% 235.8 100.0% +17.9 +8.2%
FY2016 1H FY2017 1H YoY Change
Amount Ratio to Sales Amount Ratio to
Sales Amount
(0.3) -0.2% 0.8 0.3% +1.1 -+5.6%
2122.0 56.0% 128.8 54.6% +6.9
+10.3%96.3 44.2% 106.3 45.1% +9.9121.6 55.8% 129.6 54.9% +8.0 +6.5%
7.8 3.6% 8.3 3.5% +0.5 +5.8%
4
37.4 17.2% 41.7 17.7% +4.3 +11.4%
(0.6) -0.3% 1.4 0.6% +2.0 -13.7 6.3% 14.9 6.3% +1.2 +8.6%
83.9 38.5% 94.5 40.1% +10.6 +12.6%
25.5 11.7% 28.2 12.0% +2.7 +10.5%
+6.5%
6
0.4 0.2% 0.4 0.2% +0.012.4 5.7% 11.7 5.0% -0.7 -5.3%
0.8 0.4% 1.0 0.4% +0.2 27.7%
0.8 0.4% 0.9 0.4% +0.1 13.6%
-56.9%1.5 0.7% 0.6 0.3% -0.9
-14.4%
4.1 1.9% 3.4 1.4% -0.7 -16.9%0.6 0.3% 0.4 0.2% -0.2 -32.3%
0.1% 0.2 0.1% +0.1 +37.0%
+85.7%0.1 0.1% 0.4% +0.8 +611.7%
8
0.0 0.0% 0.0 0.0% -0.0
0.0 0.0% 0.0 0.0%
0.5 0.2% - - -0.5
- - 0.0 0.0% +0.0
0.2% +0.5
0.7 0.3% 2.1 0.9% +1.4 +209.7%+0.0 93.5%
- - 0.5 0.2% +0.5 -
- - 0.5 -
5.5 2.5% 6.2 2.6% +0.7 +12.7%16.4 7.5% 18.6 7.9% +2.2 +13.4%
0.2 0.1% +0.1 211.8%
10.9 5.0% 12.4 5.2% +1.5 +13.8%
+0.1
6.6 3.0% (17.8) -7.6% -24.5 -
10.8 5.0% 12.2 5.2% +1.4 +12.9%
0.0 0.0%
5.8%
0.1
0.1 0.1% 0.2 0.1%
-2.3
1.0
0.9 0.4% 6.9 2.9% +5.9 +627.8%
0.4 0.2% 1.4 0.6% +1.0 +248.1%
0.9 0.4% 6.8 2.9% +5.9 +648.4%
-32.1%
16.1 7.4% 13.8
-
- - 0.5 0.2% +0.5 -
- - 0.4 0.2% +0.4 -
-100.0%
0.2 0.1% 0.1 0.0% -0.1 -33.7%
Consolidated Statements of Income
2

Bil. Yen
Amount Ratio Amount Ratio
Nissin FoodProducts
InstantNoodles +7.8 +3.6% +4.7 +2.1%
Myojo Foods InstantNoodles +2.4 +6.2% +1.3 +3.1%
Chilled and Frozen +3.2 +5.6% +0.7 +1.2%
+4.3 +12.5% +10.4 +27.0%
Domestic others*3,4 +0.6 +19.7% -0.4 -12.3%
+18.3 +5.3% +16.7 +4.5%
The Americas*5 InstantNoodles +12.5 +35.1% +11.7 +24.3%
ChinaMainlyInstant
Noodles+6.4 +18.5% +1.2 +3.0%
Asia*3,6 InstantNoodles -0.6 -8.0% +1.7 +23.7%
EMEA*3 InstantNoodles -0.1 -2.1% +0.6 +13.5%
+18.2 +22.0% +15.3 +15.1%
Group Total +36.5 +8.5% +31.9 +6.8%
Note: The revised full-year sales plan for each business segment is not for disclosure.
*1: Nissin Cisco, Nissin York, Bonchi*2: Bonchi Co., Ltd. has been consolidated and included in Confectionery and Beverage segment from the 1st quarter of FY2017.*3: These are included in "Other" in the "Segment Information" of Summary of Consolidated Financial Statements. *4: "Domestic others" includes NISSIN FOODS HOLDINGS and NISSIN ASSET MANAGEMENT, etc.*5: Brazil has been consolidated and included in the Americas segment from the 3rd quarter of FY2016.*6: Indonesia has been consolidated and included in the Asia segment from the 1st quarter of FY2017.
Quartely Sales by Segment Bil. Yen
1Q 2Q 3Q 4Q 1Q 2Q 3Q 4Q 1HNissin FoodProducts
InstantNoodles 48.5 53.2 65.9 56.0 51.8 53.4 105.2 +3.3 +6.8% +0.3 +0.5% +3.6 +3.5%
Myojo Foods InstantNoodles 9.9 10.1 11.4 10.2 10.0 10.1 20.1 +0.1 +1.2% -0.0 -0.4% +0.1 +0.4%
Chilled and Frozen 14.8 15.2 15.1 14.6 15.0 15.6 30.6 +0.2 +1.1% +0.4 +2.4% +0.5 +1.8%
10.0 9.8 9.1 9.6 13.1 13.2 26.3 +3.1 +30.9% +3.4 +34.2% +6.5 +32.5%
Domestic others*3,4 1.0 0.9 0.8 0.9 0.9 0.9 1.9 -0.0 -3.1% +0.1 +6.6% +0.0 +1.6%
84.2 89.2 102.4 91.3 90.8 93.2 184.0 +6.6 +7.9% +4.0 +4.5% +10.7 +6.1%
The Americas*5 InstantNoodles 8.0 10.0 14.9 15.3 12.8 14.8 27.6 +4.8 +59.5% +4.7 +46.9% +9.5 +52.5%
ChinaMainlyInstant
Noodles9.7 10.8 9.7 10.7 8.4 9.1 17.5 -1.3 -13.2% -1.8 -16.3% -3.0 -14.9%
Asia*3,6 InstantNoodles 1.9 1.8 1.4 2.0 2.3 2.2 4.5 +0.3 +18.1% +0.4 +20.6% +0.7 +19.3%
EMEA*3 InstantNoodles 1.2 1.0 1.1 1.2 1.2 1.1 2.3 +0.0 +3.9% +0.0 +3.0% +0.1 +3.4%
20.8 23.8 27.2 29.2 24.7 27.1 51.8 +3.9 +18.8% +3.3 +14.1% +7.2 +16.3%
Group Total 104.9 113.0 129.6 120.5 115.5 120.4 235.8 +10.5 +10.0% +7.4 +6.5% +17.9 +8.2%
*1: Nissin Cisco, Nissin York, Bonchi*2: Bonchi Co., Ltd. has been consolidated and included in Confectionery and Beverage segment from the 1st quarter of FY2017.*3: These are included in "Other" in the "Segment Information" of Summary of Consolidated Financial Statements. *4: "Domestic others" includes NISSIN FOODS HOLDINGS and NISSIN ASSET MANAGEMENT, etc.*5: Brazil has been consolidated and included in the Americas segment from the 3rd quarter of FY2016.*6: Indonesia has been consolidated and included in the Asia segment from the 1st quarter of FY2017.
39.2 41.6 42.9
Overseas Total
Yearly Sales by Segment
FY16 vs.FY15 FY2017(Initial Forecasts)
Business FY2015 FY2016
Overseas Total
431.6 468.1
4.7 4.66.0
73.7
417.6
2.7
53.5
382.8
82.8
3.0 3.5 3.1
215.8
Domestic Total
Confectinery andBeverage*1,2,3
Business
FY2016 FY20171Q 2Q
367.1
35.7 48.3 60.0
3Q
2.5
329.2
25.9
20.8
FY2014
210.9
39.6
54.8
36.1
2.6
343.9
32.2
29.9
Domestic Total
100.9
Initial vs.FY16
223.6 228.3
Confectinery andBeverage*1,2,3 34.3 38.6 49.0
1H
2017 VS. 2016(Amount,Ratio)
5.54.0
FY2013
200.8
39.3
52.6
34.0
4Q
500.0
42.1
7.8 7.2 8.9
34.5 40.9
5.2
116.2
56.6 59.8 60.5
383.8348.8
Yearly and Quarterly Sales by SegmentYearly and Quarterly Financial Results by Segment
3

2015年度
Yearly (Upper: Operating Income , Lower: Operating Income Margin) Bil. Yen
Amount Ratio Amount Ratio+0.3 +1.4% +2.7 +11.3%
-0.2% +1.0%-0.1 -3.6% +0.8 +54.7%
-0.3% +1.7%+0.9 - +0.6 +78.4%
+1.6% +0.9%-0.0 -1.3% +1.4 +108.2%
-0.5% +2.1%-0.1 - +1.5 -
-3.0% +49.2%
+1.1 +4.0% +7.0 +25.7%
-0.1% +1.5%+0.4 +60.1% +1.3 +120.0%
+0.3% +1.7%+0.9 +26.4% -0.6 -15.6%
+0.6% -1.8%+0.2 - +0.4 -
+0.3% +9.5%-0.2 - +0.4 -
-5.4% +9.2%+1.2 +76.0% +1.4 +50.4%
0.9% +0.9%
-0.6 - -1.0 -
-0.2 - -0.6 -1.5 +6.3% +6.9 +27.9%
-0.1% +1.0%+0.6 +58.1% -6.3 -+2.1 +8.6% +0.6 +2.3%
+0.0% -0.2%
Note: The breakdown of the revised full-year consolidated OP plan of +0.8 bil. yen is +1.0 billion yen at Nissin Food Products segment and -0.2 bil. yen at Domestic others segment.
*1: Nissin Cisco,Nissin York, Bonchi*2: Bonchi Co., Ltd. has been consolidated and included in Confectionery and drink segment from the 1st quarter of FY2017.*3: These are included in "Other" in the "Segment Information" of Summary of Consolidated Financial Statements. *4: "Domestic others" includes NISSIN FOODS HOLDINGS and NISSIN ASSET MANAGEMENT, etc.*5: These are included in "Reconcilliations" in Summary of Consolidated Financial Statements.*6: Brazil has been consolidated and included in the Americas segment from the 3rd quarter of FY2016.*7: Indonesia has been consolidated and included in the Asia segment from the 1st quarter of FY2017.*8: Adjusted Operating income = Operating Income - Impact from retirement benefit accounting
Quartely Operating Income by Segment Bil. Yen
1Q 2Q 3Q 4Q 1Q 2Q 3Q 4Q 1HNissin FoodProducts
InstantNoodles 4.6 5.8 9.6 4.0 6.1 4.6 10.8 +1.6 +34.9% -1.2 -20.0% +0.4 +4.3%
Myojo Foods InstantNoodles 0.8 0.3 0.5 (0.2) 0.4 0.3 0.7 -0.4 -51.8% -0.0 -1.0% -0.4 -37.1%
0.3 0.1 0.3 0.0 0.6 0.5 1.1 +0.3 +129.5% +0.3 235.9% +0.7 +167.4%
0.5 0.3 0.3 0.2 1.0 0.7 1.7 +0.5 +118.3% +0.5 177.8% +1.0 +139.9%
(0.0) 0.1 0.0 (0.3) 0.3 0.6 0.9 +0.3 - +0.6 583.9% +0.9 +1,302.5%
6.1 6.6 10.7 3.8 8.4 6.8 15.2 +2.4 +38.7% +0.2 3.1% +2.6 +20.2%
The Americas*6 InstantNoodles (0.2) 0.4 0.0 0.8 0.6 0.1 0.7 +0.8 - -0.3 -75.2% +0.5 +241.2%
ChinaMainlyInstant
Noodles0.9 1.0 0.8 1.5 0.8 1.0 1.8 -0.1 -9.5% +0.0 4.2% -0.0 -2.1%
Asia*3,7 InstantNoodles (0.4) (0.5) (0.6) (0.5) (0.2) (0.3) (0.5) +0.2 - +0.2 - +0.4 -
EMEA*3 InstantNoodles (0.0) (0.1) (0.0) (0.2) 0.1 0.0 0.1 +0.1 - +0.1 - +0.2 -
0.2 0.8 0.2 1.6 1.3 0.9 2.2 +1.1 +588.0% +0.1 +7.8% +1.2 +111.7%
(0.1) (0.1) (0.5) (0.5) (0.6) (0.5) (1.1) -0.5 - -0.5 - -1.0 -
(1.0) (1.0) (1.0) (1.0) (1.2) (1.2) (2.3) -0.1 - -0.1 - -0.3 -
5.1 6.3 9.4 3.8 7.9 6.0 13.9 +2.8 +54.2% -0.3 -5.2% +2.5 +21.5%
0.5 0.5 0.5 0.3 (1.1) (1.1) (2.2) -1.6 - -1.6 - -3.1 -Group Total 5.6 6.8 9.9 4.1 6.8 4.9 11.7 +1.2 +21.8% -1.9 -27.7% -0.7 -5.3%
*1: Nissin Cisco, Nissin York, Bonchi*2: Bonchi Co., Ltd. has been consolidated and included in Confectionery and drink segment from the 1st quarter of FY2017.*3: These are included in "Other" in the "Segment Information" of Summary of Consolidated Financial Statements. *4: "Domestic others" includes NISSIN FOODS HOLDINGS and NISSIN ASSET MANAGEMENT, etc.*5: These are included in "Reconcilliations" in Summary of Consolidated Financial Statements.*6: Brazil has been consolidated and included in the Americas segment from the 3rd quarter of FY2016.*7: Indonesia has been consolidated and included in the Asia segment from the 1st quarter of FY2017.*8: Adjusted Operating income = Operating Income - Impact from retirement benefit accounting
Adjusted Operating income*8
Chilled and FrozenConfectionery andBeverage*1,2,3
Overseas Total
3Q 4QFY2017 VS. FY2016(Amount,Ratio)
1HBusiness
FY2016 FY2017
Retirement benefitaccounting*5
Adjusted Operating income*8
Retirement benefit accounting*5 (4.5)
23.2 24.7 31.55.4% 5.3% 6.3%
Amortization of goodwill andelimination of intersegment
transactions*5
Group expenses*5
Domestic Total
6.5%0.7
27.76.6%
Group Total
Domestic others*3,4
1Q 2Q
3.7%
(2.2)
1.6 2.81.9% 2.8%
5.4%6.3%
27.0(4.7)
27.0
FY2016FY16 vs.FY15
1.4
5.6% 5.6%
(0.6) (1.2)
(3.9) (4.1)
1.2%
7.5% 7.4%
FY17 vs.FY16
26.711.7%
2.15.0%1.3
2.1%2.7
(1.6)
1.443.7%34.18.9%2.3
3.9%3.5
8.3%
FY2017Forecasts
-18.4%0.1
1.2%4.3
Business FY2015FY2013 FY2014
5.5%
Nissin FoodProducts
InstantNoodles
23.6 24.011.0% 10.7%
(0.2) 0.7
23.811.9%
25.712.2%
-0.4%
Myojo Foods InstantNoodles
1.43.6% 3.3%
Chilled and Frozen
1.74.4%0.8
1.6%
2.05.0%0.5
0.9%Confectionery andBeverage*1,2,3
1.3 1.33.8% 3.4%
26.1 27.2
0.61.7%
1.23.3%
Domestic others*3,4 (0.1) (0.2)-2.5% -5.5%
Domestic Total
(0.2)-8.5%26.78.1%
0.01.8%29.38.5%
The Americas*6 InstantNoodles
0.7 1.11.9% 2.2%
ChinaMainlyInstant
Noodles
3.3 4.19.5% 10.1%
0.20.9%1.8
8.8%
0.51.7%2.8
9.5%
Asia*3,7 InstantNoodles
(2.2) (2.0)-28.2% -27.9%
EMEA*3 InstantNoodles
(0.1) (0.4)-2.7% -8.0%
(0.5)-11.3%
0.27.2%
(1.6)-28.3%(0.2)
-3.8%
Overseas Total
26.41.1 1.7
24.3
Amortization of goodwill andelimination of intersegment
transactions*5
1.83.4%
(1.0)
(3.0)24.56.4%(0.5)24.0
1.62.2%
(0.6)
(3.3)Group expenses*5
4

1. Accounting Period
March-end Fiscal Year March-end Fiscal YearNissin Food Products,Myojo Foods,Nissin Chilled Foods,
Nissin Frozen Foods,Nissin Cisco,Nissin York,Domestic others includes Nissin Foods Holdings and Nissin Asset Management
the U.S., Mexico, BrazilHong Kong, Mainland China(Changed to March-end FY from FY2016)India (Only India within Asia area changed to March-end FY from FY2017 )
December-end Fiscal Year December-end Fiscal YearBonchi (Individual fiscal term of Bonchi ends in June)
Colombia,Singapore,Vietnam,Thailand,IndonesiaEurope (Headquartered in Germany),Turkey
2. Main New Consolidated Companies (From FY2016)
From FY2016 1Q Zhejiang Nissin Foods(Mainland China)From FY2016 3Q BrazilFrom FY2017 1Q Bonchi, Indonesia
3. Main Change of Investment Ratio (From FY2016)*1
Strategic alliance with Mitsubishi Corp.Investment ratio decreased from 100% to 66% on November 17, 2015
SingaporeInvestment ratio decrease from 100% to 66% on December 3, 2015
ThailandInvestment ratio decrease from 100% to 66% on April 1, 2016
IndonesiaInvestment ratio decrease from 100% to 66% on May 27, 2016
India*1: Excluding companies noted in the table 4 below.
4. Quarterly Results of Associates Accounted for by the Equity Method Bil. Yen
Frente Co., Ltd.*1
Bonchi Co., Ltd.*2
BNA*3
Thai President*4
NURC*5
Mareven*6
*1 : Our stake increased from 33.41% to 34.53% in conjunction with additional acquisition executed on Aug. 25, 2015Frente Co., Ltd changed its name to Koikeya Co., Ltd. from Oct. 1, 2016
*2 : Our stake increased from 30% to 50.1% and is to be a consolidated subsidiary from Apr. 2016*3 : NISSIN-AJINOMOTO ALIMENTOS LTDA. (It became a consolidated subsidiary from 3Q of FY2016 and renamed NISSIN FOODS DO BRASIL LTDA. )
*4 : THAI PRESIDENT FOODS PUBLIC COMPANY LIMITED*5 : NISSIN-UNIVERSAL ROBINA CORP. (Became our equity method affiliate from 1Q of FY2016)*6: MAREVEN FOOD HOLDINGS LIMITED*7: The column of "Ratio of Shareholdings" shows the ratio before consolidation for current consolidated companies,
and the ratio at the end of March 2016 for current associates accounted for by the equity method
3Q 4Q
Jan-Mar Apr-Jun Jul-Sep Oct-Dec
1Q 2Q 3Q 4Q
Apr-Jun Jul-Sep Oct-Dec Jan-Mar
FY2017
1Q 2Q 3Q 4Q FY 1Q
1Q 2Q
Japan 34.53% (0.0) 0.0 (0.1) 0.1
CountryRatio ofShare-
holding*7
FY2016
0.1 0.0 (0.0) (0.0)2Q 3Q 4Q FY
0.2Japan 30.00% 0.0 0.0 0.0 0.00.4Brazil 50.00% 0.2 0.21.3 0.3 0.3 0.6Thailand 21.13% 0.2 0.3 0.4 0.30.3 0.1 0.1 0.2Philippines 49.00% 0.1 0.0 0.1 0.10.6 (0.0) (0.1) (0.2)Russia 33.50% 0.1 0.2 0.4 (0.1)
0.6 0.9 0.7 0.5Total 0.4 0.3 0.62.8
Consolidated Accounting Period
5

1.Changes in Operating Income (Quarterly) Bil. Yen
1st Quarter (3 Months)
6.1 +1.7 +0.8 -0.8 -0.1 +0.4 +0.7 -0.3 - +2.4 8.40.2 +0.7 +0.7 +0.0 +0.2 -0.1 +0.0 -0.5 - +1.1 1.3(0.7) +0.1 -0.3 +0.2 -0.0 -0.1 - -0.5 -1.6 -2.2 (2.9)5.6 +2.5 +1.1 -0.6 +0.1 +0.3 +0.7 -1.3 -1.6 +1.2 6.8
2nd Quarter (3 Months)
6.6 +1.0 +0.7 -0.8 -0.2 +0.5 -0.5 -0.3 - +0.2 6.80.8 +0.7 +0.4 +0.0 +0.1 -0.1 -0.6 -0.5 - +0.1 0.9(0.6) +0.1 -0.2 +0.2 -0.0 -0.1 - -0.5 -1.6 -2.1 (2.8)6.8 +1.7 +0.8 -0.6 -0.1 +0.3 -1.1 -1.3 -1.6 -1.9 4.9
3rd Quarter (3 Months)
4th Quarter (3 Months)
Accumulated 6 Months
12.7 +2.6 +1.5 -1.6 -0.3 +0.9 +0.2 -0.6 - +2.6 15.21.0 +1.4 +1.1 +0.1 +0.3 -0.1 -0.6 -0.9 - +1.2 2.2
(1.3) +0.2 -0.6 +0.4 -0.0 -0.2 - -1.0 -3.1 -4.4 (5.7)12.4 +4.2 +2.0 -1.2 -0.0 +0.6 -0.5 -2.6 -3.1 -0.7 11.7
2. Changes in Operating Income FY2017 (Forecasts) Bil. Yen
27.2 +4.9 +1.5 +0.7 -0.0 +2.0 +0.5 -2.6 - +7.0 34.12.8 +3.6 +2.2 -1.6 +0.6 -0.6 -0.9 -1.9 - +1.4 4.3(3.6) +0.5 -1.6 +1.0 -0.0 -0.2 - -1.1 -6.3 -7.8 (11.4)26.4 +8.9 +2.0 +0.2 +0.6 +1.2 -0.4 -5.6 -6.3 +0.6 27.0
*1: Since this analysis is based on the ratio-to-sales comparison with the same period of the previous year, the sum of "Changes in variable cost" of each segment is not necessarily equal to Domestic subtotal, Overseas subtotal nor Grand Total. *2: Refer to “Impact from the change in depreciation method” in page 8.*3: Since the details of the revised plan is not for disclosure, the initial plan is presented in this table.
FY2017Operating
Income(InitialPlan)*3
Overseas Total
Reconciliations
*1 Total
Changesin
OperatingIncome
Impact fromSales
Increase/Decrease
Impact fromChange of
Cost ofgoods sold
ratio
Impact fromChange of
Promotionalexpenses
ratio
Impact fromChange ofDistributionexpenses
ratio
Domestic Total
Domestic Total
Overseas Total
Reconciliations
*1 Total
Domestic Total
Domestic Total
Overseas Total
Reconciliations
*1 Total
Retirementbenefit
Accounting
Changes in Fixed Cost
Overseas Total
Depreciationand
Amortization*2
Advertisingexpenses
General andadministrative
expenses
Reconciliations
*1 Total
FY2016Operating
Income
Changes in Variable Cost
*1 Total
Domestic Total
Overseas Total
Reconciliations
*1 Total
Domestic Total
Overseas Total
Reconciliations
FY2017Operating
Income
Impact fromSales
Increase/Decrease
Impact fromChange of
Cost ofgoods sold
ratio
Impact fromChange of
Promotionalexpenses
ratio
Impact fromChange ofDistributionexpenses
ratio
Depreciationand
Amortization*2
Advertisingexpenses
General andadministrative
expenses
Retirementbenefit
Accounting
FY2016Operating
Income
Changes in Variable Cost Changes in Fixed CostChanges
inOperating
Income
Changes in Operating Income
6

1. Exchange Rates(1H) Yen
Each rate is an average rate calculated based on daily rates for the period.
Consolidated Subsidiaries
-13.6%
-25.5%
-26.2%
-16.0%
-13.6%
-18.0%
-9.2%
-17.6%
-13.7%
-10.4%
-
-7.1%
-18.7%
Associates Accounted for by the Equity Method
Asia -11.8%
EMEA -23.8%
*1: Minus sign indicates weak yen and plus sign indicates strong yen.
2. Results of Overseas Businesses excluding Foreign Exchange Impact (1H) Bil. Yen
・FY2017 1H Actual (1) = FY2017 1H local currency results multiplied by the average FX rates of FY2016 1H. As for subsidiaries newly-consolidated, the average FX rates for FY2017 1H are applied. FY2017 1H Actual (2) (for public disclosure)= FY2017 1H local currency results multiplied by the average FX rates of FY2017 1H.
42.90
10.28
12.63
63.10
1.55
2.56
103.45
3.21
0.00457
76.86
1.76
13.57
15.94
2.2 +1.2 +111.7%
0.05
124.62
0.00835
0.00500
3.153.65
0.00558
89.08
Total OP 1.0 2.5 +1.4 +137.6% -0.3
EMEA (0.1) 0.1 +0.2 - 0.0 0.1 +0.2 -
Asia (0.9) (0.5) +0.4 - 0.1 (0.5) +0.4 -
China 1.9 2.2 +0.3 +17.1% -0.4 1.8 -0.0 -2.1%
The Americas 0.2 0.8 +0.5 +248.2% 0.0 0.7 +0.5 +241.2%
Total Sales 44.6 58.8 +14.3 +32.0% -7.0 51.8 +7.2 +16.3%
EMEA 2.2 2.5 +0.3 +12.3% -0.2 2.3 +0.1 +3.4%
Asia 3.8 5.2 +1.4 +36.7% -0.7 4.5 +0.7 +19.3%
China 20.5 20.8 +0.3 +1.5% -3.4 17.5 -3.0 -14.9%
Amount Ratio Amount Ratio
The Americas 18.1 30.4 +12.3 +68.0% -2.8 27.6 +9.5 +52.5%
EMEAEurope EUR
Turkey TRY
Russia RUB 2.10
FY20161H
Actual
FY20171H
Actual (1)
FY17 1H VS. FY16 1HFX
Impact
FY20171H
Actual(2)
FY17 1H VS. FY16 1H
3.08 2.932.62
125.50
52.75
2.40
1.60
47.06
134.17
Philippines PHP 2.72
38.25
140.43
47.42
47.06
12.32
15.34
1.59
80.89
45.76
13.21
16.65
81.28
1.70
3.15
0.00485
1.93
15.71
19.44
FY17 1HVS.
FY16 1H*1
121.80
Asia
Indonesia IDR
ChinaHong Kong HKD
China CNY
Vietnam VND
India INR
Singapore SGD
Thailand THB
37.10
7.697.62 7.90
105.29
MXN 6.03Mexico
Country Currency FY20131H
FY20141H
FY20151H
FY20161H
the U.S. USD 79.74 95.59 103.04
TheAmericas Colombia COP
Brazil BRL
FY20171H
5.73
0.04
31.18
Exchange Rates
7
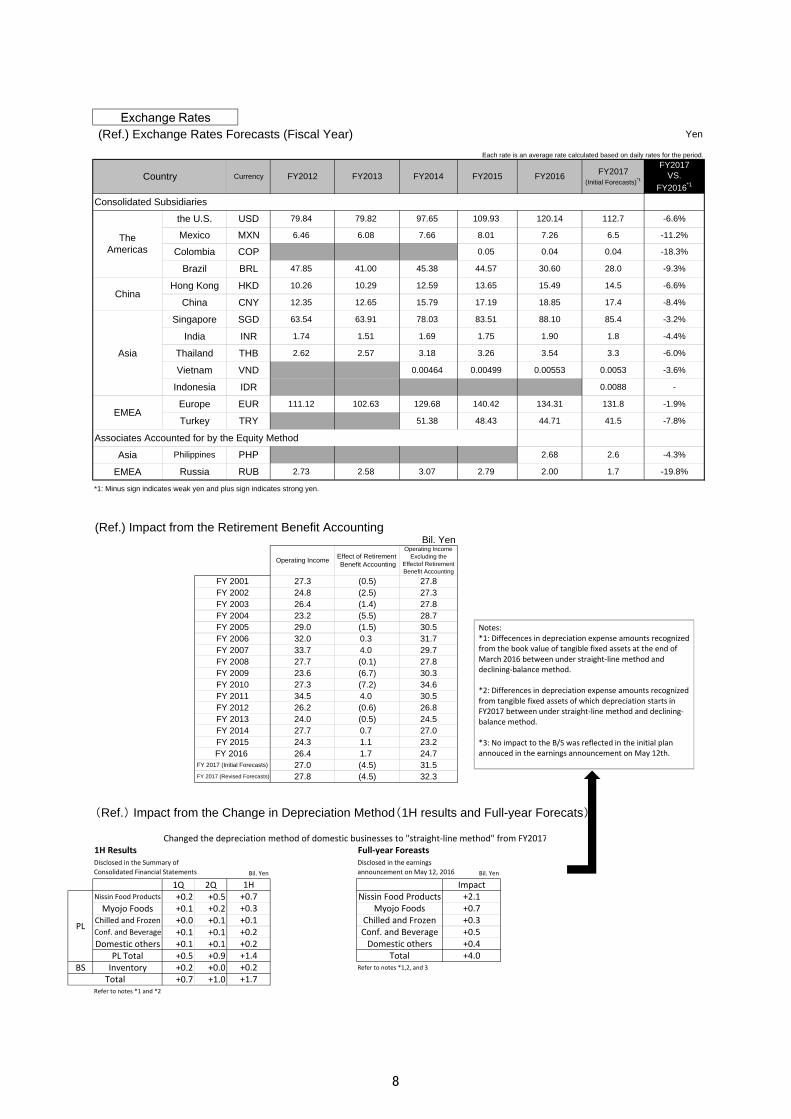
(Ref.) Exchange Rates Forecasts (Fiscal Year) Yen
Each rate is an average rate calculated based on daily rates for the period.
Consolidated Subsidiaries
Associates Accounted for by the Equity Method
Asia
EMEA*1: Minus sign indicates weak yen and plus sign indicates strong yen.
(Ref.) Impact from the Retirement Benefit AccountingBil. Yen
(Ref.) Impact from the Change in Depreciation Method(1H results and Full-year Forecats)
Changed the depreciation method of domestic businesses to "straight‐line method" from FY20171H Results Full‐year Foreasts
Bil. Yen Bil. Yen
1Q 2QNissin Food Products +0.2 +0.5Myojo Foods +0.1 +0.2
Chilled and Frozen +0.0 +0.1Conf. and Beverage +0.1 +0.1Domestic others +0.1 +0.1
PL Total +0.5 +0.9BS Inventory +0.2 +0.0 Refer to notes *1,2, and 3
+0.7 +1.0Refer to notes *1 and *2
+2.1
+4.0
Impact
FY2017VS.
FY2016*1
-6.6%
-11.2%
-18.3%
-9.3%
-6.6%
-8.4%
-3.6%
-
Disclosed in the earnings
announcement on May 12, 2016
(4.5) 31.5
FY2017(Initial Forecasts)*1
2.79 2.00
0.00464 0.00499
2.57
1.51
63.91
FY 2014 27.7 0.7 27.0FY 2015 24.3 1.1 23.2FY 2016 26.4 1.7 24.7
TheAmericas
45.38 44.57 30.60
China
6.08
83.51
Indonesia
10.26
12.35
63.54
1.74
2.62
FY2016FY2012
79.84
41.00
EMEAEurope EUR 129.68
12.65
Hong Kong HKD
Vietnam
Country Currency FY2013 FY2014 FY2015
Thailand
6.46
47.85
Asia
Singapore SGD
140.42
Turkey TRY 51.38 48.43
111.12
2.73 2.58
102.63
-4.3%Philippines PHP 2.68
Russia -19.8%RUB 3.07
2.6
1.7
44.71
134.31 -1.9%
-7.8%41.5
131.8
IDR 0.0088
0.0053
1.8 -4.4%
0.00553
-6.0%THB 3.18 3.26 3.54
VND
India INR 1.69 1.75 1.90
88.10 85.4 -3.2%78.03
China CNY 15.79 17.19 18.85
13.65 15.4912.59
17.4
14.510.29
Brazil BRL
Colombia COP 0.05 0.04 0.04
28.0
Mexico MXN 7.66 8.01
the U.S. USD 79.82 97.65 109.93 120.14
7.26
112.7
6.5
+0.2+1.4+0.2+1.7
FY 2012 26.2 (0.6) 26.8
3.3
FY 2001 27.3 (0.5) 27.8
Operating Income Effect of Retirement Benefit Accounting
Operating IncomeExcluding the
Effectof RetirementBenefit Accounting
Total
FY 2013 24.0 (0.5) 24.5
FY 2017 (Initial Forecasts) 27.0
FY 2011 34.5 4.0 30.5
Total
Disclosed in the Summary of
Consolidated Financial Statements
PL
Nissin Food ProductsMyojo Foods
Domestic others
Chilled and FrozenConf. and Beverage
+0.7+0.3+0.5+0.4
1H+0.7+0.3+0.1+0.2
FY 2017 (Revised Forecasts)
FY 2008 27.7 (0.1) 27.8FY 2009 23.6 (6.7) 30.3FY 2010 27.3 (7.2) 34.6
27.8 (4.5) 32.3
23.2 (5.5) 28.7
27.3
33.7 4.0 29.7
29.0 (1.5) 30.5FY 2006 32.0 0.3 31.7FY 2007
FY 2002 24.8 (2.5)FY 2003 26.4 (1.4) 27.8FY 2004FY 2005
Exchange Rates
Notes: *1: Diffecences in depreciation expense amounts recognized from the book value of tangible fixed assets at the end of March 2016 between under straight‐line method and declining‐balance method.
*2: Differences in depreciation expense amounts recognized from tangible fixed assets of which depreciation starts in FY2017 between under straight‐line method and declining‐balance method.
*3: No impact to the B/S was reflected in the initial plan annouced in the earnings announcement on May 12th.
8

Bil. YenFY2015
4Q 1Q 2Q 3Q 4Q 1Q 2Q 3Q 4Q
Cash and deposits 94.4 110.2 87.6 89.1 87.1 65.4 58.6 -28.5 Acquisition of investments in securities
Notes and accounts receivable-trade 54.5 49.8 55.7 68.4 61.4 53.5 60.4 -1.0
Marketable securities 19.2 3.9 18.4 3.5 3.8 3.8 4.3 +0.5
Merchandise and finished goods 12.0 13.7 12.7 13.2 12.4 14.9 13.8 +1.4
Raw materials and supplies 11.1 12.2 12.3 14.1 14.7 14.2 15.0 +0.3
Others 10.9 12.3 11.7 20.9 11.8 14.0 13.6 +1.8
Less:Allowance for doubtful receivables (0.4) (0.4) (0.4) (0.3) (0.3) (0.3) (0.3) +0.0
Total current assets 201.5 201.6 197.9 208.9 190.9 165.6 165.4 -25.5
Tangible fixed assets 147.2 150.1 155.5 162.6 168.9 170.2 174.3 +5.4
Intangible fixed assets 8.2 8.3 7.9 41.9 42.3 42.4 40.8 -1.5
Investments and other assets 155.8 157.7 155.3 161.9 151.0 153.2 127.3 -23.6 Sales and mark-to-market valuation ofinvestments in securities
Total fixed assets 311.2 316.1 318.7 366.4 362.1 365.9 342.4 -19.7
Total assets 512.7 517.7 516.6 575.3 553.1 531.5 507.8 -45.2
Liabilities
Notes and accounts payable-trade 44.9 45.7 46.1 57.2 51.3 48.9 48.4 -2.9
Short-term borrowings 3.9 3.2 3.1 33.4 18.5 18.6 3.1 -15.4 Repayment of short-term borrowings
Accrued payables 27.1 25.9 27.3 31.9 31.3 28.8 29.8 -1.5
Accrued income tax 5.2 3.9 6.2 7.4 7.3 4.2 6.9 -0.4
Others 22.0 18.6 18.4 21.3 22.5 21.5 22.7 +0.2
Total current liabilities 103.0 97.3 101.2 151.1 130.9 122.0 110.8 -20.1
Long-term debt 9.5 12.8 12.2 12.9 13.0 15.9 15.2 +2.2 Increase of borrowings in subsidiaries
Net defined benefit liability 3.4 3.1 3.0 2.8 8.0 7.8 7.7 -0.3
Others 27.0 27.8 25.8 32.3 29.5 26.6 22.6 -6.9
Total long-term liabilities 39.9 43.7 41.0 47.9 50.5 50.4 45.5 -5.0
Total liabilities 142.9 141.0 142.2 199.0 181.4 172.4 156.3 -25.1
Equity
Common stock 25.1 25.1 25.1 25.1 25.1 25.1 25.1 -
Capital surplus 48.4 48.4 48.4 48.4 48.2 49.4 49.6 +1.4
Retained earnings 273.3 276.1 281.4 289.9 293.8 292.0 301.2 +7.4
Treasury stock, at cost (21.7) (21.7) (21.7) (35.8) (35.8) (35.8) (35.3) +0.6
Total shareholders' equity 325.2 327.9 333.3 327.6 331.3 330.7 340.6 +9.4 Unrealized gain on available-for-sale securities 35.1 37.5 33.4 47.1 43.2 35.6 22.6 -20.5 Mark-to-market valuation of securities
Deferred gain (loss) on derivatives under hedge accounting 0.1 0.1 0.0 (0.0) (0.3) (0.5) (0.3) -0.0
Land valuation reserve (5.7) (5.7) (5.7) (6.4) (6.4) (6.4) (6.4) -0.0
Foreign curreny translation adjustments 6.0 7.3 4.3 (0.8) (4.6) (10.3) (15.4) -10.9 Foreign exchange fluctuation
Accumulated adjustments ofretirement benefit plans 1.2 0.9 0.6 0.3 (3.2) (2.3) (1.7) +1.5
Total accumulated othercomprehensive income
36.6 40.1 32.5 40.2 28.8 16.1 (1.1) -29.9
Stock acquisition rights 1.5 1.9 1.9 1.9 1.9 2.1 1.6 -0.2
Non-controlling interests 6.6 6.8 6.8 6.5 9.8 10.2 10.4 +0.6
Total equity 369.9 376.7 374.4 376.3 371.7 359.1 351.5 -20.2
Total liabilities and equity 512.7 517.7 516.6 575.3 553.1 531.5 507.8 -45.2
Main Reasons of the differencesbetween
FY17 2Q and FY16 4Q
Assets
FY 2016 FY 2017 FY17 2QVS
FY16 4Q
Balance Sheet(Quarterly)
9

1. Consolidated Income Statement (Quarterly) Bil. Yen
FY 2015
FY 1Q 2Q 3Q 4Q FY 1Q 2Q 3Q 4Q 1H
Net Sales 431.6 104.9 113.0 129.6 120.5 468.1 115.5 120.4 235.8
Gross profit 188.7 46.5 49.9 59.0 52.3 207.6 52.2 54.0 106.3
Operating income 24.3 5.6 6.8 9.9 4.1 26.4 6.8 4.9 11.7
Ordinary income 33.0 8.3 7.7 11.5 3.1 30.7 7.1 6.7 13.8
Income before income taxes 29.0 8.6 7.8 15.9 4.6 37.0 6.7 11.9 18.6
Net income 18.7 5.4 5.4 12.3 3.8 26.9 3.1 9.3 12.4
Net income attributable toowners of parent 18.5 5.4 5.4 12.2 3.9 26.9 3.0 9.2 12.2
2. Consolidated Cash Flows (Quarterly) Bil. Yen
FY 2015
FY 1Q 2Q 3Q 4Q FY 1Q 2Q 3Q 4Q 1HCash flows from operating activities 30.4 5.4 8.6 14.3 7.8 36.2 4.1 6.4 10.4Cash flows from investing activities (4.8) (2.7) (11.4) (39.6) 8.0 (45.8) (24.2) 4.1 (20.2)Cash flows from financing activities (8.0) (1.2) (0.5) 12.3 (13.7) (3.0) 0.2 (15.3) (15.1)Effect of exchange rate changeson cash and cash equivalents 5.1 0.6 (1.7) (0.7) (3.0) (4.9) (3.2) (2.3) (5.5)
Net increase (decrease)in cash and cash equivalents 22.6 2.0 (4.9) (13.7) (0.8) (17.5) (23.1) (7.2) (30.3)
Cash and cash equivalents at beginning of quarters 80.2 105.9 108.1 103.1 89.5 105.9 88.7 65.8 88.7
Increase in cash and cashequivalents arising from initialconsolidation of subsidiaries
2.6 - - 0.1 - 0.1 0.2 - 0.2
Increase in cash and cashequivalents arising from changein accounting period ofconsolidated subsidiaries
0.6 0.1 - - - 0.1 0.0 - 0.0
Cash and cash equivalentsat end of quarters 105.9 108.1 103.1 89.5 88.7 88.7 65.8 58.6 58.6
FY 2016 FY 2017
FY 2016 FY 2017
Consolidated Statements of Income and Consolidated Cash Flow(Quarterly)
10

1. Nissin Foods Group Philosophy "EARTH FOOD CREATOR"
2. Embodiment of the "EARTH FOOD CREATOR" Concept
3. KPIs and Targets of the new Medium-Term Business Plan
¥Bil. ¥Bil. ¥Bil.
¥Bil. ¥Bil. ¥Bil.
¥Bil. 1 ¥Tri.
¥Bil. ¥Bil.
%
*1: Adjusted Operating income= Operating income-Impact from retirement benefit accounting*2: Market capitalization=Share price at year-end×Number of shares outstanding(excluding treasury stocks)
*3: Net income attributable to owners of parent based on Japanese GAAP Net income for the year attributable to owners of the parent based on IFRS*4: Adjusted EPS=Adjusted NOPAT*5 / Average number of shares outstanding (excluding treasury stocks)
4. Financial Policies
Five-year Investment Budget
Policy on Shareholder Returns
5. Strategy to Achieve Targets
468.1 600.0 550.0
24.7
570.0
Earning powercentered on core
businesses 40.0 47.5
Capex: 150.0 billion yen, Business investment: 100.0 billion yen
Payout ratio: 40% or above on the average for the five-year period
Net salesAdjusted Operating income*1
Market Capitalization*2
Net income*3
*5: Adjusted NOPAT=Adjusted Operating income after tax + Equity earnings of affiliate companies + Amortization of goodwill (Including those contained in the equity method subsidiaries) - Net income attributable to non-controlling interests
Promoting Global Branding: Accelerate the expansion of high value-added CUP NOODLES worldwide with the aim ofimproving profitability outside Japan.
Focusing on Priority Locations: Allocate management resources to BRICs (China, India, Brazil and Russia) asprioritized areas and realize profit growth.
Laying Stronger Foundations for our Domestic Profit Base: Realize sustainable stable profits through the cultivation ofdomestic instant noodles market and the investment in sophisticating plants for higher safety and less workers.
Establish a second Primary Revenue Source: Confectionery and cereal business targets to achieve 100.0 billion yen.Profit growth of domestic businesses contributed by Chilled and Frozen business.
Developing and Strengthening Human Resources for Global Management:Accelerate global management through theincrease of managerial talent by fostering human resource and employing external talents like the two wheels of acart.
26.9
More than 8% ROE
Adjusted EPS*4
Corporate value inthe capital market
33.0
7.4
¥196 → CAGR: More than 10% → ¥330
New Medium-Term Business Plan 2021 (Announced in May 2016) Digest 1
Contribute to society and the planet by gratifying people everywhere with pleasures anddelights food can provide.
FY2016 (March 2016) FY2021 (March 2021)
Pursue global status. Gain a strong global reputation. Embody the "EARTH FOOD CREATOR"
FY2026 (March 2026)
Overseas sales ratio: 22 %(Actual)Overseas Operating income ratio: 11% (Actual)
Overseas Operating income ratio: More than 30%
ROE: 7.4% (Actual) ROE: More than 8%
Market Capitalization:¥1 Tri.Market Capitalization:570.0 ¥Bil. (Actual)
Overseas Operating income ratio: More than 50%
ROE: More than 10%
Theme KPI Japnanese GAAP Japanese GAAP IFRS
FY2016
Actual (Ref.) Targets
FY2021
11
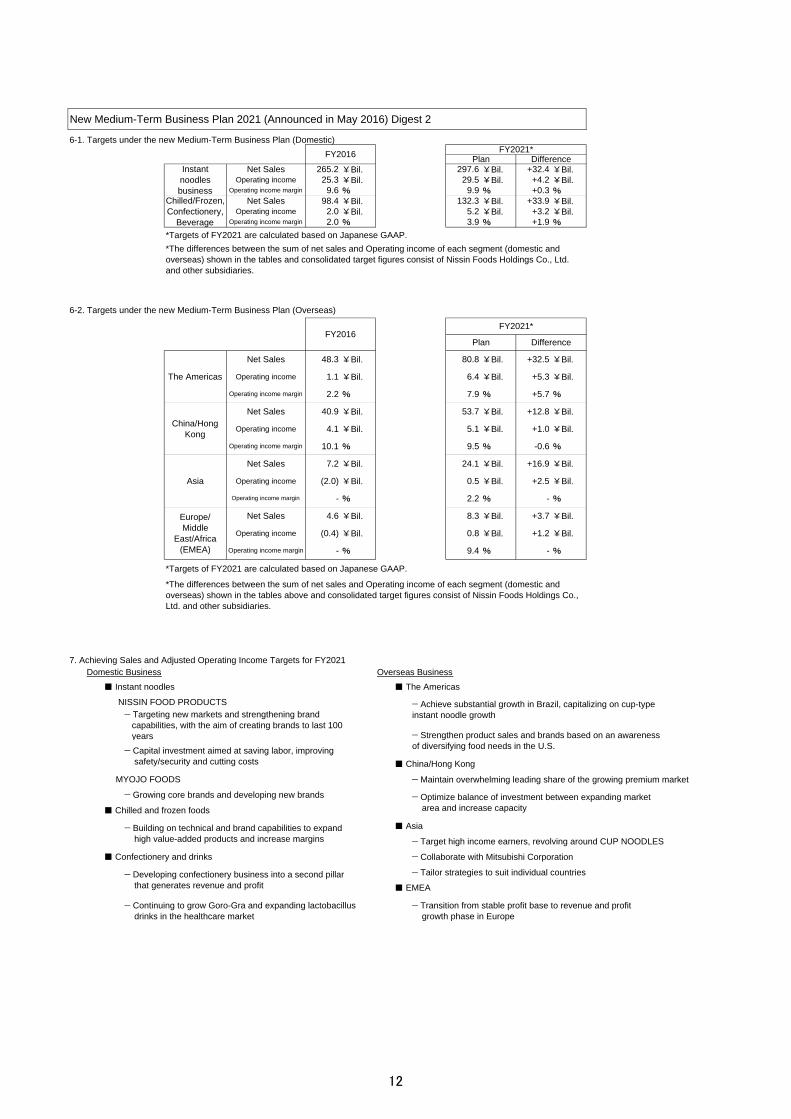
New Medium-Term Business Plan 2021 (Announced in May 2016) Digest 2
6-1. Targets under the new Medium-Term Business Plan (Domestic)
¥Bil. ¥Bil. ¥Bil.¥Bil. ¥Bil. ¥Bil.% % %¥Bil. ¥Bil. ¥Bil.¥Bil. ¥Bil. ¥Bil.% % %
*Targets of FY2021 are calculated based on Japanese GAAP.
6-2. Targets under the new Medium-Term Business Plan (Overseas)
¥Bil. ¥Bil. ¥Bil.
¥Bil. ¥Bil. ¥Bil.
% % %
¥Bil. ¥Bil. ¥Bil.
¥Bil. ¥Bil. ¥Bil.
% % %
¥Bil. ¥Bil. ¥Bil.
¥Bil. ¥Bil. ¥Bil.
% % %
¥Bil. ¥Bil. ¥Bil.
¥Bil. ¥Bil. ¥Bil.
% % %
*Targets of FY2021 are calculated based on Japanese GAAP.
7. Achieving Sales and Adjusted Operating Income Targets for FY2021
NISSIN FOOD PRODUCTS
− Maintain overwhelming leading share of the growing premium market
■ Asia
− Target high income earners, revolving around CUP NOODLES
− Collaborate with Mitsubishi Corporation
− Tailor strategies to suit individual countries
Domestic Business Overseas Business
− Targeting new markets and strengthening brand capabilities, with the aim of creating brands to last 100 years
− Achieve substantial growth in Brazil, capitalizing on cup-typeinstant noodle growth
− Strengthen product sales and brands based on an awarenessof diversifying food needs in the U.S.
− Capital investment aimed at saving labor, improving safety/security and cutting costs
− Optimize balance of investment between expanding market area and increase capacity
− Transition from stable profit base to revenue and profit growth phase in Europe
■ EMEA
■ The Americas
■ China/Hong Kong
− Growing core brands and developing new brands
■ Chilled and frozen foods
■ Confectionery and drinks
− Building on technical and brand capabilities to expand high value-added products and increase margins
■ Instant noodles
MYOJO FOODS
− Developing confectionery business into a second pillar that generates revenue and profit
− Continuing to grow Goro-Gra and expanding lactobacillus drinks in the healthcare market
Europe/Middle
East/Africa(EMEA)
Net Sales 4.6 8.3 +3.7
Operating income (0.4) 0.8 +1.2
Operating income margin - 9.4 -
Asia
Net Sales 7.2 24.1 +16.9
Operating income (2.0) 0.5 +2.5
Operating income margin - 2.2 -
Operating income margin 2.2 7.9
China/HongKong
Net Sales 40.9 53.7 +12.8
Operating income 4.1 5.1 +1.0
Operating income margin 10.1 9.5 -0.6
FY2016 FY2021*Plan Difference
+5.7
*The differences between the sum of net sales and Operating income of each segment (domestic andoverseas) shown in the tables and consolidated target figures consist of Nissin Foods Holdings Co., Ltd.and other subsidiaries.
FY2016FY2021*
Plan Difference
Operating income margin 2.0 3.9 +1.9
The Americas
Net Sales 48.3 80.8 +32.5
Operating income 1.1 6.4
*The differences between the sum of net sales and Operating income of each segment (domestic andoverseas) shown in the tables above and consolidated target figures consist of Nissin Foods Holdings Co.,Ltd. and other subsidiaries.
Instantnoodlesbusiness
Net Sales 265.2 297.6 +32.4Operating income 25.3 29.5 +4.2
Operating income margin 9.6 9.9 +0.3Chilled/Frozen,Confectionery,
Beverage
Net Sales 98.4 132.3 +33.9Operating income 2.0 5.2 +3.2
+5.3
12

Summary of Selected Data
Fiscal year ends at March 31 of each year.
Domestic net sales
Overseas net sales
◆Net sales
(Growth rate)
(Portion of overseas sales)
(Overseas OP ratio)
Cost of goods sold
Cost of goods sold ratio
Advertising expenses ratio
Distribution expenses ratio
Promotional expenses ratio
Operating income
◆
Operating income ratio
Ordinary income
◆
Comprehensive income
Total equity
Total assets
◆ROE
ROA
Book-value per share (BPS)
EPS
◆Adjusted EPS*2
Share price at year-end
◆Market capitalization ¥Mil.
PER
Cash dividends per share
Payout ratio
Capex
R&D expenses*1: Adjusted OP= OP-Impact from retirement benefit accounting*2: Adjusted EPS = Adjudted NOPAT*3/Average number of shares outstanding*3: Adjusted NOPAT =Adjusted operating income + Equity method gains or losses + Amortization of goodwill (including equity method companies) – Net income attributable to non-controlling interests income attributable to non-controlling interests*◆ = KPIs of Medium-Term Business Plan 2021.*The amounts are truncated at 100 thousand yen.* Since the details of the revised plan is not for disclosure, the initial plan is presented.
* Number of shares outstanding excludes treasury stocks. * "Domestic net sales" and "Overseas net sales" are based on the location to which goods are sold, therefore the figures differ from"Results by Segment."
Yen 187.56 167.97 171.12 174.83 167.88 245.52 203.66
-80
39.3
43,900
16,300
-
Japanese financial statements of fiscal years up to FY2015 are available at our website: http://www.nissin.com/jp/ir/library/download/
¥Mil. 30,810 18,936 21,582
¥Mil. 4,081
110,189 110,216 100,229 109,500
324,478 340,983 483,190 513,081 651,470 571,455
177.86
9.4
(3,010)
3,018.82
65.17.4
371,688369,852512,743
5.0
342,300
6.069.4
3.7
30,353
(4,840) (45,759)
55.7
30,213
4.2
110,221
45,043
110,231
3,282.02
36,183
--
27,00031,520
5.4Adjusted Operating income*1 ¥Mil. 30,494 26,789
24,300
6.6 5.6% 9.2 6.9 6.3
6.318.1 17.5
Adjusted Operating incomeratio % 8.1 7.0 6.4 6.5 5.4 5.3 6.3
-
-
-
250.58
-
31,000
22,000
-
-----
45,017
-
-
-
-
FY 2017(Initial Forecasts)
383,800116,200500,000
6.823.2
---
11.2
4,384 4,320 5,313
27,527 32,785
14,516 17,499
7,183
15,440
6,431
22,959
12,827 14,955 14,344Depreciation and amortization ¥Mil.
%
7537.3 44.7 43.8 42.970 75 75
15.6 18.4 25.6 26.6 21.5Yen
35.275
Number of shares outstanding Thousands ofshares 110,668 110,172 110,191
Yen
Yen 2,932 3,095 4,385
2,454.67 2,545.31 2,782.25
183.39 168.30 173.29
Average number of sharesoutstanding
Thousands ofshares 110,665 110,367
Cash flows from operatingactivities ¥Mil. 29,258 32,604 32,045
¥Mil.EBITDA(Operating income+Depreciation+Amortization of goodwill)
48,115
18,538 18,855
446,13266.3 67.6 68.7
553,06870.6
26,88419,268
19,60637,410
479,469
18,505
37,955
414,717286,657 315,026
¥Mil. 30,964
24,461 27,028 24,662¥Mil. 34,537 26,211 23,954 27,705 26,399
23,203
32,98034,840
5.6
30,73336,418 28,099
3.1% 54.2 56.1 55.2 55.4
5.8 6.0%
21.6
FY 2015
348,82182,755
343,931 367,142
FY 2014
203,202 213,707 211,346 231,309 260,496
14.0 13.4 14.0
468,08452,582 50,998 53,544 73,689
8.5431,575
FY 2016
3.3
Unit
100,941¥Mil. 374,932¥Mil.
Fiscal YearFY 2011 FY 2012 FY 2013
380,674 382,793
¥Mil. 322,349 329,676 329,248
417,620% 1.0 1.5 0.6 9.1
2.8
% 17.1 17.3 18.4 18.2
17.6% 8.3 2.7 6.4 5.2
% 3.5 2.9
19.2
242,915
%
2.96.3
¥Mil.
5.8 5.8
5.8
2.956.3
Net income attributable to ownersof parent
¥Mil.
¥Mil.
%
%
%
Ratio of equity attributable toowners of parent to total assets
43,026
5.1 4.5 4.4
41,917 39,342
277,595
¥Mil. 13,238 18,540 34,883
¥Mil. 20,756
Cash flows from financingactivities ¥Mil. (4,710) (9,442) (10,070)
Cash flows from investingactivities ¥Mil. (33,440) (12,831) (31,251)
108,025
3,332.94
195.89
32.6
5,290
Yen
6.4
409,748
44.7
4,655 5,910
195.63
(8,525) (8,022)
40,407
(9,507)
5.37.7 6.7
80Times
13

1. Operating Income and Adjusted Operating Income *
*Adjusted Operating income= Operating income-Impact from retirement benefit accounting
2. Net income attributable to owners of parent and (Adjusted) EPS *1
* EPS = Net income attributable to owners of parent per share
*1: Adjusted EPS = Adjudted NOPAT*2/Average number of shares outstanding*2: Adjusted NOPAT =Adjusted operating income + Equity method gains or losses + Amortization of goodwill (including equity method companies)
3. Equity and ROE
Historical Data
23.627.3
34.5
26.224.0
27.724.3
26.430.3
34.630.5
26.824.5
27.023.2 24.7
0.0
5.0
10.0
15.0
20.0
25.0
30.0
35.0
40.0
2009/3 2010/3 2011/3 2012/3 2013/3 2014/3 2015/3 2016/3
Operating income Adjusted operating income※
Bil. Yen
EPS (Yen) Net Income attributable to owners of parent (Bil. Yen)
Equity (Bil. Yen) ROE (%)
15.920.5 20.8
18.5 18.9 19.3 18.5
26.9
158
193 183
168 173 196 178
196
130
177
188
168 171 175 168
246
0.0
5.0
10.0
15.0
20.0
25.0
30.0
35.0
40.0
0
50
100
150
200
250
2009/3 2010/3 2011/3 2012/3 2013/3 2014/3 2015/3 2016/3
Net income attributable to owners of parent Adjusted EPS EPS
279.6 266.3 271.7 280.4306.6
332.7361.8 360.0
5.7%
7.5% 7.7%
6.7%6.4%
6.0%
5.3%
7.4%
0%
1%
2%
3%
4%
5%
6%
7%
8%
9%
0
50
100
150
200
250
300
350
400
2009/3 2010/3 2011/3 2012/3 2013/3 2014/3 2015/3 2016/3
Equity ROE
14

4. Capex, and Depreciation and Amortization
5. Cash dividends per share and Payout ratio
*Net income attributable to owners of parent increased due to factors including a one-off extraordinaly incom in conjunction with making Brazil Nissin a wholly-owned subsidiary.
6. Market capitalization of the year-end and PER
Historical Data
Bil. Yen
Cash dividends per share(Yen) Payout ratio(%)
Equity (Bil. Yen) PER(Times)
17.6 18.4
30.8
18.9 21.6
27.5
23.0
32.8
8.0 9.6 12.8
15.0 14.3 14.5 15.4 17.5
0
5
10
15
20
25
30
35
2009/3 2010/3 2011/3 2012/3 2013/3 2014/3 2015/3 2016/3
Capex Depreciation and Amortization
5060
70 75 75 75 75 80
38.5%
33.9%
37.3%
44.7% 43.8% 42.9%44.7%
32.6%
0%
5%
10%
15%
20%
25%
30%
35%
40%
45%
50%
0
10
20
30
40
50
60
70
80
90
100
2009/3 2010/3 2011/3 2012/3 2013/3 2014/3 2015/3 2016/3
Cash dividends per share Payout ratio
354.5 348.0 324.5 341.0
483.2 513.1
651.5 571.5
22.3
17.0 15.6
18.4
25.6 26.6
35.2
21.5
0
5
10
15
20
25
30
35
40
0
100
200
300
400
500
600
700
2009/3 2010/3 2011/3 2012/3 2013/3 2014/3 2015/3 2016/3
Market capitalization of year‐end PER
*
15
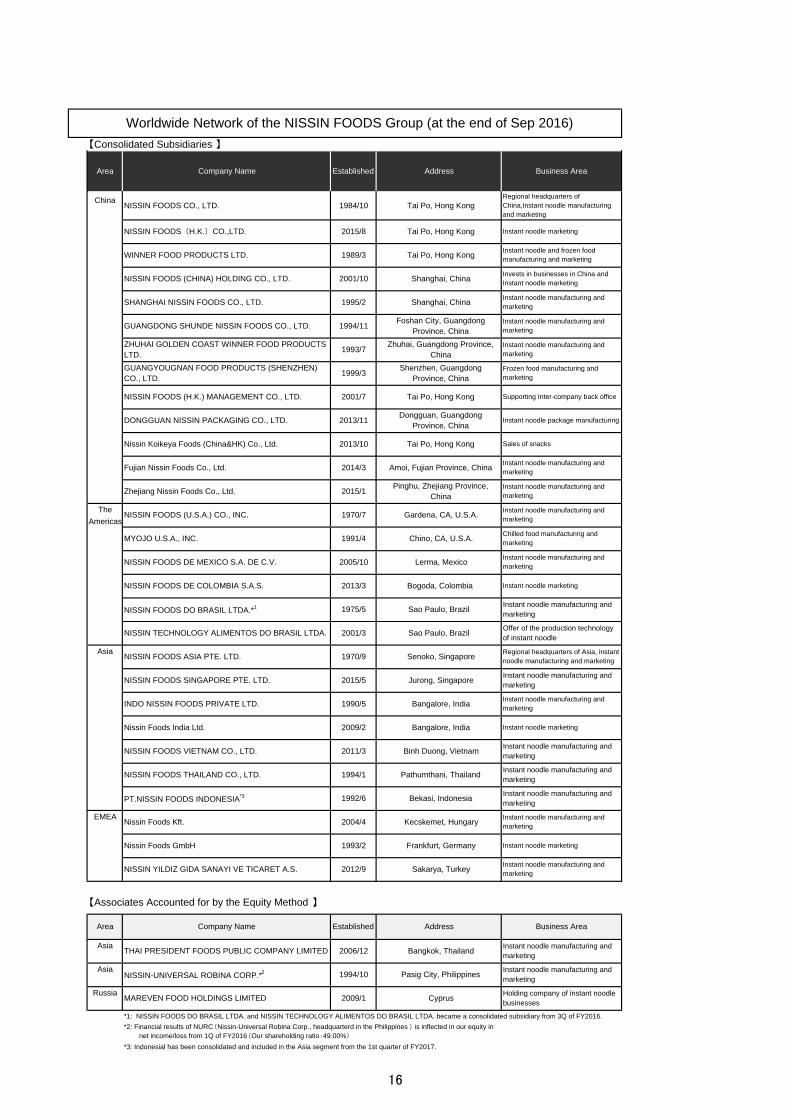
【Consolidated Subsidiaries 】
China
TheAmericas
Asia
EMEA
【Associates Accounted for by the Equity Method 】
Asia
Asia
Russia
*1: NISSIN FOODS DO BRASIL LTDA. and NISSIN TECHNOLOGY ALIMENTOS DO BRASIL LTDA. became a consolidated subsidiary from 3Q of FY2016.
*3: Indonesial has been consolidated and included in the Asia segment from the 1st quarter of FY2017.
Instant noodle manufacturing andmarketing
Invests in businesses in China andInstant noodle marketing
Frozen food manufacturing andmarketing
Chilled food manufacturing andmarketing
Holding company of instant noodlebusinesses
NISSIN FOODS THAILAND CO., LTD. Pathumthani, Thailand Instant noodle manufacturing andmarketing
*2: Financial results of NURC(Nissin-Universal Robina Corp., headquarterd in the Philippines ) is inflected in our equity in net income/loss from 1Q of FY2016(Our shareholding ratio:49.00%)
NISSIN YILDIZ GIDA SANAYI VE TICARET A.S.
1994/10 Pasig City, Philippines
2009/1 Cyprus
NISSIN-UNIVERSAL ROBINA CORP.*2 Instant noodle manufacturing andmarketing
MAREVEN FOOD HOLDINGS LIMITED
Area Company Name Established Business Area
Regional headquarters ofChina,Instant noodle manufacturingand marketing
NISSIN FOODS CO., LTD.
Address
Instant noodle manufacturing andmarketingTHAI PRESIDENT FOODS PUBLIC COMPANY LIMITED
Business Area
Instant noodle manufacturing andmarketing
Bangkok, Thailand2006/12
Kecskemet, Hungary2004/4
2012/9 Sakarya, Turkey
Shanghai, China2001/10
Lerma, Mexico
Address
Foshan City, GuangdongProvince, China
Zhuhai, Guangdong Province,China
Bangalore, India
Dongguan, GuangdongProvince, China
Established
2013/11
2001/7
1999/3
1993/7
1994/11
1995/2 Shanghai, China
NISSIN FOODS DE MEXICO S.A. DE C.V. Instant noodle manufacturing andmarketing
Company Name
Tai Po, Hong Kong
NISSIN FOODS ASIA PTE. LTD.
Instant noodle manufacturing andmarketing
Bogoda, Colombia
1994/1
2011/3 Binh Duong, Vietnam
Instant noodle manufacturing andmarketing
NISSIN FOODS SINGAPORE PTE. LTD.
GUANGDONG SHUNDE NISSIN FOODS CO., LTD.
Instant noodle manufacturing andmarketing
Instant noodle marketing
Supporting Inter-company back office
Instant noodle package manufacturing
1991/4 Chino, CA, U.S.A.
2015/1
2013/10
Instant noodle marketing
Instant noodle manufacturing andmarketing
Worldwide Network of the NISSIN FOODS Group (at the end of Sep 2016)
1970/9 Senoko, Singapore
NISSIN FOODS (CHINA) HOLDING CO., LTD.
SHANGHAI NISSIN FOODS CO., LTD.
NISSIN FOODS (H.K.) MANAGEMENT CO., LTD. Tai Po, Hong Kong
1984/10 Tai Po, Hong Kong
Gardena, CA, U.S.A.1970/7
2005/10
2013/3
2015/5 Jurong, Singapore Instant noodle manufacturing andmarketing
1993/2 Frankfurt, Germany
1990/5
2015/8NISSIN FOODS(H.K.)CO.,LTD.
NISSIN TECHNOLOGY ALIMENTOS DO BRASIL LTDA.
Nissin Foods Kft.
Nissin Foods GmbH
Tai Po, Hong Kong
Area
Pinghu, Zhejiang Province,China
Instant noodle marketing
WINNER FOOD PRODUCTS LTD.
Instant noodle manufacturing andmarketing
Zhejiang Nissin Foods Co., Ltd.
NISSIN FOODS DE COLOMBIA S.A.S.
MYOJO U.S.A., INC.
Instant noodle manufacturing andmarketing
Instant noodle manufacturing andmarketing
Nissin Koikeya Foods (China&HK) Co., Ltd. Tai Po, Hong Kong Sales of snacks
ZHUHAI GOLDEN COAST WINNER FOOD PRODUCTSLTD.
NISSIN FOODS (U.S.A.) CO., INC.
Instant noodle manufacturing andmarketing
GUANGYOUGNAN FOOD PRODUCTS (SHENZHEN)CO., LTD.
Shenzhen, GuangdongProvince, China
Fujian Nissin Foods Co., Ltd. 2014/3 Amoi, Fujian Province, China
Instant noodle marketing
Sao Paulo, Brazil Offer of the production technologyof instant noodle
Instant noodle manufacturing andmarketing
DONGGUAN NISSIN PACKAGING CO., LTD.
1989/3
2009/2 Bangalore, India
Instant noodle and frozen foodmanufacturing and marketing
Regional headquarters of Asia, instantnoodle manufacturing and marketing
NISSIN FOODS DO BRASIL LTDA.*1 1975/5 Sao Paulo, Brazil
NISSIN FOODS VIETNAM CO., LTD.
INDO NISSIN FOODS PRIVATE LTD.
Nissin Foods India Ltd.
Instant noodle manufacturing andmarketing
PT.NISSIN FOODS INDONESIA*3 1992/6
2001/3
Bekasi, Indonesia
16

Year Released Titile
2015 4-Feb Notice Personnel Transfer: Presidents of Nissin Food Products, and Nissin Cisco
18-Feb Strategic Alliance with Mitsubishi Corporation in Four Asian Countries
4-Mar Notice Personnel Transfer: President of Nissin Foods (U.S.A.) Co., Inc.
2-Apr Notice Personnel Transfer: Outside Director, Outside Audior and Supervisory Board Director
7-May Notice of Absorption-Type Merger (Simplified Merger, Short-Form Merger) with a Wholly-OwnedSubsidiary (Nissin Business Support Co., Ltd.)
27-Aug Notice of Acquisition of Additional Equity Interest in NISSIN-AJINOMOTO ALIMENTOS LTDA.(Brazil) and Making it a Consolidated Subsidiary
7-Oct Notice of Change in Consolidated Subsidiary (NISSIN TECHNOLOGY ALIMENTOS DO BRASILLTDA. )
30-Oct Notice of Completion of the Procedures for the Acquisition of Equity Interest in NISSIN-AJINOMOTO ALIMENTOS LTDA. (Brazil)
12-Nov Announcement of Differences between the Consolidated Forecasts and Results for the First Halfof Fiscal Year Ending March 31, 2016,and the Revision of Full-year Forecasts
26-Nov Notice Regarding the Termination of Joint Venture Agreement and the Conclusion of the EquityTransfer Agreement with JINMAILANG Group
2-Dec Notice Regarding Acquisition of Company Stock and Off-Floor Own Share Repurchase Trading(ToSTNeT-3) for the Purchase of Common Stock
3-Dec Notice Regarding the Result of Acquiring Company Stock Through Off-Floor Own ShareRepurchase Trading (ToSTNeT-3) and the Completion of This Acquisition
24-Dec Amendment of the Agreement on Strategic Alliance with Mitsubishi Corporation regardingIndonesia business
15-Jan Notice of Acquisition of Additional Equity Interest in Bonchi Co., Ltd. and Making It aConsolidated Subsidiary
23-Mar Announcement of Co-operation Agreement on Business Partnership with a Leading UK FoodCompany
24-Mar Announcement of Acquisition of Premier Foods plc Shares
22-Apr Announcement of Relationship Agreement with Premier Foods plc
9-May Notice of Personnel Transfer of Representative Directors, Directors and Executive Officers
12-May NISSIN FOODS Group Medium-Term Business Plan 2021
12-May Renewal of the Countermeasures to the Large-Scale Acquisition of the Company’s Shares(Takeover Defense Measures)
17-Aug Notice of Sale of Investment Securities
29-Aug Notice of Record of Gain on Sales of Investment Securities(Extraordinary Income)
2015 13-Apr NISSIN FOOD PRODCTS: Renewal of 6 Cup Noodle lineups (from late April)
14-May NISSIN CISCO: Renewal of Gorotto Granola and enhancement of production capacity
13-Jul Update affiliation contract with the professional tennis player "Kei Nishikori" until 2020
25-Aug Building of "Research Center Mastering Food Safety Scientifically" in Global Food SafetyInstituite (the WAVE)
4-Nov Disclosure of the Corporate Governance Report in TDnet of the Tokyo Stock Exchange
28-Mar Open company cafeteria "KABUTERIA" of which menes vary depending on stock prices
2-May A Landmark 40 Billion Cup Noodles Consumed Worldwide
23-Jun Announcement of Tokyo 2020 Official Partner Agreement
1-Sep Directly-managed Online Store Reopen after renovating on September 30, 2016
IR News and Topics
Topics
2016
2016
17

1. Nissin Foods Group Philosophy "EARTH FOOD CREATOR"
2. Embodiment of the "EARTH FOOD CREATOR" Concept
3. General Strategies for Pursuing Global Status
4-1. Targets under the Medium-Term Business Plan
Net sales ¥Bil. ¥Bil. ¥Bil. ¥Bil. ¥Bil.
Overseas net sales ¥Bil. ¥Bil. ¥Bil. ¥Bil. ¥Bil.
Operating income ¥Bil. ¥Bil. ¥Bil. ¥Bil. ¥Bil.
Ordinary income ¥Bil. ¥Bil. ¥Bil. ¥Bil. ¥Bil.
¥Bil. ¥Bil. ¥Bil. ¥Bil. ¥Bil.
Operating income ratio % % % % %
Ordinary income ratio % % % % %
ROE % % % % %
4-2. Targets under the Medium-Term Business Plan (Domestic) (OP=Operating Income)Sales ¥Bil. ¥Bil. ¥Bil. ¥Bil. ¥Bil.
OP ¥Bil. ¥Bil. ¥Bil. ¥Bil. ¥Bil.
Sales ¥Bil. ¥Bil. ¥Bil. ¥Bil. ¥Bil.
OP ¥Bil. ¥Bil. ¥Bil. ¥Bil. ¥Bil.
Sales ¥Bil. ¥Bil. ¥Bil. ¥Bil. ¥Bil.
OP ¥Bil. ¥Bil. ¥Bil. ¥Bil. ¥Bil.
*1: Food service business is included up to FY 2014
4-3. Targets under the Medium-Term Business Plan (Overseas)Sales ¥Bil. ¥Bil. ¥Bil. ¥Bil. ¥Bil.
OP ¥Bil. ¥Bil. ¥Bil. ¥Bil. ¥Bil.
Sales ¥Bil. ¥Bil. ¥Bil. ¥Bil. ¥Bil.
OP ¥Bil. ¥Bil. ¥Bil. ¥Bil. ¥Bil.
Sales ¥Bil. ¥Bil. ¥Bil. ¥Bil. ¥Bil.
OP ¥Bil. ¥Bil. ¥Bil. ¥Bil. ¥Bil.
Sales ¥Bil. ¥Bil. ¥Bil. ¥Bil. ¥Bil.
OP ¥Bil. ¥Bil. ¥Bil. ¥Bil. ¥Bil.
Sales ¥Bil. ¥Bil. ¥Bil. ¥Bil. ¥Bil.
OP ¥Bil. ¥Bil. ¥Bil. ¥Bil. ¥Bil.
4-4. Capital Investment 3 years total (FY14 Act.+FY15 Act. + FY16 Act.) Mid-term Plan¥Bil. ¥Bil.
Capital Investment ¥Bil. ¥Bil. ¥Bil. ¥Bil.
5. Financial Policies
Three-year Investment Budget:
Policy on Shareholder Returns:
Efficiency Indicator:
21.6 27.5 23.0 32.8
"Capital expenditure: Up to ¥50.0 billion, Business investment: Up to ¥65.0 billion"→ Revised to "¥115.0 billion totaling capital expenditure and business investment "
Aim for payout ratio of 40% or above. Consider stock repurchases based on an evaluation of market conditions and theoperating environment.
Management centered on improving ROE.
83.3 50.0 +66.5%FY2013 FY2014 FY2015 FY2016
+2.5%
1.8 1.6 1.6 2.8 4.6 -39.0%Overseas TOTAL
53.5 73.7 82.8 100.9 98.5
-56.3%
0.2 (0.2) (0.1) (0.4) 1.0 -
Europe/Middle East/Africa
(EMEA)
2.7 6.0 4.7 4.6 10.5
-59.9%
(0.5) (1.6) (2.2) (2.0) 0.1 -Asia
4.0 5.5 7.8 7.2 18.0
+27.1%
1.8 2.8 3.3 4.1 2.7 +51.4%China/Hong Kong
20.8 29.9 34.5 40.9 32.2
+27.6%
0.2 0.5 0.7 1.1 0.8 +32.5%The Americas
25.9 32.2 35.7 48.3 37.8
-3.6%
0.6 1.2 1.3 1.3 1.9 -31.7%
Confectionery/Beverage*1
34.0 36.1 34.3 38.6 40.0
+3.1%
0.8 0.5 (0.2) 0.7 1.4 -48.9%Chilled foods/Frozen
foods business52.6 54.8 56.6 59.8 58.0
+5.2%
25.5 27.7 25.1 25.3 27.2 -6.8%Instant noodles
business240.2 250.5 255.0 265.2 252.0
6.4 6.0 5.3 7.4 7.2 -
8.1 8.3 7.6 6.6 8.0 -
+17.0%
6.3 6.6 5.6 5.6 6.9 -
Net income attributable toowners of parent 18.9 19.3 18.5 26.9 23.0
31.0 34.8 33.0 30.7 36.0 -14.7%
24.0 27.7 24.3 26.4 31.0 -14.8%
53.5 73.7 82.8 100.9 98.5 +2.4%
FY2016(Mid-term Plan)
FY2016VS
Mid-term Plan
382.8 417.6 431.6 468.1 450.0 +4.0%
3 years covered by the Mid-term Plan
FY2013 FY2014 FY2015 FY2016
ROE: More than 7% ROE: More than 8% ROE: More than 10%
Strengthen earning power of domestic business :Establish new earnings model → Introduce high-speed branding system and reduce costs through jointprocurement and distribution by group companies.
Exedite growth in overseas business :Establish business models suitable for markets → Create different business models for mature markets, growthmarkets, and new markets respectively.
Pursue group-wide strategic initiatives: Strengthen platform capabilities as a global company → Pursue M&A, emphasize ROE and establish global humanresources systems
Pursue global status. Gain a strong global reputation. Embody the "EARTH FOOD CREATOR"
Overseas sales ratio: More than 20% Overseas sales ratio: More than 30% Overseas sales ratio: More than 50%
(Ref) Previous Medium-Term Business Plan (Announced in April 2013) Digest Results
Contribute to society and the planet by gratifying people everywhere with pleasures anddelights food can provide.
FY2016 (March 2016) FY2021 (March 2021) FY2026 (March 2026)
18

Bag-type and Cup-type Instant Noodles Production in Japan (FY2006 - FY2016)
(million servings)
FY 2006 2007 2008 2009 2010 2011 2012 2013 2014 2015 2016Cup-type
instant noodles 3,419 3,327 3,319 3,290 3,438 3,510 3,635 3,527 3,487 3,566 3,825
Bag-typeinstant noodles 2,023 1,979 2,031 1,955 1,911 1,799 1,895 1,948 1,988 1,844 1,820
Total 5,442 5,305 5,349 5,245 5,349 5,309 5,530 5,476 5,475 5,410 5,645
(Source)JCFIA=Japan Convenience Foods Industry Association (http://www.instantramen.or.jp )
Note: Annual production volume is based on years from April to March.
Average Price incl. Tax of Mainstay Products at Mass Merchandise Stores
Instant Noodles Industry Data
0
1,000
2,000
3,000
4,000
5,000
6,000
2006 2007 2008 2009 2010 2011 2012 2013 2014 2015 2016
【Unit: Million servings】
【Unit:¥】(January. 2008 to September. 2016)
9095
100105110115120125130135140
'08/
1'0
8/3
'08/
6'0
8/9
'08/
12'0
9/3
'09/
6'0
9/9
'09/
12'1
0/3
'10/
6'1
0/9
'10/
12'1
1/3
'11/
6'1
1/9
'11/
12'1
2/3
'12/
6'1
2/9
'12/
12'1
3/3
'13/
6'1
3/9
'13/
12'1
4/3
'14/
6'1
4/9
'14/
12'1
5/3
'15/
6'1
5/9
'15/
12'1
6/3
'16/
6'1
6/9
CUP NOODLE Ave. price Nissin-no-Donbei Kitsune Ave. priceNissin Yakisoba U.F.O. Ave. price Industry* Ave. price
Price Revisions
The Great East Japan Eathquake Consumption Tax
Hike (5%⇒8%)
Bag Type
Cup Type
Price RevisionsJan. 1, 2015
*Average price of NISSIN's and competitors' products containing regular amount of noodles,such as products priced at ¥180 as a suggested retail price including tax, private-brand
products and open priced products. This data is based on retail prices including tax. Source: NISSIN
19

【Bag-type & Cup-type Total 】Fiscal year
ends Apr. May Jun. Jul. Aug. Sep. Oct. Nov. Dec. Jan. Feb. Mar. Total
Mar. 2017 532 414 430 392 406 475 2,649YoY change
(%) 113.6 106.4 105.3 91.8 98.6 95.9 101.9
Mar. 2016 468 389 408 427 412 495 574 559 543 400 456 512 5,645YoY change
(%) 100.6 95.0 108.0 106.5 111.8 101.9 98.5 103.0 106.0 100.8 109.4 114.0 104.3
Mar. 2015 466 410 378 401 368 486 583 543 512 397 417 449 5,410YoY change
(%) 95.9 94.1 104.6 102.8 103.1 109.1 103.6 97.1 96.9 102.4 94.4 86.3 98.8
Mar. 2017 54,519 42,780 44,338 40,444 41,753 49,161 272,995YoY change
(%) 115.5 109.4 106.1 92.4 99.3 97.7 103.3
Mar. 2016 47,189 39,097 41,805 43,758 42,045 50,341 58,806 57,476 56,654 41,648 46,722 52,279 577,820YoY change
(%) 104.6 98.0 112.4 110.5 116.8 107.7 102.9 107.0 111.2 103.7 112.5 116.0 108.4
Mar. 2015 45,119 39,909 37,192 39,582 35,994 46,726 57,161 53,734 50,932 40,177 41,535 45,078 533,141YoY change
(%) 96.2 94.7 105.8 103.9 102.9 107.8 104.1 98.3 97.7 106.1 97.3 89.6 100.0
【Bag-type Noodles 】Fiscal year
ends Apr. May Jun. Jul. Aug. Sep. Oct. Nov. Dec. Jan. Feb. Mar. Total
Mar. 2017 171 129 131 124 133 145 835YoY change
(%) 114.6 95.9 103.2 91.0 100.2 90.4 99.2
Mar. 2016 150 135 127 137 133 161 188 182 173 119 148 168 1,820YoY change
(%) 89.4 91.9 97.2 97.6 98.6 85.5 94.6 104.0 112.7 90.5 114.0 113.7 98.7
Mar. 2015 168 147 130 140 135 188 199 175 153 132 130 148 1,844YoY change
(%) 92.8 90.0 95.0 95.5 102.6 114.6 96.7 90.5 85.2 98.2 81.3 76.7 92.7
Mar. 2017 12,553 9,532 9,673 9,362 10,004 10,696 61,819YoY change
(%) 114.7 95.2 102.7 91.9 100.4 90.7 99.2Mar. 2016 10,944 10,011 9,418 10,192 9,967 11,794 14,073 13,457 12,830 8,799 10,798 12,326 134,609
YoY change(%) 90.4 94.0 98.7 99.0 102.0 88.4 100.1 108.4 118.9 91.9 118.0 116.1 101.7
Mar. 2015 12,105 10,654 9,537 10,299 9,772 13,343 14,055 12,416 10,789 9,578 9,149 10,617 132,315YoY change
(%) 95.6 92.0 96.4 96.3 102.4 115.6 96.6 90.8 84.0 100.2 81.2 77.3 93.5
【Cup-type Noodles 】Fiscal year
ends Apr. May Jun. Jul. Aug. Sep. Oct. Nov. Dec. Jan. Feb. Mar. Total
Mar. 2017 360 285 299 268 273 330 1,814YoY change
(%) 113.2 112.0 106.2 92.2 97.8 98.5 103.2
Mar. 2016 318 255 281 291 279 335 386 378 370 281 308 345 3,825YoY change
(%) 106.9 96.7 113.7 111.3 119.5 112.3 100.5 102.6 103.1 105.9 107.4 114.2 107.3
Mar. 2015 298 263 247 261 233 298 384 368 359 265 287 302 3,566YoY change
(%) 97.8 96.5 110.5 107.2 103.5 105.8 107.5 100.6 103.0 104.6 101.9 91.9 102.3
Mar. 2017 41,966 33,248 34,665 31,083 31,749 38,466 211,177YoY change
(%) 115.8 114.3 107.0 92.6 99.0 99.8 104.6
Mar. 2016 36,245 29,086 32,388 33,566 32,078 38,547 44,734 44,019 43,825 32,849 35,924 39,952 443,211YoY change
(%) 109.8 99.4 117.1 114.6 122.3 115.5 103.8 106.5 109.2 107.4 110.9 115.9 110.6
Mar. 2015 33,014 29,255 27,655 29,283 26,222 33,383 43,106 41,318 40,143 30,600 32,386 34,461 400,827YoY change
(%) 96.5 95.6 109.4 106.8 103.1 105.0 106.8 100.8 102.2 108.1 103.0 94.2 102.3
【Non-fried Bag-type Noodles 】Fiscal year
ends Apr. May Jun. Jul. Aug. Sep. Oct. Nov. Dec. Jan. Feb. Mar. Total
Mar. 2017 40 30 31 28 25 28 183YoY change
(%) 95.0 100.9 98.9 81.3 67.4 79.7 86.7Mar. 2016 42 30 31 34 38 35 40 39 43 27 34 40 432
Mar. 2015 48 44 38 48 36 43 42 47 35 30 31 33 475
(Source)JCFIA=Japan Convenience Foods Industry Association
Instant Noodles Industry Data
Non-friedBag type(Million
servings)
Totalproduction
amount
(¥Mil.)
Totalproduction
volume
(Millionservings)
Totalproduction
amount
(¥Mil.)
Volume and Amount of Instant Noodles Production in Japan (April 2014 - September 2016)
Totalproduction
volume
(Millionservings)
Totalproduction
amount
(¥Mil.)
Totalproduction
volume
(Millionservings)
20

Population GDP Per Capita Per Capita (Mil.) (Bil. US$) GDP(US$) Consumption
*1 *2 *3 2011 2012 2013 2014 2015 (Servings)*5China 1,374.6 10,983 7,990 Hong Kong 7.3 310 42,390Indonesia 255.5 859 3,362 145.3 147.5 149.0 134.3 132.0 51.7Japan 126.9 4,123 32,486 55.1 54.1 55.2 55.0 55.4 43.6Vietnam 91.7 191 2,088 49.0 50.6 52.0 50.0 48.0 52.4Republic of Korea 50.6 1,377 27,195 35.9 35.2 36.3 35.9 36.5 72.1Philippines 102.2 292 2,858 28.4 30.2 31.5 33.2 34.8 34.1India 1,292.7 2,091 1,617 35.3 43.6 49.8 53.4 32.6 2.5Thailand 68.8 395 5,742 28.8 29.6 30.2 30.7 30.7 44.6Malaysia 31.0 296 9,557 13.2 13.0 13.5 13.4 13.6 43.9Nepal 28.4 21 751 8.2 8.9 10.2 11.1 11.9 41.9Taiwan 23.5 524 22,288 7.6 7.8 7.5 7.1 6.8 28.9Saudi Arabia 31.4 653 20,813 6.2 6.4 6.6 4.9 5.1 16.2Myanmar 51.8 67 1,292 2.4 3.0 3.4 4.1 4.6 8.9Cambodia 15.5 18 1,168 2.6 2.6 2.4 2.5 2.7 17.4Bangladesh 159.9 206 1,287 1.0 1.6 2.2 2.5 2.7 1.7Pakistan 186.2 270 1,450 1.2 1.3 1.3 1.5 1.6 0.8Kazakhstan 17.7 173 9,796 1.3 1.3 1.4 1.4 1.4 7.9Singapore 5.5 293 52,888 1.2 1.3 1.3 1.3 1.3 23.3Uzbekistan 31.0 66 2,121 1.0 1.1 1.1 1.1 1.1 3.6Iran 79.5 388 4,877 - - - 0.4 0.4 0.5Turkey 77.7 734 9,437 - - - 0.2 0.3 0.4TOTAL - - - 848.3 879.4 917.2 887.9 827.7 -Australia 24.0 1,224 50,962 3.4 3.5 3.5 3.6 3.7 15.4New Zealand 4.7 172 37,045 0.7 0.8 0.7 0.8 0.8 17.5TOTAL - - - 4.1 4.3 4.3 4.4 4.5 -U.S.A. 321.6 17,947 55,805 42.7 43.4 43.5 42.8 42.1 13.1Canada 35.8 1,552 43,332 2.1 2.1 2.1 1.9 1.9 5.4TOTAL - - - 44.8 45.5 45.6 44.7 44.1 -Brazil 204.5 1,773 8,670 21.3 23.1 23.7 23.7 22.8 11.1Mexico 127.0 1,144 9,009 8.5 8.9 9.2 8.9 8.3 6.5Guatemala 16.3 64 3,929 - - 0.8 1.5 1.9 11.7Peru 31.9 192 6,021 0.6 0.7 0.8 1.2 1.3 3.9Chile 18.0 240 13,341 0.2 0.2 0.3 0.4 0.4 2.3Costa Rica 4.8 53 10,936 0.1 0.1 0.1 0.1 0.1 1.6Colombia 48.2 293 6,084 - 0.0 0.0 0.1 0.1 0.1TOTAL - - - 30.7 33.0 34.9 35.8 34.8 -Russia 146.3 1,325 9,055 20.6 20.9 21.2 19.4 18.4 13.3Ukraine 45.2 91 2,005 5.4 5.6 5.8 5.8 6.0 13.3United Kingdom 65.1 2,849 43,771 3.4 3.5 3.7 3.7 3.7 5.7Poland 38.0 475 12,495 2.9 2.7 2.6 3.0 3.1 8.1Germany 81.9 3,358 40,997 1.8 1.8 1.8 1.8 1.8 2.2Czech 10.5 182 17,257 1.0 0.9 0.9 0.6 0.9 8.1France 64.3 2,422 37,675 0.5 0.5 0.6 0.6 0.6 0.9Spain 46.4 1,200 25,865 - - - 0.4 0.5 1.1Sweden 9.9 493 49,866 0.2 0.2 0.3 0.3 0.3 3.3Hungary 9.9 121 12,240 0.2 0.2 0.2 0.2 0.2 2.4Netherlands 16.9 738 43,603 0.2 0.2 0.2 0.2 0.2 1.4Denmark 5.7 295 52,114 0.2 0.2 0.2 0.2 0.2 3.6Belgium 11.3 455 40,107 0.1 0.1 0.1 0.2 0.2 1.4Italy 60.8 1,816 29,867 - - - 0.1 0.2 0.2Finland 5.5 230 41,974 0.2 0.2 0.2 0.1 0.1 2.5Switzerland 8.2 665 80,675 - - - 0.1 0.1 1.5TOTAL - - - 36.6 37.1 37.7 36.8 36.5 -Nigeria 178.7 490 2,743 12.6 13.4 14.3 15.2 15.4 8.6Egypt 88.4 331 3,740 1.2 1.5 1.7 1.9 2.0 2.3South Africa 55.0 313 5,695 1.5 1.7 1.7 1.9 1.9 3.4Ethiopia 89.8 62 687 - - - 0.4 0.5 0.5TOTAL - - - 15.4 16.5 17.7 19.4 19.7 14.3Others - - - 2.2 2.3 2.5 9.4 9.8 -
GRAND TOTAL - - - 982.2 1018.0 1059.9 1038.5 977.1 -
( Sources )*1, *2, and *3: IMF website*4: WINA(World Instant Noodles Association) website (http://instantnoodles.org/)*5: Derived by dividing the demand in 2015 by the population.
Instant Noodles Industry Data
Africa
NorthAmerica
Central andSouth
America
Europe
Global Demand for Instant Noodles (by Region) (CY2011-CY2015)
Region Country/Area
Asia
Oceania
29.3444.0462.2440.3424.7
Demands (100 million.) *4
404.3
21
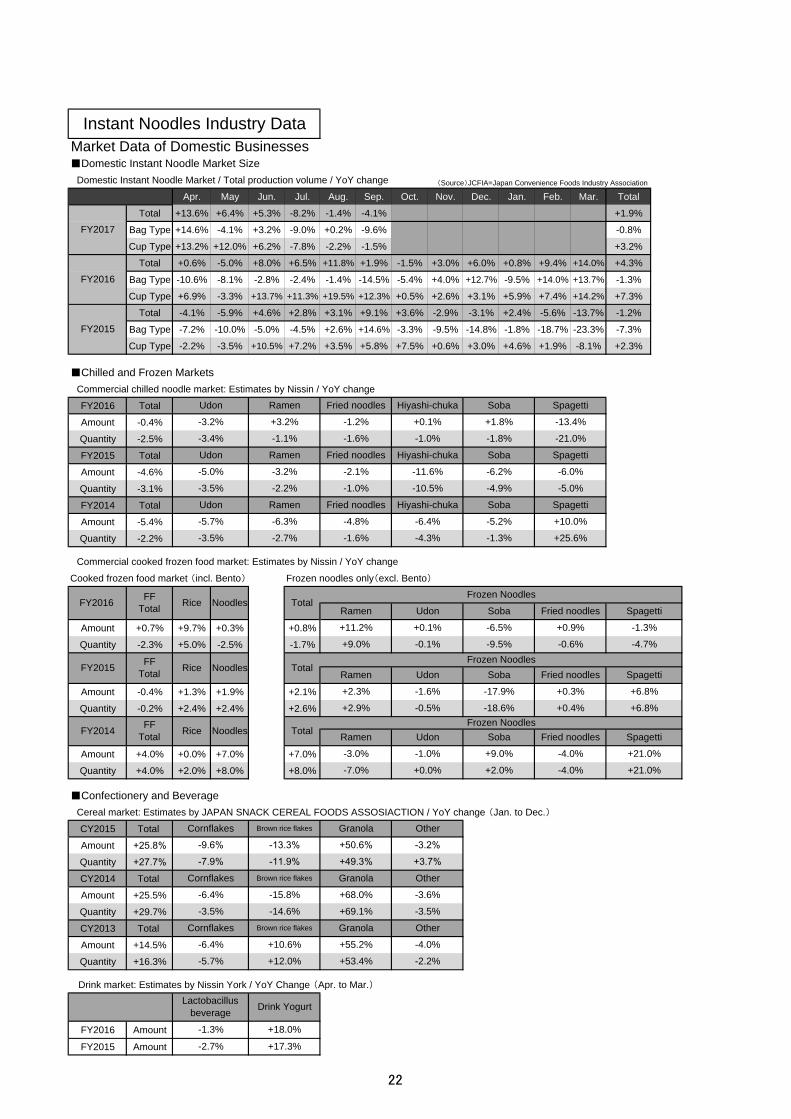
■Domestic Instant Noodle Market Size Domestic Instant Noodle Market / Total production volume / YoY change (Source)JCFIA=Japan Convenience Foods Industry Association
Apr. May Jun. Jul. Aug. Sep. Oct. Nov. Dec. Jan. Feb. Mar. Total
Total +13.6% +6.4% +5.3% -8.2% -1.4% -4.1% +1.9%
Bag Type +14.6% -4.1% +3.2% -9.0% +0.2% -9.6% -0.8%
Cup Type +13.2% +12.0% +6.2% -7.8% -2.2% -1.5% +3.2%
Total +0.6% -5.0% +8.0% +6.5% +11.8% +1.9% -1.5% +3.0% +6.0% +0.8% +9.4% +14.0% +4.3%
Bag Type -10.6% -8.1% -2.8% -2.4% -1.4% -14.5% -5.4% +4.0% +12.7% -9.5% +14.0% +13.7% -1.3%
Cup Type +6.9% -3.3% +13.7% +11.3% +19.5% +12.3% +0.5% +2.6% +3.1% +5.9% +7.4% +14.2% +7.3%
Total -4.1% -5.9% +4.6% +2.8% +3.1% +9.1% +3.6% -2.9% -3.1% +2.4% -5.6% -13.7% -1.2%
Bag Type -7.2% -10.0% -5.0% -4.5% +2.6% +14.6% -3.3% -9.5% -14.8% -1.8% -18.7% -23.3% -7.3%
Cup Type -2.2% -3.5% +10.5% +7.2% +3.5% +5.8% +7.5% +0.6% +3.0% +4.6% +1.9% -8.1% +2.3%
■Chilled and Frozen Markets Commercial chilled noodle market: Estimates by Nissin / YoY change
FY2016 Total
Amount -0.4%
Quantity -2.5%
FY2015 Total
Amount -4.6%
Quantity -3.1%
FY2014 Total
Amount -5.4%
Quantity -2.2%
Commercial cooked frozen food market: Estimates by Nissin / YoY change
Cooked frozen food market (incl. Bento) Frozen noodles only(excl. Bento)
Amount +0.7% +9.7% +0.3% +0.8%
Quantity -2.3% +5.0% -2.5% -1.7%
Amount -0.4% +1.3% +1.9% +2.1%
Quantity -0.2% +2.4% +2.4% +2.6%
Amount +4.0% +0.0% +7.0% +7.0%
Quantity +4.0% +2.0% +8.0% +8.0%
■Confectionery and Beverage Cereal market: Estimates by JAPAN SNACK CEREAL FOODS ASSOSIACTION / YoY change (Jan. to Dec.)
CY2015 Total
Amount +25.8%Quantity +27.7%CY2014 Total
Amount +25.5%
Quantity +29.7%
CY2013 Total
Amount +14.5%
Quantity +16.3%
Drink market: Estimates by Nissin York / YoY Change (Apr. to Mar.)
FY2016 Amount
FY2015 Amount
Instant Noodles Industry Data
Granola Other
-9.6% -13.3% +50.6% -3.2%-7.9% -11.9% +49.3% +3.7%
-13.4%
-3.4% -1.1% -1.6% -1.0% -1.8% -21.0%
FY2016 FFTotal Rice Noodles Total
Frozen Noodles
Ramen Udon Soba Fried noodles Spagetti
-3.5% -2.2% -1.0% -10.5% -4.9% -5.0%
Market Data of Domestic Businesses
Udon Ramen Fried noodles Hiyashi-chuka Soba Spagetti
-5.0% -3.2% -2.1% -11.6% -6.2% -6.0%
Udon Ramen Fried noodles Hiyashi-chuka Soba Spagetti
-3.2% +3.2% -1.2% +0.1% +1.8%
Udon Ramen Fried noodles Hiyashi-chuka Soba Spagetti
-5.7% -6.3% -4.8% -6.4% -5.2% +10.0%
+25.6%-3.5% -2.7% -1.6% -4.3% -1.3%
Frozen NoodlesRamen Udon Soba Fried noodles Spagetti
+11.2% +0.1% -6.5% +0.9% -1.3%
+9.0% -0.1% -9.5% -0.6% -4.7%
+2.3% -1.6% -17.9% +0.3% +6.8%
+2.9% -0.5% -18.6% +0.4% +6.8%
-3.0% -1.0% +9.0% -4.0% +21.0%
Frozen NoodlesRamen Udon Soba Fried noodles Spagetti
-7.0% +0.0% +2.0% -4.0% +21.0%
+55.2% -4.0%
-6.4% -15.8% +68.0% -3.6%
-3.5% -14.6%
Cornflakes Brown rice flakes Granola Other
Granola Other
+69.1% -3.5%
+53.4% -2.2%
FY2017
FY2016
FY2015
Lactobacillusbeverage Drink Yogurt
-2.7% +17.3%
-5.7% +12.0%
-6.4% +10.6%
FY2015 FFTotal Rice Noodles Total
FY2014 FFTotal Rice Noodles Total
Cornflakes Brown rice flakes
Cornflakes Brown rice flakes
-1.3% +18.0%
22
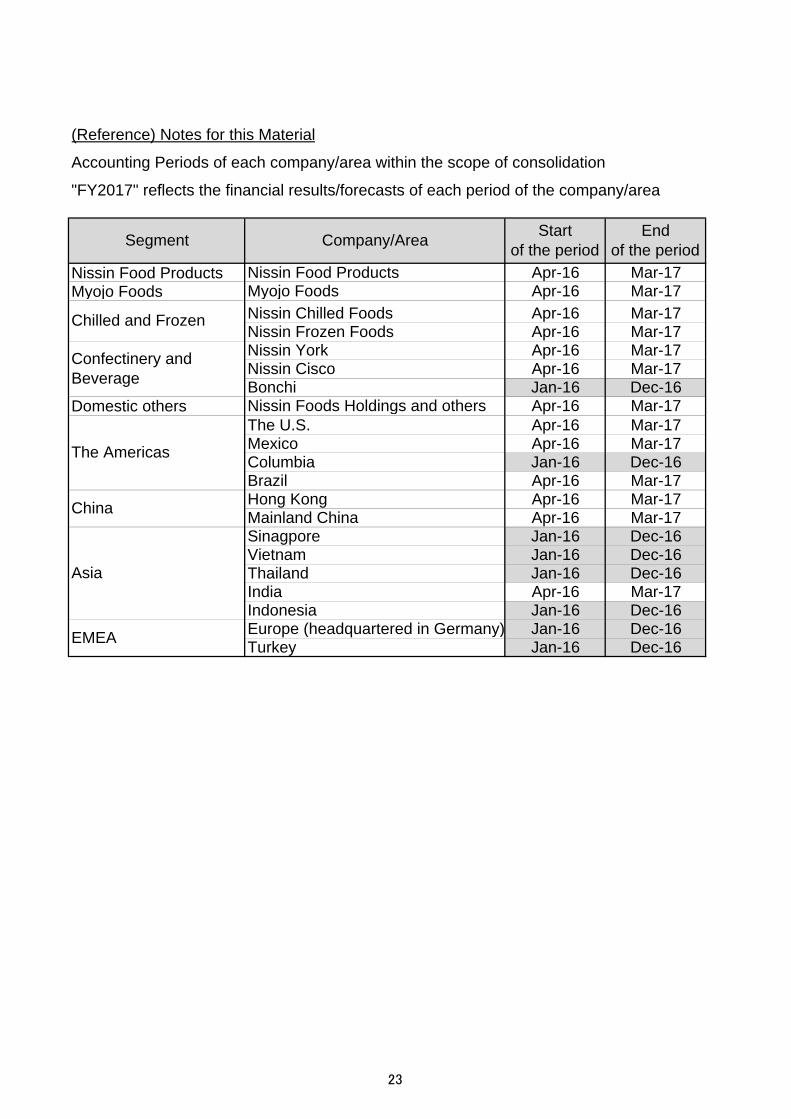
(Reference) Notes for this Material
Accounting Periods of each company/area within the scope of consolidation
"FY2017" reflects the financial results/forecasts of each period of the company/area
Nissin Food Products Nissin Food Products Apr-16 Mar-17Myojo Foods Myojo Foods Apr-16 Mar-17
Nissin Chilled Foods Apr-16 Mar-17Nissin Frozen Foods Apr-16 Mar-17Nissin York Apr-16 Mar-17Nissin Cisco Apr-16 Mar-17Bonchi Jan-16 Dec-16
Domestic others Nissin Foods Holdings and others Apr-16 Mar-17The U.S. Apr-16 Mar-17Mexico Apr-16 Mar-17Columbia Jan-16 Dec-16Brazil Apr-16 Mar-17Hong Kong Apr-16 Mar-17Mainland China Apr-16 Mar-17Sinagpore Jan-16 Dec-16Vietnam Jan-16 Dec-16Thailand Jan-16 Dec-16India Apr-16 Mar-17Indonesia Jan-16 Dec-16Europe (headquartered in Germany) Jan-16 Dec-16Turkey Jan-16 Dec-16
Segment Company/Area Startof the period
Endof the period
Chilled and Frozen
China
Asia
EMEA
Confectinery andBeverage
The Americas
23

This page is intentionally left blank

IR Office (Tokyo Head Office)Tel:+81-3-3205-5027 / Fax:+81-3-3205-5179
E-mail:[email protected]
Regularly updated IR information in English is also available onNissin's web site at http://www.nissin.com/en_jp/ir/
Stock Code: 2897
Information in this material is not intended to solicit sales or purchase of NISSIN FOODS HOLDINGS stock shares. The comments and estimates in this document are based on the company’s judgment at the time of publication and their accuracy is not guaranteed. They are subject to change without notice in the future. The company and its officers and representatives hold no responsibility for any damage or inconvenience that may be caused by any part of this material.