Investors´ DAY Private & Business Customers/Asset … · 2016. 11. 21. · New business in € m...
50
Private & Business Customers/Asset Management: Focused Investments Achim Kassow Member of the Board of Managing Directors Frankfurt September 21, 2006 Investors´ DAY
Transcript of Investors´ DAY Private & Business Customers/Asset … · 2016. 11. 21. · New business in € m...

Private & Business Customers/Asset Management:
Focused InvestmentsAchim Kassow
Member of the Board of Managing DirectorsFrankfurt September 21, 2006
Investors´ DAY

2 / 49
Disclaimer/ investor relations /
All presentations shown at Investors’ Day contain pro forma results for Q1 2006 and Q1-Q4 2005 to fully reflect the integration effect of Eurohypo. The pro forma results include Eurohypo results as if integrated as from January 1st, 2005 (incl. full refinancing costs), capital increase as if carried out before January 2005 (instead of November 2005) and issue of hybrid capital as if it took place before January 2005 (instead of March 2006). It shows segments’ quarterly results in the new Group structure and segments’ equity employed based on new calculation method./This presentation has been prepared and issued by Commerzbank AG. This publication is intended for professional and institutional investors./Any information in this presentation is based on data obtained from sources considered to be reliable, but no representations or guarantees are made by Commerzbank Group with regard to the accuracy of the data. The opinions and estimates contained herein constitute our best judgement at this date and time, and are subject to change without notice. This presentation is for information purposes; it is not intended to be and should not be construed as an offer or solicitation to acquire, or dispose of any of the securities or issues mentioned in this presentation./Commerzbank AG and/or its subsidiaries and/or affiliates (herein described as Commerzbank Group) may use the information in this presentation prior to its publication to its customers. Commerzbank Group or its employees may also own or build positions or trade in any such securities, issues, and derivatives thereon and may also sell them whenever considered appropriate. Commerzbank Group may also provide banking or other advisory services to interested parties./Commerzbank Group accepts no responsibility or liability whatsoever for any expense, loss or damages arising out of, or in any way connected with, the use of all or any part of this presentation./Copies of this document are available upon request or can be downloaded from www.commerzbank.com/aktionaere/index.html

3 / 49
PRODUKTION
DISTRIBUTION
Direct Banking:
Branch business:
PRODUCTION
Retail credit:
• Asset gathering with above-market growth (>6% p.a.)
• Intensive price competition in standard products
• No. 4 in German branch business • Best bank for sophisticated private
customers seeking superior advice in investment, old-age provision and home loans
Leverage Platform• Sustained growth in core target
groups Private Banking, Business Customers, Upper Retail and Affluents
• Further improvement of branch cost efficiency
Market Dynamics Position / USP Strategic Program
Asset Management: • ~9% AuM growth p.a. in German asset-management market
• Growing competition from domestic and foreign Asset Managers
• No. 5 in German AM with €65bn AuM
• Active return in core asset classes European bonds, equities & real estate; Leadership in innovation
Grow Asset Base• Growth programme “Alpha” to
invest €100m over next 5 years (esp. to strengthen sales, product quality and innovation) with target of €100bn AuM until 2011
• Diversification of investment platforms of CGG
• Digital transformation of customer relationships as mega-trend: growth in online banking >10% p.a.
• Increasing competition by incumbent branch banks through multichannel approach
• Leading direct bank for modern affluents: No. 1 B2C online broker, top in online banking, quality leader in IFA-provided advisory
• Superior value for money
Grow Customer Base• Further growth in banking, esp. in
current accounts, short- term deposits
• Strengthen best-in-class brokerage position
• 2-3% growth p.a. in private home loans
• Increasing price competition especially for "good" risks
• Aggressive direct banking players
• No. 1 in retail credit with overall loan portfolio of roughly €70bn and No. 2 in home loans with €50bn
• High service combined with competitive prices for defined target customers
Increase Profitability• Optimized credit processing via
new platform• Risk-return oriented credit
portfolio management• Focus on more sophisticated risk-
adjusted pricing &
Retail credit
Asset Management
Direct Banking
Branch business
Private and Business Customers and Asset Management divisions focus on affluent customers in Germany

4 / 49
Share of revenueStructure of population and customer base
Market share
~ 2–3%
~ 3–4%
~ 7–8%
Source: FMDS 2005
Retail (< €1,500) Upper Retail (€1,500-3,000) Mass Affluents (> €3,000)
PopulationGermany
Customerbase
Personal net income per month
Affluent segment registers above-average market share
5%26%
69%
26%
29%
45%
47%
26%
27%

5 / 49
Growth in customer base (H1‘06)in %*
Revenue per customer (2005)in €
Duration of relationship*in years
* Branch business
Affluents have significantly higher customer lifetime value –positive shift in Commerzbank’s customer base
Retail Upper Retail Mass Affluents
262
412
743
6.8
8.5
8.8
-1,6
+0.5
+3.1
* Annualized

6 / 49
1. Private and Business Customers – new game with larger book
2. Asset Management – growing with Group’s core businesses
Agenda

7 / 49
Operating profitin € m
Q1/05 Q2/05 Q4/05Q3/05
6978
6
80
52
Q1/06 Q2/06
84 7974
49
9.5%
14.9%111*
90
Pro Forma Q1/05 - Q1/06, including EH retail businessAs reported
* Restatement new Group structure
PBC: profitability diluted by integration of Eurohypo
Oper. RoE 2005
11.5%
14.8%
Oper. RoE H1 2006**
Av. Equity in € bn 2.53 2.51 1.91 2.501.90 1.90 2.50 1.95 1.96 2.462.48
** Annualized

8 / 49
Revenuesin € m, before provision
Solid revenues – costs as an permanent issue
LLPin € m
Q1/05 Q2/05 Q4/05Q3/05 Q1/06
591598 583
• Challenging risk environment due to increasing level of private insolvencies
• Y-o-Y increase in operating expenses driven by higher performance related personnel expenses and pension commitments
• Investment in growth initiatives according to plan
Q2/06
• Revenues 12% up on previous year H1 by exceptionally strong Q1 2006 in securities business, stabilized lending and optimisation of deposit revenues
• Q4 2005 of Eurohypo with extraordinary write-off of €30m for Delphi investment
536 545 559 566 583610598591
618643
596
58346 46 46
67
93737066
5574 73
591 583421 415
433450
484463449447 452
479 471Operating expensesin € m
Pro Forma Q1/05 - Q1/06As reported

9 / 49
New businessin € m
Lending gathers momentum: fixed-interest home loans
Overall portfolioin € bn
Average marginin %
EurohypoCommerzbank
Q1/05 Q2/05 Q4/05Q3/05 Q1/06 Q2/06
50.6 50.6 50.1 49.3 48.6 49.9
1,103 1,264 1,454 1,585
2,049
762
0.86 0.83 0.85 0.900.780.780.780.79
0.940.79
0.960.76
Business passed on*
28.5 28.1 27.127.5 26.4 25.8
22.922.1 22.5 22.822.6 22.8
• New business 57% up on previousyear in H1 2006
• Improved product features (e.g. extra-ordinary repayment option, forward loans, 30-year fixed interest period)
• Sales additionally boosted by special contingents (special interest rates)
• Commerzbank’s loan book stabilized by new business replacingexpiring loans
• Eurohypo’s book contracting
• Commerzbank increases margin by extending margin for loan prolongation, expiry of existing low-margin business and ongoing effect of introduction of risk-adjusted pricing
• Eurohypo with stable margins while improving quality of newly generatedbusiness

10 / 49
New businessin € m
Lending gathers momentum: consumer credits
Overall portfolioin € m
Average marginin %
Q1/05 Q2/05 Q4/05Q3/05 Q1/06 Q2/06
180
98
180 170
979
1,055 1,009
1,059
5.705.92 5.96 5.97
1,093
6.01
163
5.56
937
129
• Ongoing positive effect of introduction of risk-adjusted pricing
• Product innovation “Flexicard” (truely revolving credit card): launched in Q2 2005
• Sales promotion on an all-year-round rather than a seasonal basis

11 / 49* Custody accounts (securities) and deposits (demand, time, savings)
Customers´ assets*in € bn
Margins on depositsin %
Margins on securitiesin %
Q1/05 Q2/05 Q4/05Q3/05 Q1/06 Q2/06
94 9797 102
1.051.38
1.181.40
1.32 1.28 1.201.61
1.47
1.30
102
1.33
1.02
94
• Customers’ assets 9% higher than in H1 2005
• More assets held in custody accounts
• Deposits recede by active management of special-interest offers
• High special interest-rate tranchesreduced to market level
• Rising interest-rate level
• Capital markets more settled: margin returns to a stable level
Customer assets grow

12 / 49
* Annualized** Required equity for RWAs reduced from 7% to 6% in Q2/2006
Revenues before LLPsin € m
LLPsin € m
Operating expensesin € m
Pro Forma Q1/05 - Q1/06As reported
157 237 163 210-220
CIR, in %
Operating profit, in € m
Op. RoE, in %*75.412.5
77.49.4
76.014.8
78-798-9
Av. equity, in € m 2,517 2,503 2,206** ~2,470**
153
77.316.3
1,881
282
77.914.9
1,891
142
76.711.5
2,466**
230-240
77-78~10
~2,350**
1,081 1,189
2,3822,206
1,214 1,239
2,400-2,440
2,430-2,470
92 136
302205
128 147
~300 ~320
836 896
1,8431,719923 950
1,860-1,900
1,890-1,930
H1/06 2006pH1/05 2005
• High net commission income in H1 2006 mainly due to exceptional securities business in Q1
• Before one-off due to harmonization of provisioning standards Commerzbank/Eurohypo
• Higher costs of current pension commitments and RoE-dependent group bonus
• Investment in growth initiatives according to plan
Forecast 2006: Profitability down due to higher LLPs

13 / 49
2006e* 2010p
Operating RoE target 2010
8-9%
>18%
x2
Target 2010: Doubling operating RoE by addressing four value drivers
2006p* 2010e
* Before one-off due to harmonization of provisioning standards Commerzbank/Eurohypo
II. Contain cost increases
IV. Reduce capitalemployed
III. Reduce risk costson long-term basis
I. Extend earnings momentum

14 / 49
Performance Indicators
BusinessCustomers
• Distinctive value proposition for business customer needs• Extension of target-group oriented product portfolio
(recently: multi-account liquidity management)• Implementation of business potential-oriented customer
advisory model
Target: 50,000 new netcustomers by 2008Status: 39,000 new net customers gained
Target: Growth in branch businessUpper Retail/
Affluent
• New marketing approach with focused value proposition• Stronger media presence and specific campaigns to gain new
customers• Launch of new products to attract new customers • Selective enhancement of sales force
Private Banking
CONTINUEDStart: Q1/2004
Direct Banking
• Gaining new customers/market share through enhanced sales of banking products (current accounts, deposit products)
• Raising/securing securities revenue through superiororder/limit functions
• More cross-selling, above all in the area of consulting
Target: 200,000 new current accounts by 2007Status: 130,000 new accounts opened
• Focus on organic growth through extended customer base and team lift outs
• Value proposition further strengthened by uniform delivery model• Extension of Private Banking-specific product portfolio
(mandates, alternative investments, etc.)
Target: Increase AuM by €3bn by 2007 Status: strong volume growth (+24%/+€2.8bn) in 2005/2006
I. Extending earnings momentum to all target groups
CONTINUEDStart: Q1/2005
CONTINUEDStart: Q1/2005
NEWStart: Q4/2006

15 / 49
Retail creditcenters
• Taking credit-administration tasks out of sales• Product-oriented and specialized production lines• Workflow-supported, risk-adjusted processes with
transparent performance management• Concentration of production locations• Cost savings of €38m from 2008 on Status Target
9
# Locations
Status Target
# FTE
5
~2,000~1,550
Branchof the future
24
H1/05 H1/06
# Branch of the future
2007p 56
270
• New model for small branches (Branch of the future) developed with significant cost reduction by automating and shifting processes to back office while reducing service personnel
• Stable cost reduction of 19% in small branches (currently: 102)• Transfer of Branch of the future elements to large branches
currently planned (esp. authentification of cash handling, shifting processes to backoffice)
Service to perform for back-office/
IT units
Performance Indicators
• Reduce costs by 20%, based on the current service scope, by increasing efficiency and reducing complexity for the Commerzbank Group in mid term range
• Ensure sustainability of cost reductions
• Introduce a continuous improvement process
Target: Overall Cost-reduction approx. €200m as of 2008 (allocation to segment to be detailed)
~56% >20%
II. Stabilizing costs: containing administrative costs to offset increases in factor prices
56102
256
94*
CONTINUEDStart: Q2/2003
NEWStart: Q4/2005
NEWStart: Q1/2006
* Currently under negotiation

16 / 49
Risk-adjustedprocessing
strengthened
• Establishment of state of the art credit center allows for risk adjusted processing
• Clearly defined interfaces/responsibilities between performing, sub-performing and non-performing loan book
• Four processing lines established for homogenous sub portfolios
• Active trading of credit risks, especially portfolio transactions as an objective for the future
High levelof
provisions
• Unfavorable overall economic situation over last years will still have an impact on provisions
• Provisions to be stabilized in medium-term
• In long-term reduction of provisions by portfolio structure expected (following new business strategy)
LLPs*in €m
2006 2007p 2008p 56
~320
2010e
reta
il re
al
esta
te
spec
ial
loan
s
cons
umer
fin
ance
front office
priv
ate
bank
ing
Back-office: Credit-processing
Performance Indicators
III. Credit centers will lead to lower risk cost in future
* Before one-offs due to harmonization of provisioning standards Commerzbank/Eurohypo (2006) and influence of Basel II parameters on IFRS credit valuation (2007)

17 / 49
Future direction of thrust:
reduction of capital
requirements
• Establishment of a new business unit/credit treasury responsible for the entire existing loan book
• The responsibility for the loan book allows for an active portfolio management approach
• Active management of capital employed and allocation to most profitable sub portfolios
• Accompanied by active evaluation of potential alternatives
• Selling of sub-portfolios• Securitization of sub-portfolios• Use of synthetic products
Higher capital requirement
due toEurohypo Integration
• High capital requirement in retail credit banking
• Transition to Basel II will significantly reduce capital requirements
• Shift to economic capital steering mechanism will further reduce capital requirements
Target: Single loan portfolio ownership
From 800 branches to 1 central loan book
Performance Indicators
Basel I2005
Basel I2006p
Basel II
1.892.47
Employed capital in € bn
IV. Central credit treasury to actively manage capital employed

18 / 49
Revenues
Costs
LLPs
Capital2
Return
Op. RoE
I. Extend earnings momentum
II. Contain cost increases
III. Reducerisk cost on long-term basis
IV. Reduce capital employed
SUMMING UP
OPERATING RoE
TARGET2010:
>18%
2006
8-9%1
2007 2010
>18%
2008
>12%
Long-term target is operating RoE of at least 18% in 2010
IMPACT ON VALUE DRIVERS
1 Before one-off due to harmonization of provisioning standards Commerzbank/Eurohypo2 From 2008 onwards relief by Basel II effects

19 / 49
Agenda
1. Private and Business Customers – new game with larger book
2. Asset Management – growing with Group’s core businesses

20 / 49
Operating profitin € m
Q1/05 Q2/05 Q4/05Q3/05
36
16 18
4540
Op. RoE 200524.1%
27
Q1/06 Q2/06
H1 2006: results up by 29% in positive market environment
Op. RoE H1 `0624.4%
Av. Equity in € m 478475 457 502 544555

21 / 49
Q1 Q2 Q4Q3
127168
2005
Net commission incomein € m
2006Q1 Q2
133 145 170 174
1437
Bonuses/IFRS2 charges for LTI
28 1454 49
81 91
Operating expenses before bonuses/IFRS2
89 89 97 98
• Q4/05: Performancefees Jupiter €22m
• Operating expenses mainly driven by rising personnel costs(staff expansion, consolidation of Münchener Kapitalanlageges. AG)
• Adjustment of the IFRS 2 accrual policy in 2006: anticipation of current FY forecast at end of each quarter
Volatility of results mainly due to long term incentive models for key staff in International Asset Management

22 / 49
Q1 Q2 Q4Q3
127168
2005
Net commission income in € m
2006Q1 Q2
133 145 170 174
96 104
AuM in € bn
95 97 98 104
53 65
Margin in bps
56 6069 67
-12
Net inflow of funds in € bn
-3 -1 -11
x
Positive development of key value drivers
23 / 49
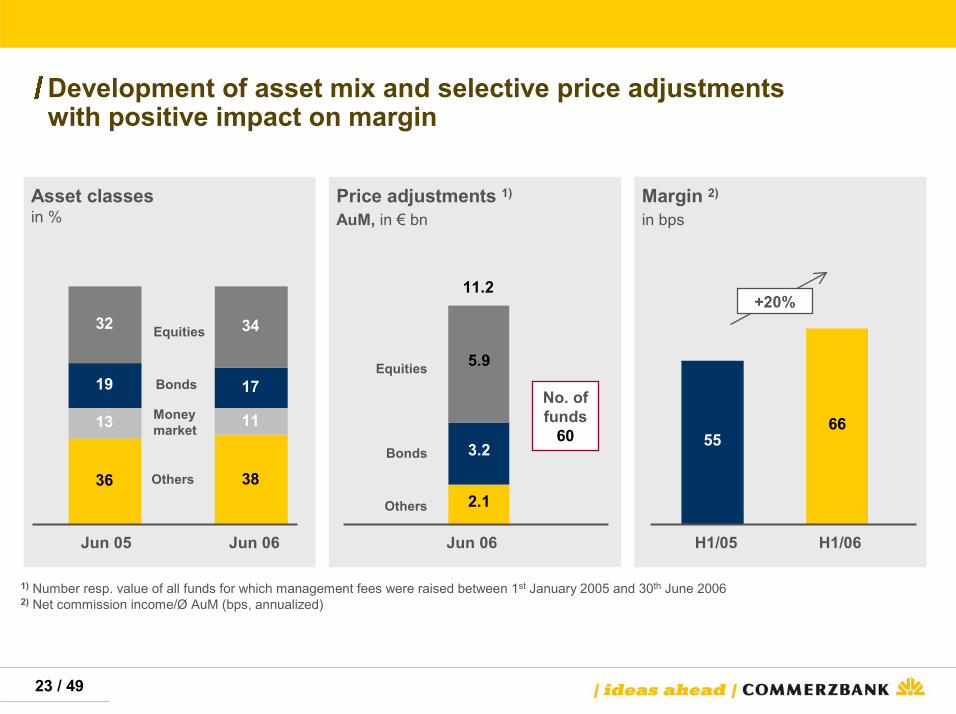
Asset classesin %
Price adjustments 1)
AuM, in € bnMargin 2)
in bps
1) Number resp. value of all funds for which management fees were raised between 1st January 2005 and 30th June 20062) Net commission income/Ø AuM (bps, annualized)
Equities
Bonds
Money market
Others
11.2
No. of funds
60
Equities
Bonds
Others
36 38
13 11
17
34
19
32
Jun 05 Jun 06
2.1
3.2
5.9
Jun 06
6655
H1/05 H1/06
Development of asset mix and selective price adjustments with positive impact on margin
+20%
24 / 49
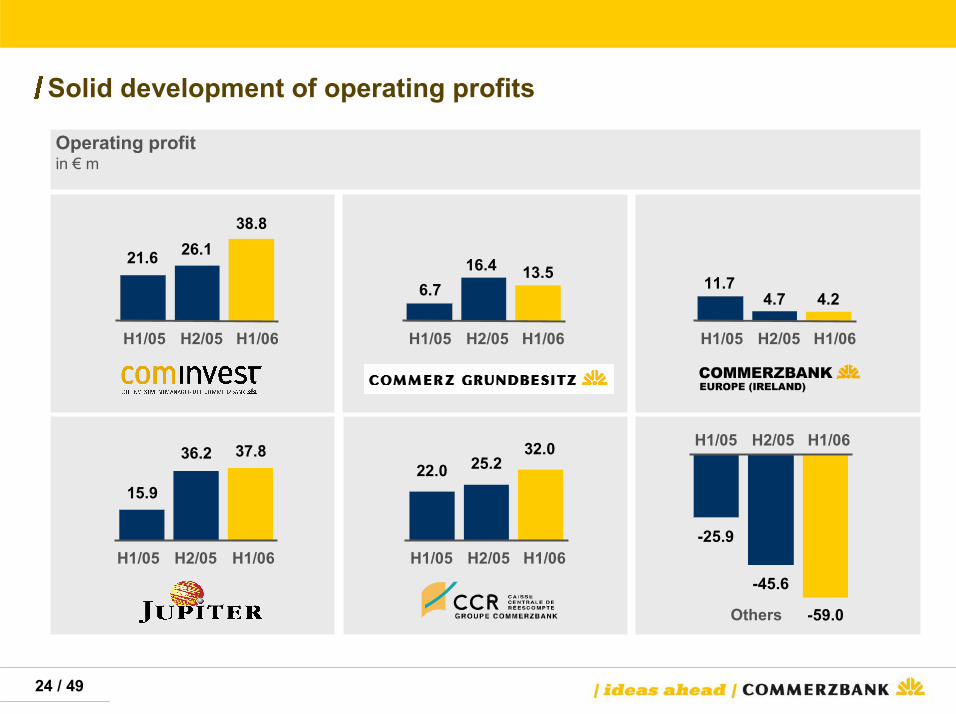
Others
Operating profit in € m
H1/05 H2/05 H1/06
H1/05 H2/05 H1/06 H1/05 H2/05 H1/06
H1/05 H2/05 H1/06
H1/05 H2/05 H1/06
21.6 26.138.8
15.9
36.2 37.822.0 25.2
32.0
-25.9
-45.6
-59.0
H1/05 H2/05 H1/06
11.74.7 4.26.7
16.4 13.5
Solid development of operating profits

25 / 49
CGG
Outperformance Underperformance up to -2% Underperformance < -2%
CGG: BVI return in %
Benchmark
HausInvest Global
HausInvest Europa
Fund performance, in %
COMINVEST* CCR* Jupiter*
* volume-weighted in %; exclusively funds backed by a benchmark
70.7
23.1
21.9
66.8
10.1 7.4
H1/05 H1/06
66.079.0
28.718.65.32.4
H1/05 H1/06
65.262.9
11.021.9
23.815.2
H1/05 H1/06
3.73.2
1.62.5
4.13.3
H1/05 H1/06
Improved investment performance

26 / 49
Operating profitin € m
H1 H2 FY
63
52
115
2005
H1 H2p FYp
67
2006
130-13563-68
Full year: operating profit expected to improve by approx. 15%

27 / 49
Operating profit H1 06
Equi
ty ti
ed u
p
Degree of integration into the Bank’s core business
low
high
highlow
CGG
COMINVEST
CCR
CB Europe
Enhance value
Invest
Strategy: growth with Group’s core businesses
Divest
Jupiter
28 / 49
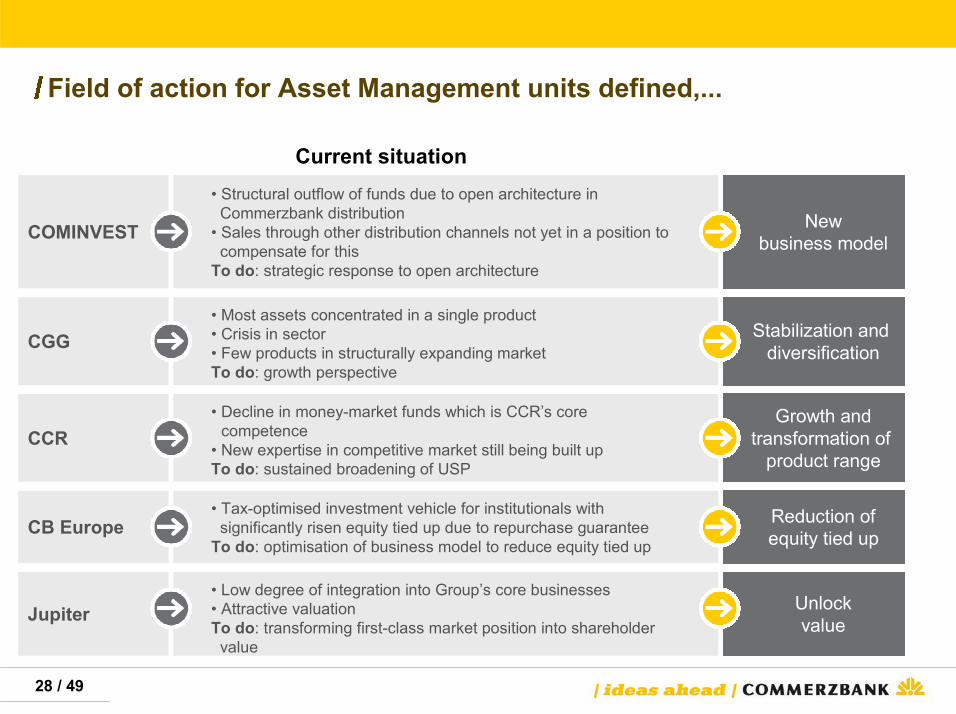
Current situation• Structural outflow of funds due to open architecture in
Commerzbank distribution• Sales through other distribution channels not yet in a position to
compensate for thisTo do: strategic response to open architecture
COMINVEST Newbusiness model
Stabilization and diversificationCGG
• Most assets concentrated in a single product• Crisis in sector• Few products in structurally expanding marketTo do: growth perspective
CCR• Decline in money-market funds which is CCR’s core
competence• New expertise in competitive market still being built upTo do: sustained broadening of USP
Growth andtransformation of
product range
• Low degree of integration into Group’s core businesses• Attractive valuation To do: transforming first-class market position into shareholder
value
Jupiter Unlockvalue
Reduction ofequity tied upCB Europe
• Tax-optimised investment vehicle for institutionals withsignificantly risen equity tied up due to repurchase guarantee
To do: optimisation of business model to reduce equity tied up
Field of action for Asset Management units defined,...

29 / 49
Core tasksNew management structure in Asset Managementeffective 1st November 2005
Board member responsible:
Achim Kassow
DetlevDietz
SebastianKlein
FriedrichSchmitz
FrankPörschke
COOInternational Asset
Management
Real Estate Asset
Management
COMINVEST: new business model
Jupiter: unlock value
CCR: growth and trans-formation of product range
CGG: Stabilization and diversification
Management of capital,risk and operations
CB Europe: Reduction of equity tied up
1.
2.
3.
4.
5.
6.
German Asset
Management
1. 2.
3.
4.
5. 6.
…key topics addressed under the new management structure

30 / 49
Leading market position as active manager for German and European equities and bonds and also innovative satellite products for private and institutional customers
Alpha growth programme
52
2005
AuM to be doubled by 2011 in € bn
100
2011e
Programme Alpha
Investment of up to €100m
until 2011
+92%
Focus on Germany: Alpha growth programme with ambitious targets
customerand salesfocus
Efficient, market-oriented
corporatestructure
Sustainedperformance
in product qualityand innovation

31 / 49
• Strategic, innovation-focused product management
• More satellite products/ become innovation leader
• Further strengthening of research and portfolio management
• Initially 2-3 successful innovations p.a., increasing over time
• Increase in number of top-rated funds from 20% to 30% (by 2011)
~ 30%, especially• product
development• portfolio
management• product
marketing
Sustainedperformance in product qualityand innovation
• Segment-specific support and investment proposals for institutional clients
• Intensive cooperation with CB in product development/sales
• Foster independent sales activities, esp. 3rd party
• Increase of net inflows from outside Group, from 25% to 50% (by 2011)
• Balanced expansion between private and institutional customers
~ 45% especially• widening of
distribution channels and target customers
• sales promotion
Customer and sales
focus
• Market positioning as active, innovative asset manager under the roof of Commerzbank Group
• Reduction of complexity• Implementation of
renumeration structures in line with market conditions
• Increase of brand recognition and reception
• Enhanced cost efficiency of administration platform
~ 25% especially• establish a single
brand• optimizing
structure• incentive models
Efficient,market-oriented
corporate platform
Investment until 2011 in Budget Selected targets
Programme AlphaInvestment of €100m over 5 years

32 / 49
Cominvest Benchmark
H1 2006
Equities 4.94 4.61
Balanced 1.32 -0.16
Passive/guaranteed 0.44 0.26
Bonds -0.81 -1.00
Active return
Fund of funds -0.91 -1.71
Total 1.17 0.72
0.33
0.19
1.48
0.18
0.80
0.45
Performance of Cominvest funds volume-weighted performance before costs*in %
* incl. funds with third-party advice
Programme AlphaEncouraging start (1/3): outperformance in all asset classes

33 / 49
Net fund inflows H1 2006 vs H1 2005in € m
2,650
- 735
1,915
Institutionalcustomers
Privatecustomers Total
• H1 2006 net inflows of €0.9bn into three newly launched capital-protection products:
• Rohstoffaktien Invest• Deutschland Invest• Eastern Stars Invest
Institutional customers• Acquisition of large advisory and
discretionary mandates• Management of Commerzbank pension
fund of approx. €1bn since January
Private customers• Substantial improvement of net inflows
(positive swing of +€904m)• Gross sales about 30% higher in H1 2006
compared with H1 2005; outflows approx. 7% higher
Successful new product launches for private customers• Well-filled product pipeline for the second
half of the year, including
• Fund Deluxe• Fondak Europa
-1,639
-1,020
-2,659H1 2006
H1 2005
Programme AlphaEncouraging start (2/3): approx. €2bn net inflows in H1 2006

34 / 49
Changes in retail funds offered
Transformation process through clear CEO model
• Dublin: outsourcing of fund administration finalised
• Munich: relocation to Frankfurt in progress–balancing of interests/negotiations for social plan
• Luxembourg: optimisation of fund administration under review
• Transformation of Münchener KapitalanlageAG into a distribution company – balancing of interests/negotiations for social plan
Reduced complexity in administration
CEO(Klein)
Private customers
(Klein)
Institutionalcustomers
(Kurr)
CIO(Mainert)
COO(Hartmann)
Product management
(Kurr)
Private customers(Löckener)
Institutionalcustomers
(Kurr)
CRO(Welter-mann)
COO(Plum)
CIO(Dr. Gerdes)
previous new
320
229
7098
Jun 2005 Jun 2006
No. of fundsAverage fund volumein € m
Programme Alpha
-28%
+40%
Encouraging start (3/3): first efficiency gains realized

35 / 49
52
2005
AuM in € bn
100
2011e
48
2005
Operating profit in € m
2011e
* Assumed market growth of 5% p.a.
68
2008p
60
2008p
Programme AlphaSuccessful implementation of project Alpha will double assets and drive profits substantially
Increase by 2011
105-125

36 / 49
Appendix
Initiatives Private and Business Customers
Quarterly analyst fact sheets Q2/2006

37 / 49
Initiatives Results
Top 3 position in Germany and successful niche position in new offshore markets for affluent private customers and entrepreneurs
Customer service and acquisition• 10 new locations since start in 2004,
3 of them in 2005/2006• Special unit for large entrepreneurial assets
(Unternehmerbankiers)• Focused marketing• Offshore growth strategy through
CB Switzerland
Innovation and quality• Performance programme for portfolio management• Independent securities management• Private banking credit policy• Innovative private equity and AIS products• Acquisition programme for asset management
volume
External growth• Team lift-outs
AuM raised by 16%
Two team lift-outs with more than €60m AuM in 2005 and 2006 successfully integrated
AuM in € bn
06/05 06/06
21 24
Active securities revenue up 25%
Revenuein € m
H1/05 H1/06
29 36
Positioning
Private Banking

38 / 49
Segment-specific business model• New value proposition for business
customers
• Distinctive market approach
• Product portfolio geared to target group
Results
Short-term growth impetus• Campaign for new and existing customers
• Roll-out of new market approach accompanied by intensive staff coaching
Ensuring future success• Special management reports for business
customers and sales management
• Pipeline for product innovations: multi-account liquidity management
• Reduction of administrative credit work for business customer advisors
Top 3 position for the investment-oriented professional and commercial client segment(turnover of up to €2.5m)
Business Customers
10,000 new business customers
Units in ‘000
439 449
21,000 new business accounts
Units in ‘000
252273
Appointments/week in ‘000
~8
H1/06
14% more appointments with business customers
~7
H1/05
InitiativesPositioning
06/05 06/06
06/05 06/06

39 / 49
High-quality investment advice• Closer contact with customers through
regionally based special advisors for affluents• Competitive edge in information and advisory
systems (TÜV - quality standard certificate)• Market leader in certificates• Streamlining/expansion of portfolio
management products
Results
Building upon skills in old-age provision• Fundamental expertise broadened• 150 certified provision experts of
CommerzPartner provide nationwide support with regard to complex issues
Top quality: ‘best choice’ for performance-oriented people seeking to make successful use of their financial opportunities Strengthening home loan business
• Great expertise thanks to specialists• Specially tailored, flexible solutions offered• Broader sales base due to development of
home-loan financing product for generalists planned
Affluent Clients
New marketing campaign
as of autumn 2006
Increase of locations serving affluent customers by 11%
# locations with special advisors for affluents
New home loan business increased by €1.1bn
Volume in € bn
374% more provision contracts concluded
# of contracts
H1/05 H1/06
4,95123,457
H1/05 H1/06
1.8 2.9
647 718
InitiativesPositioning
06/05 06/06

40 / 49
Ensuring an optimal branch network• New model for small branches (Branch of the future)
developed and now being realized• Administrative work reduced by shifting and
automating processes• Branch of the future elements transposed to
large branches
Results
Top quality: ‘best choice’ for performance-oriented people seeking to make the most of their financial opportunities
Retail Banking
Skills in old-age provision• Sales by generalist staff focused on streamlined
range of insurance products suitable for banks• Fund of funds savings plans incorporated into
products offered in old-age provision area • Integrated, IT-based advisory tool for old-age
provision as well as sales and specialist qualification measures introduced
• Optimized product portfolio sold by generalist personnel
Greater impact/quality of sales• Weekly controlling of sales activities• Quality assurance through regular mystery
shopping and customer surveys• Sales management focussed on product
profitability
46 new branches of the futurelaunched
# of branches of the future
Number of old-age provision specialists held constant in
difficult environment
Provision specialists
H1/05 H1/06
16% more appointments per week
Appointments (1,000/week)
56 102
232 231
43 50
New marketing campaign
as of autumn 2006
InitiativesPositioning
06/05 06/06
06/05 06/06

41 / 49
Results
comdirect
Prime-quality bank format for the modern investor: brokerage, banking, advisory
Brokerage: strengthen best-in-class position• Improvements to website• Broader active-trader offerings• Products, sales and services personalized
Banking: current-account offensive• Role as customers’ bank of choice enhanced by new
current-account functions• Major campaign focusing on current account • Cross-selling incentives thanks to pricing model• Instalment credit in place
Advisory: continuing to expand• Tailor-made and independent advice• Broad range covering financial and wealth issues• Experienced advisers recruited and constantly
trained• Stronger regional presence
Number of current accounts doubled
62% rise in securities ordersexecuted
H1/05 H1/06
3.0
4.9Units in m
108
213Units in ‘000
Advisory customers almost tripled
5
13# in ‘000
InitiativesPositioning
06/05 06/06
06/05 06/06
42 / 49
1. Segment Private and Business Customers restated
2. Segment Asset Management restated
1. 2.

43 / 49
Development of operating profit Private and Business Customers
ZFC 3 PK & AM
1. 2.Segment PBC – pro forma Restatement -
Customers / Gross income per customer
4,500
4,550
4,600
4,650
4,700
II/05 III/05 IV/05 I/06 II/06
in '0
00
120
127
134
141
148
in €
Customers Gross income / customer
Operating expenses / CIR
380
420
460
500
II/05 III/05 IV/05 I/06 II/06
in €
m
70
75
80
85
in %
Operating expenses CIR
Operating profit / ROE
0
25
50
75
100
II/05 III/05 IV/05 I/06 II/06
in €
m
0
4
8
12
16
in %
Operating profit Operating ROE
in € m Q II /2005 Q III/ 2005 Q IV/ 2005 Q I/ 2006 Q II/ 2006 Q II/06 vs. Q II/05���� in %
Net interest income 326 343 348 328 322 -1.2Provision for possible loan losses -70 -73 -93 -74 -73 4.6Net commission income 269 261 258 344 280 4.2Other income* 3 6 -23 -29 -6 -307.6
Total income 528 537 490 569 523 -0.9Operating expenses 449 463 484 479 471 4.9Operating profit 79 74 6 90 52 -34.9Average equity tied up 2,507 2,502 2,504 2,475 2,457 -2.0Operating return on equity (%) 12.6 11.8 1.0 14.5 8.4 -4.2 %-ptsCost/income ratio in operating business (%) 75.1 75.9 83.0 74.5 79.1 4.0 %-pts
Gross income** per Ø-customer*** in € 129 132 127 139 130 0.2Gross income** per Ø-FTE in € '000 69 71 68 76 70 0.9
* Trading profit, Net result on investments and securities portfolio, other operating result ** Before provisioning ***Customer of Eurohypo for Q1-Q4/2005 in lack of available Data w ith of Q1/2006 numbers

44 / 49ZFC 3 PK & AM
Net interest income Private and Business Customers
1. 2.
Lending incl. EH-Lending
30,000
40,000
50,000
60,000
70,000
II/05 III/05 IV/05 I/06 II/06
in €
m
0.00
0.40
0.80
1.20
1.60
in %
Ø-vol. Ø-margin
Deposits
24,000
26,000
28,000
30,000
32,000
II/05 III/05 IV/05 I/06 II/06
in €
m
1.00
1.10
1.20
1.30
1.40
in %
Ø-vol. Ø-margin
Net interest income per customer
250
280
310
340
370
II/05 III/05 IV/05 I/06 II/06
in €
m
50
58
66
74
82
in €
Net interest inc. Net interest inc. p. cust.
Average in € mMargin in % (italics)
Home loans fixed* 22,523 0.83 22,606 0.85 22,800 0.90 22,868 0.94 22,846 0.96 1.4 0.13 %-ptsHome loans floating* 403 3.82 393 3.98 387 3.75 391 3.59 388 3.57 -3.7 -0.25 %-ptsLoans fixed* 8,636 1.05 8,641 1.07 8,594 1.07 8,455 1.11 8,436 1.12 -2.3 0.07 %-ptsLoans floating/bill of exchange* 1,670 7.89 1,651 7.81 1,599 7.85 1,583 7.74 1,536 7.74 -8.0 -0.15 %-ptsConsumer loans* 979 5.70 1,009 5.92 1,055 5.96 1,059 5.97 1,093 6.01 11.7 0.31 %-ptsOthers** 2,093 2,092 2,120 2,241 1,907 1.82 -8.9EH Retail Banking 28,051 0.78 27,483 0.78 27,064 0.78 26,391 0.79 25,801 0.76 -8.0 -0.02 %-pts
Total lending 64,355 1.14 63,875 1.15 63,619 1.17 62,988 1.18 62,007 1.20 -3.6 0.06 %-pts
Sight* 8,119 1.60 8,214 1.64 8,587 1.67 8,879 1.86 8,912 2.06 9.8 0.46 %-ptsTime* 3,554 0.16 3,470 0.34 3,363 0.36 3,978 0.39 4,379 0.40 23.2 0.24 %-ptsSavings deposits* 14,346 0.96 13,699 1.13 11,976 1.47 11,154 1.39 10,858 1.42 -24.3 0.46 %-ptsOthers** 4,083 4,231 4,385 5,015 0.91 5,454 1.03 33.6 1.03 %-pts
Total deposits 30,102 1.05 29,614 1.18 28,311 1.38 29,026 1.31 29,604 1.39 -1.7 0.34 %-pts* German branches** comdirect, CoC RE, CISAL, COSEA, CB Sw itzerland
���� in %
Q II /2006 Q II /06 vs. Q II /05Q II /2005 Q I /2006Q III /2005 Q IV /2005
Segment PBC – pro forma Restatement -
45 / 49ZFC 3 PK & AM
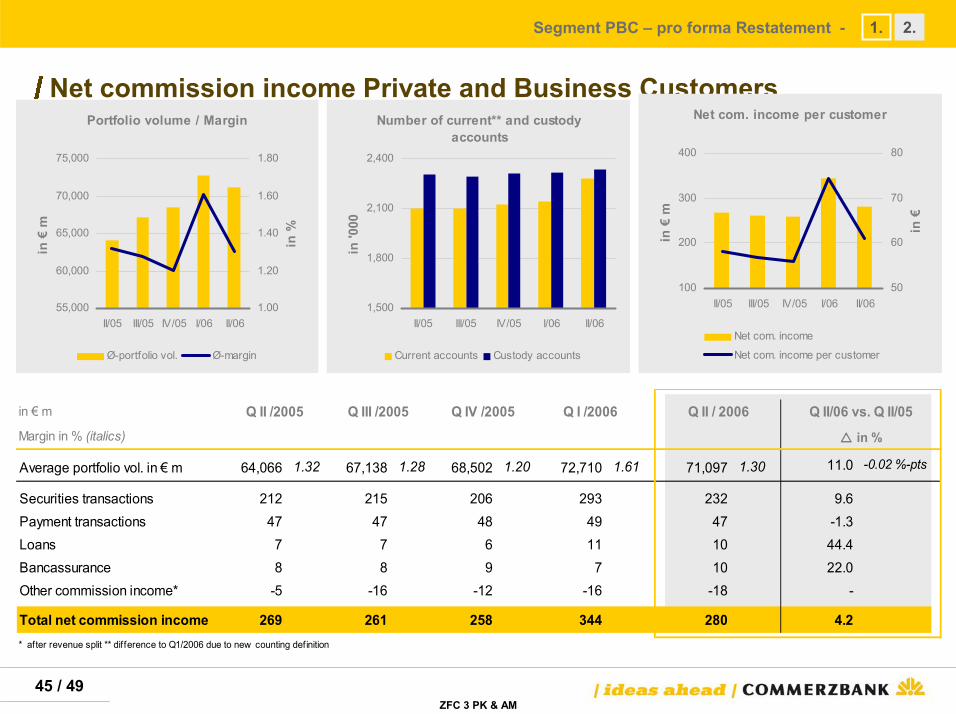
Net commission income Private and Business Customers
1. 2.
Portfolio volume / Margin
55,000
60,000
65,000
70,000
75,000
II/05 III/05 IV/05 I/06 II/06
in €
m
1.00
1.20
1.40
1.60
1.80
in %
Ø-portfolio vol. Ø-margin
Number of current** and custody accounts
1,500
1,800
2,100
2,400
II/05 III/05 IV/05 I/06 II/06
in '0
00Current accounts Custody accounts
Net com. income per customer
100
200
300
400
II/05 III/05 IV/05 I/06 II/06
in €
m
50
60
70
80
in €
Net com. income
Net com. income per customer
in € m
Margin in % (italics)
Average portfolio vol. in € m 64,066 1.32 67,138 1.28 68,502 1.20 72,710 1.61 71,097 1.30 11.0 -0.02 %-pts
Securities transactions 212 215 206 293 232 9.6Payment transactions 47 47 48 49 47 -1.3Loans 7 7 6 11 10 44.4Bancassurance 8 8 9 7 10 22.0Other commission income* -5 -16 -12 -16 -18 -
Total net commission income 269 261 258 344 280 4.2* after revenue split ** difference to Q1/2006 due to new counting definition
Q II/06 vs. Q II/05
���� in %
Q II /2005 Q I /2006 Q II / 2006Q IV /2005Q III /2005
Segment PBC – pro forma Restatement -

46 / 49ZFC 3 PK & AM
Key performance indicators of business units
1. 2.Segment PBC – pro forma Restatement -
Q II /2005 Q III /2005 Q IV /2005 Q I /2006 Q II /2006 Q II/06 vs. Q II/05
Private and Business CustomersCustomers (in '000) 3.709 3.686 3.653 3.602 3.568 -3,8Business volume (in € m)* 95.530 96.384 95.483 96.259 94.673 -0,9
FTE** 6.778 6.779 6.644 6.626 6.597 -2,7
Private BankingCustomers (in '000) 41 41 41 42 43 3,1Mandates (in '000) 21 21 21 21 21 3,1Business volume (in € m)* 24.299 25.100 25.431 27.591 27.538 13,3FTE** 424 426 437 456 468 10,4
Retail EurohypoCustomers (in '000) 265 260 257 253 248 -6,3Business volume (in € m)* 28.051 27.483 27.064 26.391 25.801 -8,0FTE** 505 426 418 409 417 -17,4
comdirectCustomers (in '000) 617 624 656 722 744 20,6Business volume (in € m)* 10.643 11.660 12.455 14.663 14.696 38,1FTE 547 560 563 573 614 12,2
���� in %
* loans, home loans, deposits, portfolio volume **FTE without head officeCustomers (without 0,5 m TUI-Card holders) and FTE: per end of the quarter, business volume: average for quarter

47 / 49
1. Segment Private and Business Customers restated
2. Segment Asset Management restated
1. 2.

48 / 49
Development of operating profit Asset Management
ZFC 3 PK & AM
1. 2.
0
10
20
30
40
50
II/05 III/05 IV/05 I/06 II/06
in €
m
0
10
20
30
40
in %
Operating profit Operating ROE
Operating profit / ROE Operating expenses / CIR
7085
100115130145160
II/05 III/05 IV/05 I/06 II/06
in €
m
65
70
75
80
85
90
in %
Operating expenses CIR
92949698
100102104
II/05 III/05 IV/05 I/06 II/0650545862667074
AuM Net commission income / AuM
Assets under management / Net commission income / AuM
in € m Q II /2005 Q III/ 2005 Q IV/ 2005 Q I/ 2006 Q II/ 2006 Q II/06 vs. Q II/05���� in %
Net interest income -2 -8 -8 -6 -6 200Net commission income 133 145 170 168 174 31Other income* 2 11 7 6 6 200Total income 133 148 169 168 174 31Operating expenses 117 103 151 128 147 26Operating profit 16 45 18 40 27 69Average equity tied up 457 478 502 555 544 19Operating return on equity (%) 14.0 37.7 14.3 28.8 19.9 5.8 %-ptsCost/income ratio in operating business (%) 88.0 69.6 89.3 76.2 84.5 -3.5 %-pts
Assets under management** 94,784 97,161 98,292 103,536 103,798 10Net inflows -2,945 -1,078 -910 1,489 884 -
FTE** 1,562 1,576 1,591 1,609 1,697 9
Total income / AuM (bps, annualized) 56 61 69 65 67 19Net commission income / AuM (bps, annualized) 56 60 69 65 67 19Total income / FTE (in € '000) 85 94 106 104 103 20Operating expenses / AuM (bps, annualized) 49 42 61 49 57 15
* Trading profit, Net result on investments and securities portfolio, Other operating result ** Per end of quarter, Integration of MK since Q II / 2006
Segment AM – pro forma Restatement -
49 / 49ZFC 3 PK & AM
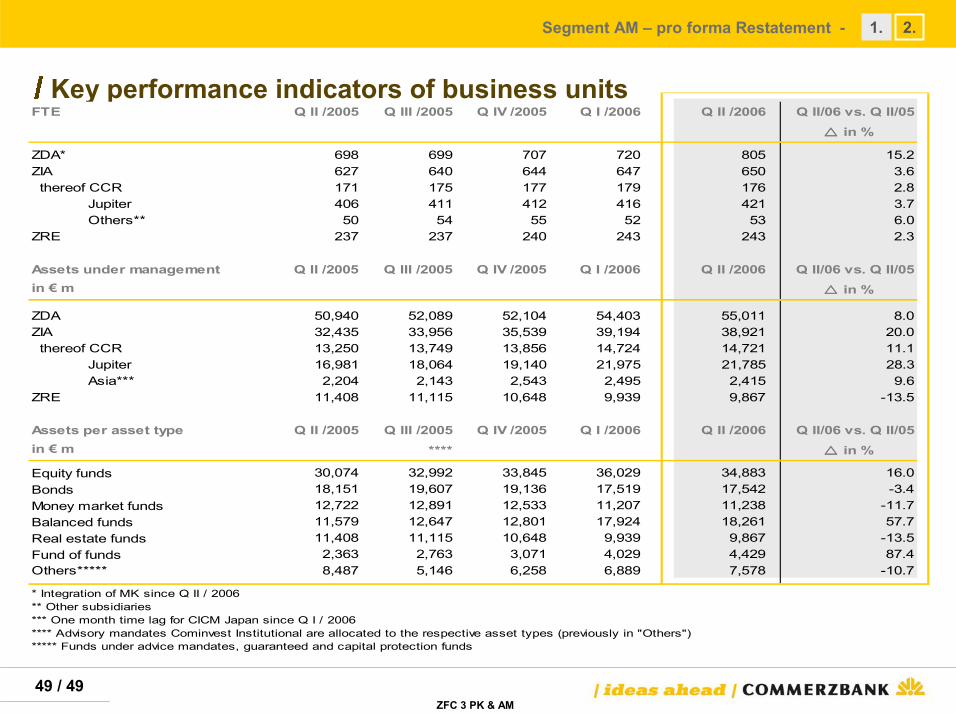
Key performance indicators of business units
1. 2.Segment AM – pro forma Restatement -
FTE Q II /2005 Q III /2005 Q IV /2005 Q I /2006 Q II /2006 Q II/06 vs. Q II/05
ZDA* 698 699 707 720 805 15.2ZIA 627 640 644 647 650 3.6 thereof CCR 171 175 177 179 176 2.8 Jupiter 406 411 412 416 421 3.7 Others** 50 54 55 52 53 6.0ZRE 237 237 240 243 243 2.3
Assets under management Q II /2005 Q III /2005 Q IV /2005 Q I /2006 Q II /2006 Q II/06 vs. Q II/05in € m
ZDA 50,940 52,089 52,104 54,403 55,011 8.0ZIA 32,435 33,956 35,539 39,194 38,921 20.0 thereof CCR 13,250 13,749 13,856 14,724 14,721 11.1 Jupiter 16,981 18,064 19,140 21,975 21,785 28.3 Asia*** 2,204 2,143 2,543 2,495 2,415 9.6ZRE 11,408 11,115 10,648 9,939 9,867 -13.5
Assets per asset type Q II /2005 Q III /2005 Q IV /2005 Q I /2006 Q II /2006 Q II/06 vs. Q II/05in € m ****
Equity funds 30,074 32,992 33,845 36,029 34,883 16.0Bonds 18,151 19,607 19,136 17,519 17,542 -3.4Money market funds 12,722 12,891 12,533 11,207 11,238 -11.7Balanced funds 11,579 12,647 12,801 17,924 18,261 57.7Real estate funds 11,408 11,115 10,648 9,939 9,867 -13.5Fund of funds 2,363 2,763 3,071 4,029 4,429 87.4Others***** 8,487 5,146 6,258 6,889 7,578 -10.7
* Integration of MK since Q II / 2006** Other subsidiaries*** One month time lag for CICM Japan since Q I / 2006**** Advisory mandates Cominvest Institutional are allocated to the respective asset types (previously in "Others")***** Funds under advice mandates, guaranteed and capital protection funds
���� in %
���� in %
���� in %

For more information, please contact:
Jürgen Ackermann (Head of IR)P: +49 69 136 22338M: [email protected]
Sandra Büschken (Deputy Head of IR)P: +49 69 136 23617M: [email protected]
Ute Heiserer-JäckelP: +49 69 136 41874M: [email protected]
Simone NuxollP: +49 69 136 45660M: [email protected]
Andrea Flügel (Secretary)P: +49 69 136 22255M: [email protected]/ir