Investor Sentiment and Stock Market Response to Corporate … · Investor Sentiment and Stock...
35
Investor Sentiment and Stock Market Response to Corporate News G. Mujtaba Mian The NUS Business School National University of Singapore Singapore E-mail: [email protected] Srinivasan Sankaraguruswamy The NUS Business School National University of Singapore Singapore E-mail: [email protected] November 13, 2007 PRELIMINARY DRAFT Discussions with Roni Michaely, Inmoo Li, He Wen, A. Subramanyam, Harrison Hong, Sugato Bhattacharya and Shen Jianfeng helped us improve the paper. We thank Inmoo Lee and Joseph Lakonishok for providing us the data on stock repurchases. We also acknowledge the financial support of National University of Singapore for the completion of this research.
Transcript of Investor Sentiment and Stock Market Response to Corporate … · Investor Sentiment and Stock...

Investor Sentiment and Stock Market Response to Corporate News
G. Mujtaba Mian The NUS Business School
National University of Singapore Singapore
E-mail: [email protected]
Srinivasan Sankaraguruswamy The NUS Business School
National University of Singapore Singapore
E-mail: [email protected]
November 13, 2007
PRELIMINARY DRAFT Discussions with Roni Michaely, Inmoo Li, He Wen, A. Subramanyam, Harrison Hong, Sugato Bhattacharya and Shen Jianfeng helped us improve the paper. We thank Inmoo Lee and Joseph Lakonishok for providing us the data on stock repurchases. We also acknowledge the financial support of National University of Singapore for the completion of this research.

Investor Sentiment and Stock Market Response to Corporate News
ABSTRACT
We test the hypothesis that the prevailing market-wide investor sentiment sways the stock market response to good and bad corporate news in the direction of the sentiment. We use the Baker and Wurgler (2006) index of investor sentiment, and investigate stock price response to earnings shocks. Consistent with our hypothesis, we find that the three-day announcement period return for positive (negative) earnings news is greater for the earnings that are announced during high (low) sentiment periods than those announced during low (high) sentiment periods. Furthermore, the effect of sentiment persists in the near term. Over the 60 days following the announcement of earnings, the well-documented stock price drift associated with positive (negative) earnings news is greater for the earnings that are announced during high (low) sentiment periods than those that are announced during low (high) sentiment periods. In the cross-section, the relation between sentiment and the stock price response to news is more pronounced for small stocks, young stocks, volatile stocks, non-dividend paying stocks and distressed stocks. Keywords: Investor Sentiment, Corporate News, Event Studies, Behavioral Finance JEL Classification: D14, D21, G24

I. Introduction
Do waves of market-wide optimism or pessimism, or investor sentiment1, influence the stock market response to firm specific news? According to the efficient markets view, the answer is an unequivocal no—stock prices in efficient markets have little to do with non-fundamental factors such as sentiment. Motivated by this view, the voluminous event study literature in finance and other areas of economics typically pool together events that happen during boom times with events that happen during bear periods. Tests are then conducted, for instance, to quantify the impact of various corporate events on the fundamental value of the firm2 under the maintained assumption that stock price reaction to corporate news is independent of the state of the stock market.
In contrast, both the anecdotal evidence3 and several papers in the recent behavioral finance literature suggest that the prevailing sentiment could significantly influence the way investors respond to new information and update their belief. One strand of this literature provides evidence that the optimism reflected in generic non-economic proxies of investor mood is positively correlated with the optimistic beliefs about future economic conditions (Hirshliefer and Shumway (2003), Edmans, Garcia and Norli (2007), and Puri and Robinson (2007)). To the extent that extreme bouts of market-wide investor sentiment and the mood of marginal investor are intertwined, the link between positive mood and optimistic assessments of future prospects implies a similar relation between positive sentiment and optimistic assessment of new information by investors. Furthermore, a related strand of the recent behavioral literature focuses directly on developing measures of sentiment and relating these to expected stock return (Baker and Wurgler (2006, 2007), Lemmon and Portniaguina (2006), Qiu and Welch (2006), Brown and Cliff (2005)). This literature begins with the premise that shocks to speculative demand combine with limits on arbitrage to generate mispricing in stocks. The speculative demand tends to be high (low) during periods of high (low) sentiment, which pushes up (down) the contemporaneous stock prices, and lowers (increases) the future stock returns. Given that investors often trade
1 One could broadly define investor sentiment as the beliefs about future cash flows or discount rates that are not supported by the prevailing fundamentals (Lemmon and Portniaguina (2006), p. 1499, and Baker and Wurgler (2006), page 6). This excessive optimism or pessimism may be associated with investors trading on noise (Black (1986)) or on popular models (Shiller (2005)). 2 Kothari and Warner (2006) note that more than 500 event studies have been published in top finance journals, many of which rely on the stock market reaction to news as the primary yardstick for ascertaining the value impact of the news. 3 The following comments are typical of the views frequently expressed by financial press. “Gauging how investors respond to news is a classic way of reading investor sentiment. In a bull market, investors respond positively to good news. In a bear market, investors use any strength generated in a stock from positive news as an opportunity to sell. ….When information becomes ubiquitous and trading costs become zero, anything becomes an excuse to buy or sell, depending on that day’s Zeitgeist. ..” Susan Pulliam, Good News is No News for Tech Stocks, Wall Street Journal, 24 May 2000.
1

heavily around significant corporate news announcements4, during high (low) sentiment periods when speculative demand is high (low), investors are more likely to bid up (down) the price around a corporate news announcement. Specifically, the stock price response to good (bad) news that arrives in high sentiment period is likely to be greater (lower) than the stock price response to good (bad) news that arrives during low sentiment period, other things being equal.
Equally importantly, some of the most cited cognitive biases on the part of individuals, observed in the experimental psychology and noted in the behavioral finance literature, provide micro foundations for a hypothesized relation between sentiment and stock marker response to corporate news. Individuals tend to suffer from confirmatory bias whereby they interpret new evidence in a fashion consistent with their prior beliefs. They are reluctant to accept the inconsistent facts, attributing these to luck or faulty data gathering (Barberis and Thaler (2003), and Hirshliefer (2001)). The confirmatory bias would, therefore, lead investors to respond more strongly to good (bad) news during periods of high (low) sentiment. Moreover, as Shiller (2005) argues, investors have a tendency to form their expectations about future price changes by anchoring on recent price changes. The representativeness heuristic reinforces such extrapolation of the recent price trends. The problem gets especially severe if, as Statman, Thorley and Vorkink (2006) note, investors ignore that “rising water lifts all boats” and anchor on the absolute value of recent price changes rather than on changes relative to the market. Consequently, in time of high (low) sentiment, which tend to be preceded by stock price increases (drops), investors underreact to bad (good) news as they believe the stock price would continue its recent rise (drop). Overconfidence, social interaction5 and media also play a critical role in reinforcing the representativeness heuristic and in persuading investors to underreact to evidence that contradicts the prevailing sentiment (Shiller (2005)).
Understanding the impact of sentiment on stock market resposne to news could yield new perspectives on key debates in financial economics. First, despite a number of recent studies, the debate on the importance of sentiment is far from settled, and much remains to be learnt about the role sentiment plays in financial markets. The evidence in recent studies that stocks are mispriced in the direction of the sentiment raises the possibility that a significant amount of this mispricing occurs on the days of the arrival of news. Specifically, overreaction (underreaction) of investors to good news or undereraction (overreaction) to bad news during periods of high (low) sentiment could be an important channel through which stocks become overpriced (underpriced) during high (low) sentiment periods. A confirmation of this would not only help identify a channel through which sentiment causes mispricing but would also suggest that the importance of sentiment documented in the recent literature is not spurious. Second, by focusing on the effect of sentiment on stock price response in the short window around the announcement
4 This is especially true for small investors that might be more prone to speculative demand shocks. For example, Lee (1992), and Battalio and Mendelhall (2005), among others, find that while both large and small traders increase their trading around earnings announcements, small traders do so much more than their large counterparts. 5 For example, in a survey of individual investors, Kuran and Sunstein (1999) describe the process of belief formation as leading to “availability cascades”, wherein an expressed perception is perceived to me more plausible as a consequence of its increased availability in public discourse.
2

of news, one could garner fresh evidence on the efficiency of the instantaneous response of the stock market to new information. Many researchers interpret the evidence accumulated in the voluminous event studies literature as an indication that human psychology plays no role in how markets respond to news, and treat the evidence as a key pillar in support of the efficient market hypothesis (see, for example, Fama (1991) and Ross (2005)).6 Any evidence that proxies of sentiment influence the stock market response to news would call into question the efficiency of the stock market’s instantaneous reaction to news. Finally, the event-study methodology has been widely used by researchers in finance and other areas of economics, to quantify the impact of various corporate events on the fundamental value of the firm.7 In a world where the stock market reaction to news varies significantly across periods of high and low sentiment, it is not clear how useful it is to rely solely on the market reaction as a measure of the valuation impact of the news event.
In this paper, we examine empirically how the prevailing sentiment influences stock market response to news. Specifically, we test the hypothesis that prevailing sentiment sways the stock market response to news in the direction of the sentiment. That is, stock market response to good news is greater during high sentiment periods than that during low sentiment periods. Similarly, stock market response to bad news is greater during low sentiment periods than that during high sentiment periods.
To test our hypothesis, we rely on the proxies of the sentiment developed by Baker and Wurgler (2006, 2007). Baker and Wurgler (2007) sentiment index is based on six proxies: trading volume as measured by NYSE turnover, the dividend premium, the closed-end fund discount, the number and first day returns on IPOs, and the equity share in new issues. This index is available at monthly frequency. The corporate news event we primarily focus on is earnings surprises, although in the latter part of our paper, we confirm the robustness of our results for several other corporate events including dividend changes, stock splits and stock repurchases. Earnings news is perhaps the most prominent news event, which unlike many other corporate events, is not voluntary and is a regular feature of corporate calendars. We measure the news content of an earnings announcement by comparing the actual earnings with the analyst consensus forecast in the month prior to the earnings announcement date. We use the standard event study methodology and examine the 3-day abnormal returns around the announcement of the news events. Our analyses incorporate standard control variables that have been identified by prior research to explain the stock price reaction to earnings surprises. Our results indicate that market reacts more to good news during high sentiment periods than during low sentiment periods. Similarly, market reacts more to bad news during low sentiment periods than during
6 While some studies, done over the last decade or so, have documented incidents of over and underreaction of news by documenting medium term drift in returns following the announcement of news (references), this evidence has been challenged on account of inconsistent out-of-sample evidence and on methodological grounds (Brav (2000)). 7 For example, Kothari and Warner (2006) report that more than 500 event studies have been published in top finance journals, many of which rely on the stock market reaction to news as the primary yardstick for ascertaining the value impact of the news.
3

high sentiment periods. We confirm that our results also hold for other corporate events, namely dividend changes, stock splits and stock repurchases.
We also examine the stock returns in the 60 days following the announcement of earnings news to see if the effect of sentiment persists or reverses during this period. The results indicate that sentiment continues to impact the stock price behavior in the period subsequent to the earnings announcement. That is, the upward stock price drift following positive earnings news, commonly documented by prior literature, is greater when earnings are announced in high sentiment periods than those that are announced during low sentiment periods. Similarly, the downward stock price drift following negative earnings news is greater for earnings that are announced during low sentiment periods. In fact, we find that there is no drift associated with negative earnings shocks that are announced during high sentiment periods. This is probably not surprising given that the sentiment measure we use has very high persistence—the autocorrelation coefficient for the monthly Baker-Wurgler index is 0.95 during our sample period. This is also consistent with the recent sentiment literature that argues that the effect of sentiment persists over weekly and monthly frequency, and reverses only at yearly horizons (Brown and Cliff (2004, 2006) and Baker and Wurgler (2006)).
The behavioral finance literature suggests that firms that are more difficult to value and harder to arbitrage are more susceptible to sentiment impacting their stock prices (see, for example, Shleifer and Vishny (1997)). More specifically, Baker and Wurgler (2006) argue that firm size, age, stock price volatility, and growth prospects are the characteristics that delineate firms that are more or less susceptible to market sentiment. Therefore, we examine whether the influence of sentiment is stronger on investor response to news for small firms, young firms, volatile firms, and growth firms. We find that sentiment indeed plays a greater role in determining the stock price reaction to corporate earnings news for these firms than for other firms.
While we document that stock market response to good (bad) news is stronger during high (low) than low (high) sentiment periods, our tests, per se, cannot discern whether stock market overreacts to good (bad) news during high (low) sentiment period or underreacts to good (bad) news during low (high) sentiment periods. For this, we rely on recent studies, example, Baker and Wurgler (2006). These studies find that both high and low sentiment periods contributes to mispricing—stocks that are more prone to sentiment such as small stocks, earn unusually high returns following periods of low returns and earn unusually low returns following periods of high sentiment.
We also consider alternative explanations for our results, but rule them out for being inconsistent with some of the evidence. One possibility is that that investors’ risk aversion changes across periods of high and low sentiment, and that explains market’s differential reaction to news over time. However, we note that for this explanation to hold, stock price response to both good and bad news should be muted during periods of low sentiment. This is because during these times, investors’ increased risk aversion pushes up the discount rate; and
4

any news about the future cash flows is, therefore, worth less in present value terms. Our results are not consistent with this explanation as we find that stock price reaction to bad news is greater during periods of low sentiment. It is also possible that good (bad) news released during high (low) sentiment period has greater information content, and market’s greater response to good (bad) news during high (low) sentiment period simply reflects this differential strength of the news signal. To control for this possibility, we introduce the ex-post earnings change associated with each earnings surprise as an additional variable in our regression analyses. We find that our conclusion remains robust to the inclusion of this variable.
At least two recent papers have documented instances, albeit in narrow settings, where the stock market ignored the firm-level fundamentals apparently under the influence of the broad market sentiment. Lamont and Thaler (2003) document how in the case of equity carve-out of technology companies at the peak of the Internet bubble, investors valued non-technology parent and technology-oriented subsidiary companies at prices that violated the fundamental law of one price. Cooper, Dimitrov and Rau (2001) document that a mere alignment of a company’ name to what is considered fashionable in the market can enhance stock price, even when the operations of the company are little changed. They document that at the peak of the Internet bubble, companies that added dotcom to their names experienced a cumulative abnormal return of 74% in the ten days surrounding the announcement of the name change. Our paper generalizes the findings in these studies by showing that the influence of sentiment on stock market reaction to news extends beyond the narrow settings of these studies.
The rest of the paper is organized as follows. In Section II, we discuss our data selection process and research methodology. In Section III, we report our results on the effect of sentiment on stock price response to earnings news. We then examine the effect of sentiment on stock price response for three other corporate events, namely, dividend changes, stock splits and stock repurchases in Section IV. We conclude the paper in Section V.
II. Data and Research Design
A. Data and Sample Selection
We extract the realized and forecast values of quarterly earnings from the IBES summary file. The IBES data for quarterly earnings is sparse for the years before 1985, so our sample period begins in 1985. We end our sample in 2005, as this is the last year for which the Baker-Wurgler Sentiment Index is available at the time of writing this paper. Since the date of the earnings announcement is critical in our study, we retain only those IBES earnings announcements for which the date of announcement is within one day of the corresponding date in the Compustat dataset. For each earnings announcement, we then define a 3-day event window centered on the date of the event, and compute the cumulative market-adjusted returns (CAR) using data form the Centre for Research in Security Prices (CRSP). For each firm and
5

each report date, the CRSP equally-weighted market returns are subtracted from the raw returns for each of the three days in the event window. The abnormal return for each day is then summed to compute the overall cumulative abnormal return for each earnings announcement.
To analyze the price impact of earnings news in the announcement period, unexpected earnings, UE, are computed as follows.
PriceStockMonththeofBeginningEarningsForecastConsensusEarningsActual −
=UE (1)
Consensus earnings forecast in Equation (1) is the median forecast available in the IBES monthly summary file for the month preceding the earnings announcement date. The stock price in the denominator is the share price as at the beginning the month in which the earnings is announced. In order to ensure stock splits or stock dividends do not impact our results, we remove observations where there is a stock split in the window of -40 to +5 days of the earnings announcement date. Further, to reduce the impact of outliers, we delete observations where unexepected earnings are less than 1% or greater than 99% of the distribution. Finally, consistent with the prior research, which shows earnings response coefficients are essentially zero for firms reporting negative earnings (Hayn (1995) and Lipe, Bryant, and Widener (1998)), we delete observations where firms report negative earnings.
We rely on the Baker-Wurgler measure of sentiment to test the key hypotheses in our paper. The monthly values of this index ending in 2005 are available from the web site of Jeffrey Wurgler8. It is derived through a principal component analysis of six measures of investor sentiment: closed-end fund discount, NYSE share turnover, number of IPOs, share of equity issues in total debt and equity issues, and dividend premium (the log difference of the average market-to-book ratios of payers and nonpayers). Each of these is first orthogonalized to the macroeconomic variables that capture variations in the business cycle, namely growth in industrial production index, consumer durables, consumer nondurables, and consumer services. Positive values of the index represent periods of high sentiment, whereas negative values represent low periods. Baker and Wurgler (2006, 2007) show that this sentiment index does a good job of explaining cross-sectional variation in expected stock returns. Figure 1 depicts the level of the Baker-Wurgler index over our sample period. Quite predictably, the index is negative in the years following the stocks market crashes of 1987 and 2000. May of the years that experience the most bullish values of the index are from the period of the late 1990s.
B. Regression Specification
We measure stock market response to earnings news by the elasticity of stock prices to unexpected earnings at announcement dates. It is widely documented in the extant literature that 8 http://pages.stern.nyu.edu/~jwurgler/
6

stock market responds differently to good and bad earnings. Therefore, in our empirical design, we allow for the separate analyses of positive and negative unexpected earnings. We follow the prior literature (see, for example, Conrad, Cornell and Landsman (2002)) and create two indicator variables, UP and DOWN. The first variable, UP, is set equal to one if the unexpected earnings is positive and zero otherwise; the second, DOWN, is equal to one if the surprise is negative and zero otherwise. We then estimate a regression of the following basic form.
itittitittititit SizexPosSentUEDOWNUEDOWNxPosSentUEUPUEUPRET εαγγββα ++++++= 110100 (2)
In this equation, RETit is the cumulative abnormal return for firm i during the earnings announcement period as defined above. UEUP (UEDOWN) is the product of the unexpected earnings, UE, as defined in Equation (1) above, and the indicator variable, UP (DOWN). This specification permits the slope on UE to be different, conditional on the sign of the earnings surprise. Prior literature shows that the stock price reaction to good news is stronger than the stock price reaction to bad news (Bartov, Givoly and Hayn (2002)).
The variable PosSent in the above equation is an indicator variable that takes the value of one if the investor sentiment at the time of the earnings announcement is positive, and zero otherwise. The interaction variables, UEUP x PosSent and UEDOWN x PosSent, therefore, allow us to test our key hypotheses that stock market responds more to good earnings news during high than low sentiment periods, and more to bad earnings news during low than high sentiment periods. UEUP x PosSent and UEDOWN x PosSent, measure how market’s response to good and bad earnings news, respectively, differs during periods of high sentiment relative to that during periods of low sentiment. The β0 (γ0) in the above equation would thus capture market’s response to good (bad) earnings news when sentiment is low, whereas β0+β1 (γ0+γ1) would capture market’s reaction when sentiment is high. If investors are swayed by the prevailing sentiment in their response to earnings news, we expect β1 to be positive and statistically significant, and γ1 to be negative and statistically significant.
Finally, to control for risk differences not already reflected in excess returns and to control for potential scale differences (Barth and Kallapur (1996)), we also add Size as a control variable in the regression. Size is defined as the decile rank of firm i as at the beginning of the month in which earnings is announced, where the ranks are assigned using the NYSE size breakpoints.
Besides estimating Equation (2), we also estimate the model after adding a number of control variables as specified below.
7

itit
itititititit
tititittitit
itititititit
tititittititit
SizexEVolUEDOWNxSizeUEDOWNUEDOWNxUEDOWN
xTimeUEDOWNxFGrowthUEDOWNxPosSentUEDOWNUEDOWNxEVolUEUPxSizeUEUPUEUPxUEUP
xTimeUEUPxFGrowthUEUPxPosSentUEUPUEUPRET
εαγγγ
γγγγβββ
ββββα
++
+++
++++
+++
++++=
1
654
3210
654
32100
(3)
The first control variable we add in the model is the ex post realization of growth in earnings. It is possible that earnings news during positive and negative sentiment periods might contain different information about future earnings. To control for this possibility, we add the interaction variables UEUP x FGrowth and UEDOWN x FGrowth in the above equation to allow for the differential response of the market to earnings news that might carry more information about future earnings. FGrowth is the difference between the 4-quarter-ahead earnings and the earnings in the current quarter, scaled by the stock price at the beginning of the month. The variable FGrwoth is set to missing whenever the current earnings are zero, since the percentage growth cannot be calculated in such cases.
The other control variables we add in Equation (3) are all motivated by the evidence in the extant literature, which find these to be important in explaining stock market response to earnings news. For instance, Francis and Schipper (1999) document that the stock market response to earnings news changes over time. To account for this trend in earnings response coefficient, we create the variable Time which is a linear time trend variable. The interaction terms UEUP x Time and UEDOWN x Time allow the response to earnings news to change over time. Furthermore, the variables UEUP x |UEUP| and UEDOWN x |UEDOWN| allow for non-linearity in market’s response to earnings news. Lipe, Bryant, and Widener (1998) document that market’s responds proportionally less to positive and negative earnings news that are extreme. They argue that extreme earnings consist of a greater proportion of temporary and one time items and hence are of lower persistence, leading to a lower earnings response coefficient. Similarly, the variables UEUP x Size and UEDOWN x Size allow for the differential response of market to earnings news of small and large firms. Larger firms have higher analyst coverage and are covered more widely in the news media. Thus prices anticipate the information contained in an earnings surprise to a greater extent in large firms than in small firms. Finally, the variables UEUP x EVol and UEDOWN x EVol allow for the differential impact of earnings news for firms with greater earnings volatility. Firms with greater volatility in earnings tend to have lower persistence due to higher proportion of one time special items, and this leads to a lower earnings response coefficient for higher (lower) volatility firms. EVol is computed as the standard deviation of previous four quarters’ actual earnings divided by the beginning of the month stock price. Omitting such control variables would bias the coefficients downwards (Collins et al. 1989).
The behavior finance literature argues that the impact of behavioral biases is greater for stocks that are harder to value and difficult to arbitrage (see, for example, Shleifer and Vishny
8

(1997)). It is, therefore, likely that sentiment affects the stock price of such firms more than the prices of other firms (Lemmon and Portniaguina (2006), Qiu and Welch (2006), Brown (2006) Baker and Wurgler (2006, 2007)). There seems general agreement in the recent sentiment literature that small stocks are a natural candidate to fit this description. The trading in these stocks may be more dominated by small investors that might be more prone to sentiment, these stocks also tend to be difficult to value, and short-sale constraints tend to be more binding for such stocks. Accordingly, many of the recent papers establish the importance of sentiment for asset pricing by relating the lagged values of sentiment with the excess returns small stock earn relative to the returns on large stocks. Given this evidence, we hypothesize that the effect of sentiment on stock market response to news that we hypothesize is exacerbated for small stocks.
In addition, Baker and Wurgler (2006) argue that, besides small stocks, certain other categories of stocks are also more prone to sentiment. They find that young stocks, high volatility stocks, unprofitable stocks, non-dividend-paying stocks, extreme growth stocks, and distressed stocks are also more prone to sentiment. In our sample, we remove firms that report negative earnings from our sample, as noted earlier, so we cannot investigate profitability as a firm attribute in our cross-sectional tests. However, for all the other categories of stocks, young stocks, high volatility stocks, non-dividend-paying stocks, extreme growth stocks, and distressed stocks, we test the hypotheses that the impact of sentiment on stock market response to news is greater for stocks with these characteristics.
For each of these cross-sectional characteristics, we compute the value of each by following closely the computations in Baker and Wurgler (2006). All firm characteristics, except dividend payments and book values, are computed at monthly frequency using the CRSP files. Size is represented by the market capitalization which is computed for each stock at each month end using the CRSP dataset. Age is computed as the number of years since the firm’s first appearance on CRSP, measured to the nearest month. Stock return volatility is measured as the standard deviation of monthly returns over the preceding 12 months. Dividend payouts are noted from Compustat and are computed once a year at the end of each June. Labeling of growth and distressed stocks is done using the book-to market ratios of the stocks. The book values are from Compusat and are computed at the end of each June, using the information contained in the financial statements of the year ending in the preceding December. These book values are then compared with the market value of the stocks for each month to compute monthly book-to-market ratios.
For each attribute, except for the classification of payers versus non-payers, we then rank all available firms within each month into deciles using the NYSE breakpoints. Firms that fall in the bottom 30% and top 30% are labeled as those with low and high values, respectively, with respect to the attribute. For instances, stocks that fall in the bottom (top) 3 deciles of size in each month are labeled as small (large) stocks. The book-to-market differs from the other characteristics in the sense that it helps identify both growth and distressed stocks. As in Baker and Wurgler (2006), we label the stocks with the highest 30% of the book-to-market ratios as the distressed stocks, and those with the lowest ratios as growth stocks. This labeling of stock
9

characteristics is then matched to the earnings announcements of the subsequent month. As noted above, following Baker and Wurgler, the classification of firms into payers versus non-payers is done once a year at the end of June. This identification then holds for the earnings announcements in the subsequent 12-month period.
To investigate cross-sectional differences in the impact of sentiment, we estimate Equation (2) separately for the sub-samples of stocks, which are created using each of the characteristics. For instance, to investigate whether firm size helps identify cross-sectional differences in the impact of sentiment. We divide our sample into three groups: small stocks (bottom 30%), medium-sized stocks (middle 40% of the stocks), and large stocks (top 30% of the stocks). We then estimate Equation (2) for each of the sub-group. If small stocks are more prone to sentiment, then we should observe that the economic and statistical significance of the interaction variables involving sentiment should be especially more pronounced for the sample of small stocks. The significance of the sentiment variables should diminish or disappear for large stocks. We follow the same procedure testing the role of the other four characteristics: age, stock return volatility, dividend payouts, and book-to-market ratios.
C. Summary Statistics
Our sample includes 166,134 earnings announcements over the years 1985-2005. In Table 1, we report the number of total quarterly earnings announcements for each year in Column (2). The number increases monotonically from 1985 through to 1998, after which it declines a little, especially after the bursting of the tech bubble. Looking at Columns (9) through (11), which depict the coverage of our sample relative to all the stocks in the CRSP NYSE/AMEX/NASDAQ database, it looks as if the increase in the number of firms in the earlier years of the sample is driven by both an increase in the number of the listed firms as well as an increase in coverage of firms by analysts. However, in later years of our sample, variations in the number of firms are primarily driven by changes in the number of listed firms. In general, the firms included in our sample represent 50% of all listed firm on NYSE/AMEX/NASDAQ by number and about 85% by market capitalization. The large median market capitalization reported in Column (12) reflects the well-known large firm bias of the analyst forecast data.
In Columns (3) through (8) of Table 1, we report the break up of the earnings announcements into those that carry positive shocks, negative shocks and no shocks. This last category represents the incidents where actual earnings were the same as that anticipated by the consensus analyst forecast. As the last row of the table indicates, across all year, the proportion of positive, negative and no-news earnings shocks has been 53%, 31% and 16%, respectively.
However, it is instructive to note the secular trends in the proportions of positive, negative and no-news earnings shocks. We report the proportion of positive, negative and no news earnings announcements as a function of the total earnings announcements for each year of our sample in Columns (4), (6) and (8), respectively. The proportion of negative earning shocks
10

experience a significant decline during our sample period. Negative shocks were about 50% of the total earnings shocks at the beginning of our sample in 1985. This proportion declines to slightly above 20% towards the later part of our sample. This drop in negative shocks has been accompanied by increases in the proportions of positive and no-news earnings announcements. The proportion of positive shocks increases from 40% to 60% during our sample period, whereas the proportion of no-news earnings announcements increases from about 6% to around 15%. In an unreported regression of the ratio of positive to negative earnings shocks on a linear time trend, the coefficient of the time trend is hugely statistically significant. A detailed investigation of what might explain the reduction in bad-news earnings announcements over time is beyond the scope of this paper, but it is plausible that markets have become increasingly adept at forecasting bad corporate earnings. Alternatively, managers may be more forthcoming in disclosing bad news, or/and may be manipulating reported earnings more to match the analyst forecasts.
More relevant issue from the perspective of our paper might be as to how the proportions of positive and negative earnings shocks vary with the prevailing sentiment. In untabulated results, we regress the ratio of positive to negative earnings shocks on the sentiment index and a linear time trend. While the coefficient for the sentiment index turns out to be positive, it is statistically insignificant. This is perhaps expected, in that we measure expectations of actual earnings fairly close to the date of the announcement of actual earnings, so there is no reason to expect that there should systematically be more positive (negative) shocks during periods of high (low) sentiment.
The summary statistics of the key variables in Equation (3) are reported in Table 2. The mean (median) 3-day abnormal return on the announcement of earnings is 0.37% (0.18%). This is the average response to all earnings shocks including positive, negative and no-news shocks. The range of these abnormal returns is from -24% to +24%. Baker-Wurgler Sentiment Index ranges from -0.648 to 1.994, with a mean (median) of 0.277 (-0.016). The earnings volatility, which is computed as the standard deviation of quarterly earnings of the last 4 quarters scaled by stock price, has a mean (median) of 0.87% (0.38%). The mean (median) growth in earnings, relative to that of the same quarter in the prior year, scaled by stock price is -5.43% (5%). The mean value of the variable Size, which is the size decile rank of firms using the NYSE breakpoints, is 4.64.
III. Stock Price Response to Earnings News across Periods of Positive and Negative Investor Sentiment
We report the results of our regression estimates in Table 3. In Column (2), we begin by estimating our base regression model in Equation (2) without the interaction variables involving sentiment. In this specification, the intercept captures the stock price response to those earnings announcements that equal the consensus analyst forecast and hence contain minimal information
11

content. Perhaps expectedly, therefore, the estimate for the intercept is economically small and statistically insignificant. The coefficient for the variable FEUP, which captures the sensitivity of stock price to positive earnings shocks, is 3.196 and is highly statistically significant with t-statistic of 65.6. This is hardly surprising, and is consistent with a large literature in accounting and finance which documents that earnings surprises contains strong information content, and that stock price reacts to this information. The coefficient of FEDOWN, which depicts stock price sensitivity to negative earnings shocks is 1.32 and is highly statistically significant with t-statistics of 30.2. Again, this is consistent with stock price moving in the direction of the earnings surprise. Further, the evidence of a larger coefficient for FEUP and FEDOWN is also consistent with the extant literature that finds that positive earnings surprises are usually taken to be more informative by the market than corresponding negative coefficients, possibly due to the possibility of managers taking earnings bath (see, for example, Conrad et al. 2002). The coefficient for the variable Size is negative and statistically significant. This is consistent with the unconditional returns of small stocks being greater than those on large stocks during our sample period.
In Column (2) of Table 3, we report the results of estimating Equation (2) with the interaction variables that capture the effect of sentiment on stock market sensitivity to positive and negative earnings shocks. In this specification, the coefficient for the variable FEUP captures market’s response to positive earnings shocks during periods of negative market sentiment, whereas the coefficient of the interaction variable, FEUPxPosSent, indicates whether this response is different during periods of positive sentiment. The coefficient for FEUP reported in Column (3) is 3.09 (t-statistic = 49.4). The coefficient for the interaction variable is 0.24 with a t-statistics of 2.7. A positive and statistically significant coefficient indicates a stronger reaction of the market to the announcement of positive earnings shocks when the prevailing investor sentiment is positive. In economic terms, these coefficient estimates translate into stock price sensitivity to positive earnings shocks being 3.09 during periods of negative sentiment, and increases to 3.33 [=3.09+0.24] during periods of positive sentiment. This reflects an increase of about 8%. However, stronger effect of sentiment is observable for the negative earnings shocks. Not only is the coefficient for FEDOWNxPosSent is negative and highly statistically significant (t-statistic = 6.3), its economic magnitude -0.45 is large relative to the coefficient of FEDOWN which is 1.36 (t-statistic = 26.3). These numbers indicate a strong variation in the stock market sensitivity to negative earnings shocks across periods of positive and negative sentiment. The stock price sensitivity to negative earnings shocks is 1.36 during periods of negative sentiment and reduces to 0.92 [=1.36-0.44] during periods of positive sentiment. This represents a decrease of 32% in the sensitivity of the stock price to negative earnings shocks from negative to positive sentiment periods.
To check the robustness of our results to the inclusion of other control variables, we report the results of estimating Equation (3) in Columns (4) of Table 3. The key conclusions, regarding the role of sentiment in market’s response to positive and negative earnings shocks remain unchanged with the inclusion of these control variables. Nevertheless, it is instructive to note the coefficient estimates of the control variables. FGrowth is the control variable that
12

captures the ex-post growth of actual earnings from the current quarter to the same quarter next year, and is meant to control for the possibility that earnings shocks announced during periods of positive sentiment might contain differential information about future corporate profit growth than those announced during periods of negative sentiment. The coefficient for the interaction variable FEUPxFGrowth is positive and statistically significant. This is consistent with the notion that the market has some ability to differentiate between earnings shocks based on what they entail for future corporate earnings. Similarly, the interaction variable FEDOWNxFGrowth is negative and statistically significant, again suggesting that market responds more to negative earnings shocks that are followed by less earnings in the future.
The other control variables in Column (4) were motivated by the prior literature finding these to be useful explanatory variables for stock market sensitivity to earnings news. In general, the coefficient estimates for these have the signs that are expected and are consistent with the prior studies. The coefficients for the non-linear terms, FEUPxAbs(FEUP) and FEDOWNxAbs(FEDOWN), are negative and significant, indicating that stock price response is proportionally less for large positive and negative earnings shocks. The coefficient for the interaction term FEUP x Size is negative and significant, indicating that market responds more to the positive earnings shocks for small firms. This is consistent with the notion of greater information asymmetry and hence greater information content of earnings shocks for small firms. However, the corresponding coefficient for FEDOWNxSize is positive and statistically significant, indicating that negative earnings shocks are treated more important for larger firms. Perhaps the negative news shocks are seen as transitory for small firms. Furthermore, it is also interesting to observe the negative coefficients for FEUPxEVol and FEDOWNxEVol, indicating that market responds less to the earnings shocks of companies whose earnings are more volatile.
We also examine the stock returns in the 60 days following the announcement of earnings news to see if the effect of sentiment persists or reverses during this period. The results, reported in Table 4, indicate that sentiment continues to impact the stock price behavior in the period subsequent to the earnings announcement. That is, the upward stock price drift following positive earnings news, commonly documented by prior literature, is greater when earnings are announced in high sentiment periods than those that are announced during low sentiment periods. Similarly, the downward stock price drift following negative earnings news is greater for earnings that are announced during low sentiment periods. In fact, we find that there is no drift associated with negative earnings shocks that are announced during high sentiment periods. This is probably not surprising given that the sentiment measure we use has very high persistence—the autocorrelation coefficient for the monthly Baker-Wurgler index is 0.95 during our sample period. This is also consistent with the recent sentiment literature that argues that the effect of sentiment persists over weekly and monthly frequency, and reverses only at yearly horizons (Brown and Cliff (2004, 2006) and Baker and Wurgler (2006)).
So far in our regression analyses, we have used the indicator variable PosSent to examine how earnings response coefficients vary across periods of bullish and bearish sentiment periods. Our conclusions about the significance of the sentiment remain robust to the use of sentiment as
13

a continuous variable in the interaction terms.
IV. Cross-Sectional Variation in the Role of Sentiment
A central theme in the behavior finance literature is that the impact of behavioral biases is not uniform across all stocks. Specifically, it is argued that behavioral biases would have greater impact on stocks that are harder to value and difficult to arbitrage (see, for example, Shleifer and Vishny (1997)). There seems general agreement in the recent sentiment literature that small stocks are a natural candidate to fit this description (Lemmon and Portniaguina (2006), Qiu and Welch (2006), Brown (2006) Baker and Wurgler (2006, 2007)). In addition, Baker and Wurgler (2006) argue that, besides small stocks, young stocks, high volatility stocks, non-dividend-paying stocks, extreme growth stocks, and distressed stocks, are also more prone to sentiment. To test the hypotheses that firms that have greater limits on arbitrage are more influenced by sentiment, we estimate Equation (2) separately for sub-samples of stocks sorted on theses characteristics, and report the results in Table 5. In Panel A, we report the results of estimating Equation (2) for three sub-samples sorted on firm size. Panels B through E report similar results for sub-samples sorted on age, volatility, dividend payout and growth/distressed, respectively.
Examining Panel A, it is evident the effect of sentiment is more pronounced for small stocks, diminishes for the mid-sized stocks, and disappears altogether for the largest 30% of the stocks. In Column (2), the coefficients for both the interaction variables FEUPxPosSent and FEDOWNxPosSent are statistically significant indicating that the sensitivity of stock price to earnings shocks varies with sentiment for small stocks. The economic significance of the effect of sentiment is specially striking for the bad earnings news. The coefficient for FEDOWN is 1.16 (t-statistic = 15.9) which when compared to the coefficient of FEDOWNxPosSent of -0.54 (t-statistic = 5.7) suggest that the sensitivity of stock price to negative earnings shocks is 0.617 [=1.16-0.54] during positive sentiment periods and increases to 1.16 during negative sentiment period–an increase of 88%. For mid-sized stocks, the results reported in Column (3) show that sentiment influences sensitivity of stock price to positive news only, as the coefficient for FEUPxPosSent is statistically significant where the coefficient for FEDOWNxPosSent is not significant. Interestingly, both the interaction variables are insignificant in Column (4) indicating that for large firms, sentiment does not play an role in the sensitivity of stock prices to news. Overall, the results in Panel A are in line with the recent sentiment literature that argues that sentiment primarily influences small stocks where valuations are more subjective, where small investors are a more dominant proportion of the investor mix, and where arbitrage is difficult (see, for example, Baker and Wurgler (2007)).
The differential impact of sentiment on young firms is investigated in Panel B. Again the results are similar to those reported in panel A. Comparing the economic and statistical significance of the two interaction variables involving sentiment across Column (2) through (4) reveals that sentiment sways sensitivity to news of primarily young firms. In Column (3), which
14

report the estimates for young firms, the interaction variables, FEUPxPosSent and FEDOWNxPosSent, have the expected signs and are both statistically significant. In Column (4), which reports the estimates for old firms, the coefficient for FEDOWNxPosSent is statistically insignificant, indicating that the sensitivity of stock price to negative earnings shocks does not vary across positive and negative sentiment periods for old firms. Interestingly, the coefficient for FEUPxPosSent in Column (4) is of negative sign and is statistically significant (t-statistic = 2.6). This supports the idea in Baker and Wurgler (2007) that the effect of sentiment might even reverse for some of the stocks that are categorized by sentiment-driven investors more as bond-like investments. They argue that firms that are old, large, less volatile and that pay stable atream of dividends might be perceived by investors as bond-like, and might experience overpricing (underpricing) in periods of low (high) as investors flee to quality (look got growth).
The stock return volatility is another proxy for how likely the sentiment is to impact prices of a firm. In Panel C, we report the results of estimating Equation (2) on sub-samples of stock sorted on the volatility of the monthly stock returns over the preceding 12-month period. The results are again broadly consistent with the notion that sentiment plays a larger role in determining the sensitivity of stock price to earnings shocks of volatile than stable stocks. While, the coefficient for FEUPxPosSent is insignificant across all three sub-sample of stocks, the coefficient for FEDOWNxPosSent is economically and statistically more significant for volatile stocks in Column (2), and becomes insignificant for stable stocks in Column (4).
The dividend payers versus non-payers might be another useful distinction to identify firms whose prices are more likely to be affected by investor sentiment. In Panel D of Table 5, Column (2) reports the estimates of Equation (2) for non-payers, that is, firms that do not pay any dividend in the preceding year. In Column (4), we report the results for firms that fall in the top 30% in terms of their dividend payout among the group of the dividend paying firms. All the remaining firms are grouped in the middle sample, and the estimates for this group of firms are reported in Column (3). Examining Column (2), the interaction variable FEUPxPosSent is positive with a t-statistic of 1.6, so the effect of sentiment on sensitivity of stock price to positive earnings shocks seems limited for non-payers, However, the interaction variable FEUPxPosSent is negative, and is economically and statistically significant, indicating that sensitivity of stock price to negative earnings shocks vary significantly across positive and negative sentiment periods. In contrast to non-payers, the evidence for firms that pays the highest dividends reported in Colum (4) is mixed. While there is evidence of the sensitivity to negative shocks to increase during periods of negative sentiment, the interaction variable capturing the effect of sentiment on stock price sensitivity to positive shocks, FEUPxPosSent, is of the opposite sign than one would expect if sentiment were to sway stock price sensitivity in the direction of the sentiment.
Finally, in Panel E of Table 5, we examine whether the relation between sentiment and stock market sensitivity to news exacerbate for distressed and growth firms relative to other firms. We label firms with the highest 30% of the book-to-market ratios as distressed firms and those with the lowest 30% of the book-to-market ratios as growth firms. The results indicate that the effect of sentiment is stronger for distressed firms, reported in Column (2) is stronger than
15

the firms with the medium levels of book-to-market ratios, depicted in Column (3). This is consistent with the notion that distressed firms are more prone to sentiment. However, the results for growth firms reported in Column (4) are not consistent with out hypothesis that sentiment plays a bigger role for the growth firms. Both the interaction variables involving sentiment, FEUPxPosSent and FEDOWNxPosSent, are insignificant for growth stocks.
In summary, our results in Table 5 show that sentiment plays a greater role in stock price sensitivity to news for small than for large stocks. There is also evidence that the role of sentiment is more pronounced for exacerbated for young stocks, high volatility stocks, non-dividend-paying stocks and distressed stocks. Overall, the results are consistent with the notion that sentiment plays more critical role for firms that are more difficult to value and harder to arbitrage. When sentiment is high, investors respond more to the good earnings news and less to the bad earnings news for these firms.
V. Sentiment and Stock Price Response to Other Corporate Events
Besides earnings announcements, other corporate events might also convey information about the firm to the market. In this section, we examine three such events: changes in dividends, the announcements of stock splits and the announcements of stock repurchases. Each of these events has been investigated in earlier studies, which find that stock price responds to each of these corporate news. Our focus in this section is to examine whether the sensitivity of the stock price to the announcement of these events varies systematically across periods of positive and negative sentiment. Dividend changes could be a good or bad news depending on whether the change is upward or downward, respectively. Stock prices should be more sensitive to dividend increases (decreases) when sentiment is positive (negative) than when sentiment is negative (positive). In contrast, stock splits and repurchases are good-news events, and we hypothesize that market would respond more positively to these events when sentiment is positive.
A. Sentiment and Market’s Response to the Announcement of Changes in Dividends
To examine how sentiment influences stock price sensitivity to dividend changes, we extract the dividend data from CRSP. As in prior studies, we focus on changes in regular quarterly dividends (CRSP distribution code = 1232) for the companies listed on NYSE and AMEX. A dividend change is defined as the change in dividend over successive quarters divided by the dividend in the prior quarter. We exclude those dividend announcements whereby there was any other distribution from 10 days before the prior dividend to the 10 days after the current dividend. We also exclude the dividend announcements which occurred within 10 days of the announcements of actual earnings. Finally, we include only dividend announcements for common stocks only (share codes = 10 and 11). In total, we obtain a total of 52,832 observations of changes in regular quarterly dividends over the period 1985-2005. These include 6,575
16

dividend increases, 45,680 no changes, and 577 dividend decreases.
Using these data of dividend changes, we estimate a model similar to Equation (2), as specified below.
itittitittititit SizexPosSentDivDOWNDivDOWNxPosSentDivUPDivUPRET εαγγββα ++++++= 110100
(4)
The variable DivUp is the amount of dividend change when the dividend change is positive, and zero otherwise. The interaction variable DivUpxPosSent allows for the response of the market to the announcement of dividend increases to vary across periods of positive and negative sentiment. If investors react more strongly to dividend increases when sentiment is positive, this interaction variable would be positive and statistically significant. Similarly, DivDOWN is the amount of dividend change when the dividend change is negative, and zero otherwise. The interaction variable DivDownxPosSent allows us to examine whether the market’s response to dividend decreases varies across periods of positive and negative sentiment. A negative and statistically significant coefficient would indicate that market responds less to the news of dividend decreases during periods of positive sentiment. The regression is estimated using OLS and the pooled firm-event data. As before, to mitigate the effect of extreme observations on the regression estimates we winsorize the extreme 1% observations of dividend increases and decreases. The dependent variable of cumulative 3-day market-adjusted returns is also winsorized at 1% and 99%.
In Panel A of Table 6, we report the summary statistics of the variables included in Equation (4), whereas in Panel B, we report the estimates of the regression model. As expected, the coefficient for DivUp is a positive 0.013, and is statistically significant. This is consistent with the prior literature that documents positive stock price response to dividend increases. The variable of interest in our study, however, is the interaction variable DivUpxPosSent, which captures how stock price sensitivity to dividend increases differs across periods of positive and negative sentiment. The estimated coefficient for this variable is a positive 0.007 with a t-statistics of 1.85. This magnitude is economically very significant when compared to the coefficient for DivUp. Stock price sensitivity is 0.013 during periods of negative sentiment, and increases by more than 50% to 0.020 [=0.013 +0.007) during periods of positive sentiment.
Turning to dividend decreases, the coefficient for the variable DivDown captures the sensitivity of the stock price to dividend decreases during periods of negative sentiment, whereas the interaction variable DivDownxPosSent allows this sensitivity to change during periods of positive sentiment. As reported in Panel B of Table 6, the variable DivDown is significant and positive, indicating that stock price falls in response to the announcement of dividend decreases. The interaction variable DivDownxPosSent is negative (t-statistic of 1.9), consistent with the market responding less to dividend decreases in periods of positive sentiment. The coefficient estimate is also economically significant when compared to the coefficient of DivDown. Overall, our results in Table 6 indicate that stock price sensitivity to good and bad dividend news also
17

varies with sentiment, in a fashion that is broadly consistent with the evidence for the earnings news.
B. Sentiment and Market’s Response to the Announcements of Stock Splits
Another corporate event that is treated as informative by market participants is stock splits. Unlike the announcements of earnings or dividends that could entail positive news, negative news or no news, stock splits are commonly perceived to be a positive information signals. To investigate whether market’s positive reaction to the announcement of stock split is more pronounced when sentiment is high we proceed as follows. We extract all (i.e., 8,362) the stock splits and stock dividend announcements (CRSP distribution codes: 5523 and 5533) made by companies listed on NYSE/AMEX/NASDAQ over the period 1985-2005. This sample includes only those announcements whereby new stocks issued constitute at least 25% of the original issue. Finally, we include only common stocks (share codes = 10 and 11).
Using this sample of stock splits, we estimate the following regression model.
ittitittit TimeSizeSpFactorPosSentRET εγγγβα +++++= 21000 (7)
As before, RET is the 3-day event period return around the announcement of stock splits, and PosSent is an indicator variable that takes a value of one when the (monthly) Baker-Wurgler Sentiment Index is positive, and zero otherwise. SpFactor is the percentage of the new stocks issued. Size is the size rank of the stock as at the beginning of the earnings announcement month. Time is the time trend variable that aims to capture any variation over time in market’s response to stock splits. As before, we winsorize the continuous variables in the above regression, RET and SpFactor, at 1% and 99% to avoid extreme values influencing our estimates. The regression is estimated using OLS and the pooled firm-event data.
In Table 7, we report the results of our estimation. The coefficient for the variable, PosSent, is 0.005 with a t-statistic of 4.1. A positive coefficient indicates that the response of market to the announcement of stock splits is greater when sentiment is positive. The evidence for stock splits, therefore, is consistent with the evidence reported earlier for earnings and dividend news, and provides support to the notion that the prevailing sentiment plays an important role in how the market perceives a new information signal.
The coefficients for the control variables have the expected signs. SpFactor has a positive coefficient, indicating that market treats the announcement of stock split as greater positive news when the percentage of the new stock issued is larger. The negative coefficient for Size indicates that stocks splits of smaller companies carry greater positive news. Finally, the positive coefficient for the time trend variable indicates that market’s response to split announcements has been increasing over time.
18
C. Sentiment and Market’s Response to the Announcements of Share Repurchases
The last corporate event that we focus on in this section is share repurchase. Several existing papers document that market perceives the announcements of share repurchases as a positive signal, and stock prices of firms that announce repurchase programs go up. If sentiment were to influence the perceptions of the market as to how positive an announced share repurchase program is, we should expect market’s response to share repurchases to be stronger during periods of positive sentiment, and vice versa. To investigate this, our sample of share repurchases over the period 1980-2000 comes from Chan, Ikenberry and Lee (2004). We thank them for providing us their data. The total number of repurchases we obtain from their sample are 6,170 over the period from 1980-2000. This excludes those firm-event observations where another repurchase announcement was made by the same company over the previous 5 days. We also retain only those repurchases that are for common stocks (share codes = 10 and 11).
Using this sample of repurchases, we estimate the following model.
itittitittit iorRETTimeSizeRpRatioPosSentRET εγγγγβα ++++++= Pr321000 (8)
The variables, RET, PosSent, Size and Time are as defined in earlier models. RpRatio is the ratio of the number of shares to be repurchased divided by the total number of outstanding shares at the time of the repurchase announcement. PriorRET is the return decile, based on returns over the prior 12 months, which the stock belongs to as at the beginning of the month in which the repurchase is announced. It captures the relative return performance of the stock. The literature on repurchases identifies it as one of the key variables that determine the stock market reaction to repurchases. We winsorize the continuous variables in the above regression, RET, RpRatio and PriorRET, at 1% and 99% to avoid extreme values influencing our estimates. The regression is estimated using OLS and the pooled firm-event data.
We report the estimates of the above model in Table 8. Examining the control variables first, we note that most of the variables have coefficients consistent with the prior literature. The coefficient for RpRatio is positive and significant; indicating that stock price response increases with the size of the announced repurchase program. The negative and significant coefficient for PriorRet indicates that stocks with a greater recent price run-up experience a smaller stock price response on repurchase announcements. The negative coefficient for Size suggests a greater response of market to repurchase announcement of smaller firms. Finally, the coefficient for time trend variable, Time, is negative and significant. This reflects that repurchase announcements are increasingly perceived as less informative by the stock market.
Our primary focus in this regression, however, is on the coefficient for PosSent that captures the differential response of stock market to repurchase announcements during periods of positive sentiment. The estimated coefficient is 0.0039 with a t-statistic of 1.98. A positive and statistically significant coefficient indicates that market response to repurchase announcements is
19

greater during periods of positive sentiment, and is consistent with the evidence presented earlier for earnings, dividend and stock split news.
VI. Conclusion
One strand of the behavioral finance literature has recently emerged that adopts a top-down approach of examining the impact of investor biases on financial markets. This literature assumes that many of the bottom-up behavioral models lead to similar form of variation over time in mass psychology, and focuses on the measurement and the influence of this reduced form aggregate sentiment (Baker and Wurgler (2006, 2007); Lemmon and Po (2006), Qiu and Welch (2006), sports sentiment (2007)). This literature demonstrates that it is quite possible to measure investor sentiment, and that waves of sentiment have clearly discernable, important and regular effects on stock market. To the extent that measures of investor sentiment developed in this literature are reasonable proxies of aggregate investor biases, they open up a new opportunity for learning how investor psychology influence stock market response to news.
In this paper, we document that the measure of investor sentiment developed by Baker and Wurgler (2006, 2007) is systematically related to the stock price response to corporate news. Specifically, we find that stock price response to good news increases with the prevailing sentiment, whereas stock price response to bad news decreases with the prevailing sentiment. This is consistent with the hypothesis that the prevailing market-wide sentiment sways investor response to corporate news. We confirm the relation between sentiment and stock price response for earnings news, as well as for other corporate news including dividend changes, stock splits and stock repurchases. Moreover, the relation between sentiment and stock price response is especially pronounced for stocks that have more subjective valuations and face greater limits on arbitrage—small stocks, young stocks, volatile stocks, non-dividend paying stocks and distressed stocks.
Our study adds to the recently emerging literature that documents the impact of sentiment on financial markets. Our finding that stock price response to good (bad) news increases (decreases) systematically with the bullishness of the prevailing investor sentiment not only helps identify a channel through which sentiment causes mispricing but also suggests that the importance of sentiment documented in the recent literature is not spurious. Our results also provide fresh evidence to support the assertion that stock prices are more volatile than justified by news about fundamentals. Our results are inconsistent with the notion of the informational efficiency of the market in responding to new information, and raises doubt on the usefulness of event studies to measure the value relevance of various corporate events.
20

References
Baker, M. and J. Wurgler, 2006a, Investor sentiment and the cross-section of stock returns, Journal of Finance 61, 1645-1680.
Baker, M. and J. Wurgler, 2007, Investor sentiment in the stock market, Journal of Economic Perspectives 21, 129-151.
Barberis, N. and R. Thaler, 2003, A survey of behavioral finance, Handbook of the Economics of Finance. volume 1, part 2, 1053-1128.
Bartov, E., D. Givoly and C. Hayn, 2002, The rewards to meeting or beating analyst expectations, Journal of Accounting and Economics 33(2), 173-204.
Battalio R. and R.R. Mendenhall, 2005, Earnings expectations, investor trade size, and anomalous returns around earnings announcements. Journal of Financial Economics 77, 289-319.
Brav, A., 2000, Inference in long-horizon event studies: A Bayesian approach with application to initial public offerings, Journal of Finance 55, 1979-2016.
Brown, G.W. and M.T. Cliff, 2005, Investor sentiment and asset valuation, Journal of Business 78, 405-440.
Black, F., 1986, Noise, Journal of Finance 41, 529-543
Chan, K., D. Ikenberry and I. Lee, 2004, Economic sources of gains in stock repurchases, Journal of Financial and Quantitative Analysis 39, 461-479.
Collins, D., and S. P. Kothari, 1989, An analysis of inter-temporal and cross-sectional determinants of the earnings response coefficient, Journal of Accounting and Economics 11, 143-189.
Conrad, J., B. Cornell and W. Landsman, 2002, When is bad news really bad news? Journal of Finance 57, 2507-2532.
Cooper. M.J., O. Dimitrov, and P.R. Rau, 2001, A Rose.com by any other name, Journal of Finance 56, 2371-2388.
Edmans, A., D. Garcia and Ø. Norli, 2007, Sports sentiment and stock returns, Journal of Finance 62, 1967-1998.
Fama, E.F., 1991, Efficient capital markets: II, Journal of Finance 46, 1575-1617.
Hayn, C., 1995, The information content of losses, Journal of Accounting and Economics 20, 125-153.
Hirshleifer, D., 2001, Investor psychology and asset prices, Journal of Finance 56, 1533-1597.
Hirshleifer, D. and T. Shumway, 2003, Good day sunshine: Stock returns and the weather, Journal of Finance 58, 1009-1032.
21

22
Kleidon, A.W., 1986, Variance bound tests and stock price valuation models, Journal of Political Economy 94, 953-1001.
Kothari, S.P. and J.B. Warner, 2006, Econometrics of Event Studies, in B. Espen Eckbo (ed.), Handbook of Corporate Finance: Empirical Corporate Finance, volume A, Elsevier/North Holland, Chapter 1.
Kumar, A. and C. Lee, 2006, Retail investor sentiment and return comovements, Journal of Finance 61, 2451-2486.
Lamont, O.A. and R.H. Thaler, 2003, Can the market add and subtract? Mispricing in tech stock carve-outs, Journal of Political Economy 111, 227-268.
Lee, M. C., 1992, Earnings news and small traders: An intraday analysis. Journal of Accounting and Economics 15, 265-302.
Lemmon, M., and E. Portniaguina, 2006, Consumer confidence and asset prices: Some empirical evidence, Review of Financial Studies 19, 1499-1529.
Lipe, R., L. Bryant, and S. Widener, 1998, Do nonlinearity, firm-specific coefficients, and losses represent distinct factors in the relation between stock returns and accounting earnings? Journal of Accounting and Economics 25, 195-214.
Puri, M. and D.T. Robinson, 2007, Optimism and economic choice, Journal of Financial Economics 86, 71-99.
Ross, S., 2005, Neoclassical Finance, Princeton University Press, Princeton, N.J.
Shleifer, A. and R.W. Vishny, 1997, The limits to arbitrage, Journal of Finance 52, 35-55.
Shiller, R.J., 1981, Do stock prices move too much to be justified by subsequent changes in dividends?, American Economic Review 71, 421-436.
Shiller, R.J., 2005, Irrational Exuberance. 2nd edition, Princeton University Press.
Statman, M., S. Thorley and K. Vorkink, 2006, Investor overconfidence and trading volume, Review of Financial Studies 19, 1531-1565.
Qiu L. and I. Welch, 2006, Investor sentiment measures, working paper. Brown University.
Yu, J. and Y. Yuan, 2006, Investor sentiment and the mean-variance relation, working paper, University of Pennsylvania. Available at SSRN: http://ssrn.com/abstract=831487

Table 1 Yearly Summary Statistics
This table reports the yearly summary statistics of our earnings news sample. The time period ranges from 1985 to 2005. We extract the realized and forecast values of quarterly earnings from the IBES summary file. We retain only those earnings announcements for which the date of announcement in IBES is within one day of the corresponding date in the Compustat dataset. Earnings surprises are computed by subtracting the consensus analyst forecast from the actual earnings, where consensus forecast is the median forecast for the month preceding the earnings announcement date. We remove observations where there is a stock split in the window of -40 to +5 days of the earnings announcement date. Negative earnings are excluded from our sample. We also exclude observations where unexepected earnings are less than 1% or greater than 99% of the distribution. Columns (9) though (11) provide information about the coverage of our sample relative to the overall universe of stocks on CRSP.
Number of Earnings Announcements Number of Unique Firms Positive News Negative News No News Year Total Number % of Total Number % of Total Number % of Total
Total # as % of All Listed
Firms
Mkt Cap as % of All Listed
Firms
Avg Mkt
Cap (in $mil)
(1) (2) (3) (4) (5) (6) (7) (8) (9) (10) (11) (12) 1985 3,513 1,419 40% 1,889 54% 205 6% 1,216 19% 64% 971 1986 3,880 1,702 44% 1,915 49% 263 7% 1,302 20% 67% 1,179 1987 4,396 2,063 47% 2,031 46% 302 7% 1,513 22% 73% 1,245 1988 4,967 2,466 50% 2,146 43% 355 7% 1,653 25% 74% 1,068 1989 4,596 2,079 45% 2,154 47% 363 8% 1,818 28% 76% 1,136 1990 4,928 2,103 43% 2,393 49% 432 9% 1,936 31% 85% 1,109 1991 5,372 2,413 45% 2,440 45% 519 10% 2,008 32% 81% 1,166 1992 6,401 3,055 48% 2,561 40% 785 12% 2,342 37% 83% 1,185 1993 7,358 3,503 48% 2,816 38% 1,039 14% 2,601 39% 82% 1,227 1994 8,949 4,531 51% 3,045 34% 1,373 15% 3,139 44% 85% 1,108 1995 9,922 5,111 52% 3,290 33% 1,521 15% 3,425 46% 83% 1,141 1996 10,993 5,803 53% 3,259 30% 1,931 18% 3,757 47% 85% 1,280 1997 11,728 6,617 56% 2,922 25% 2,189 19% 3,954 49% 85% 1,407 1998 11,862 6,193 52% 3,204 27% 2,465 21% 4,051 51% 87% 1,542 1999 11,406 6,401 56% 2,743 24% 2,262 20% 3,800 50% 80% 1,664 2000 10,155 5,878 58% 2,450 24% 1,827 18% 3,403 48% 82% 2,037 2001 8,604 4,490 52% 2,413 28% 1,701 20% 2,898 45% 87% 2,186 2002 8,498 5,116 60% 1,627 19% 1,755 21% 2,709 47% 90% 2,175 2003 8,781 5,257 60% 1,922 22% 1,602 18% 2,757 51% 87% 2,093 2004 9,731 5,998 62% 2,219 23% 1,514 16% 3,003 58% 89% 2,374 2005 10,094 6,067 60% 2,586 26% 1,441 14% 3,063 60% 91% 2,555
All Years 166,134 88,265 53% 52,025 31% 25,844 16%
23

24
Table 2 Distribution of the Key Variables in the Pooled Regression
This table reports the summary statistics for the variables that we use in Equation (2). The sample consists of 166,134 quarterly earnings announcements over the period 1985-2005
Variable Number Mean Standard Deviation Min Max
CAR-1, +1 166,134 0.0037 0.0702 -0.2429 0.2365 PosSent 166,134 0.5864 0.4925 0.0000 1.0000 FEUp 166,134 0.0016 0.0036 0 0.0371 FEUp x PosSent 166,134 0.0007 0.0025 0 0.0371 FEUp x FGrwoth 155,353 -0.0003 0.0087 -0.3470 0.2871 FEUp x EVol 160,369 0 0.0002 0 0.0060 FEUp x Size 166,134 0.0059 0.0143 0 0.3406 166,134 -0.0014 0.0143 -0.1200 0 FEDown 166,134 -0.0007 0.0034 -0.1200 0 FEDown x PosSent 155,353 0 0.0181 -0.7600 0 FEDown x FGrowth 160,369 0 0.0003 -0.0194 0 FEDown x EVol 166,134 -0.0047 0.0150 -0.5241 0 FEDown x Size 160,369 0.0088 0.0171 0.000320157 0.1620 EVol 155,353 -0.0543 1.6824 -9.5 8.0000 FGrowth 166,134 4.6443 2.8827 1 10 Size 166,134 0.0037 0.0702 -0.2429 0.2365

Table 3 Sentiment and the Stock Returns during the 3-Day Window Surrounding the Announcements of
Earnings News This table provides estimates of the following model.
itit
itititititittititittitit
itititititittititittititit
SizexEVolUEDOWNxSizeUEDOWNUEDOWNxUEDOWNxTimeUEDOWNxFGrowthUEDOWNxPosSentUEDOWNUEDOWN
xEVolUEUPxSizeUEUPUEUPxUEUPxTimeUEUPxFGrowthUEUPxPosSentUEUPUEUPRET
εαγγγγγγγ
βββββββα
++
+++++++
+++++++=
1
6543210
65432100
The model is estimated using OLS and the pooled data of quarterly earnings announcements over the period of 1985-2005. RETit is the 3-day cumulative abnormal return centered on the date of the earnings announcement. UEUP (UEDOWN) is the product of the unexpected earnings, UE, and the indicator variable, UP (DOWN), which takes the value of one if UE is positive (negative) and zero otherwise. PosSent is an indicator variable that takes the value of one if the investor sentiment at the time of the earnings announcement is positive, and zero otherwise. FGrowth is the difference between the 4-quarter-ahead earnings and the earnings in the current quarter, scaled by the stock price at the beginning of the month. Time is a linear time trend variable. The variables UEUP x |UEUP| and UEDOWN x |UEDOWN| allow for non-linearity in market’s response to earnings news. Size is the decile rank of the stock as at the beginning of the month in which the earnings are announced. EVol is computed as the standard deviation of previous four quarters’ actual earnings divided by the beginning of the month stock price. Statistical significance at 10, 5 and 1% are indicated as *, **, and *** respectively.
Base Model Model 1 Model 2
(1) (2) (3) (4)
Intercept 0.0022*** 0.0022*** -0.0023*** (6.18) (6.18) (5.39)
FEUp 3.196*** 3.087*** 6.345*** (65.61) (49.39) (33.55)
FEUp x PosSent 0.238*** 0.210** (2.72) (2.31)
FEUp x Time 0.136*** (17.38)
FEUp x Abs(FEUp) -204.513*** (40.21)
FEUp x Size -0.207*** (10.01)
FEUp x EVol -2.597* (1.86)
FEUp x FGrowth 0.200*** (9.81)
FEDown 1.135*** 1.358*** 1.653*** (30.18) (26.25) (12.69)
FEDown x PosSent -0.441*** -0.449*** (6.29) (5.71)
FEDown x Time 0.070*** (9.29)
FEDown x Abs(FEDown) -25.310*** (16.27)
FEDown x Size 0.046** (2.39)
FEDown x EVol -9.402*** (9.51)
FEDown x FGrowth -0.024** (2.43)
Size -0.0004*** -0.0004*** -0.00003 (6.84) (6.76) (0.44)
Adjusted R-squared 3.58% 3.60% 5.98%Number of pooled observations 166,134 166,134 149,856
25

Table 4 Sentiment and the Stock Price Drift in the 60 Days Following the Announcement of Earnings News
This table provides estimates of the following model.
itittitittititit SizexPosSentUEDOWNUEDOWNxPosSentUEUPUEUPRET εαγγββα ++++++= 110100
The model is estimated using OLS and the pooled data of quarterly earnings announcements over the period of 1985-2005. RETit is the cumulative abnormal return over the trading days +2 to +60 following the earnings announcement. UEUP (UEDOWN) is the product of the unexpected earnings, UE, and the indicator variable, UP (DOWN), which takes the value of one if UE is positive (negative) and zero otherwise. PosSent is an indicator variable that takes the value of one if the investor sentiment at the time of the earnings announcement is positive, and zero otherwise. Statistical significance at 10, 5 and 1% are indicated as *, **, and *** respectively.
Variables Coefficient Estimates
Intercept -0.016*** (16.34)
FEUp 3.484*** (20.69)
FEUp x PosSent 0.466** (1.98)
FEDown 1.009*** (7.24)
FEDown x PosSent -0.901*** (4.77)
Size -0.002*** (9.62)
Adjusted R-squared 0.65%% Number of pooled observations 166,134
26

Table 5 Cross-Sectional Variation in the Impact of Sentiment on the Three-day Stock Price Response to
Earnings News This table provides estimates of the following model.
itittitittititit SizexPosSentUEDOWNUEDOWNxPosSentUEUPUEUPRET εαγγββα ++++++= 110100
The model is estimated using OLS and the pooled data of quarterly earnings announcements over the period of 1985-2005. RETit is the 3-day cumulative abnormal return centered on the date of the earnings announcement. UEUP (UEDOWN) is the product of the unexpected earnings, UE, and the indicator variable, UP (DOWN), which takes the value of one if UE is positive (negative) and zero otherwise. PosSent is an indicator variable that takes the value of one if the investor sentiment at the time of the earnings announcement is positive, and zero otherwise. In each panel, we report the results of estimating this model for sub-samples of stock sorted on certain characteristic. These firm characteristics are computed following the computations in Baker and Wurgler (2006). All firm characteristics, except dividend payments and book values, are computed at monthly frequency using the CRSP files. Size is represented by the market capitalization which is computed for each stock at each month end using the CRSP dataset. Age is computed as the number of years since the firm’s first appearance on CRSP, measured to the nearest month. Stock return volatility is measured as the standard deviation of monthly returns over the preceding 12 months. Dividend payouts are noted from Compustat and are computed once a year at the end of each June. Labeling of growth and distressed stocks is done using the book-to market ratios of the stocks. The book values are from Compusat and are computed at the end of each June, using the information contained in the financial statements of the year ending in the preceding December. These book values are then compared with the market value of the stocks for each month to compute monthly book-to-market ratios. For each attribute, except for the classification of payers versus non-payers, we then rank all available firms within each month into deciles using the NYSE breakpoints. Firms that fall in the bottom 30% and top 30% are labeled as those with low and high values, respectively, with respect to the attribute. The book-to-market differs from the other characteristics in the sense that it helps identify both growth and distressed stocks. As in Baker and Wurgler (2006), we label the stocks with the highest 30% of the book-to-market ratios as the distressed stocks, and those with the lowest ratios as growth stocks. This labeling of stock characteristics is then matched to the earnings announcements of the subsequent month. As noted above, following Baker and Wurgler, the classification of firms into payers versus non-payers is done once a year at the end of June. This identification then holds for the earnings announcements in the subsequent 12-month period. Statistical significance at 10, 5 and 1% are indicated as *, **, and *** respectively. Panel A: Small versus Large Firms
Small Medium Large (1) (2) (3) (4)
Intercept 0.007*** 0.0008 0.002 (6.96) (1.06) (0.38)
FEUp 3.177*** 2.947*** 2.640*** (32.94) (30.81) (13.39)
FEUp x PosSent 0.223* 0.293** -0.407 (1.72) (2.11) (1.37)
FEDown 1.164*** 1.784*** 1.575*** (15.85) (20.30) (7.64)
FEDown x PosSent -0.543*** 0.086 0.167 (5.71) (0.66) (0.53)
Size -0.004*** -0.00003 -0.0003 (6.43) (0.26) (0.44)
Adjusted R-squared 5.01% 2.89% 1.65% Number of pooled observations 52,092 90,908 23,134
27

Panel B: Young versus Old Firms Young Medium Mature
(1) (2) (3) (4)Intercept 0.002*** 0.001*** 0.003**
(2.98) (2.97) (2.62) FEUp 3.057*** 3.355*** 2.245***
(25.55) (38.80) (19.85) FEUp x PosSent 0.598*** 0.155 -0.414**
(3.56) (1.29) (2.62) FEDown 1.281*** 1.455*** 1.217***
(14.21) (19.23) (11.89) FEDown x PosSent -0.307** -0.621*** -0.185
(2.42) (6.25) (1.33) Size -0.0003** -0.0003*** -0.0004***
(2.19) (3.49) (3.13)
Adjusted R-squared 3.17% 4.08% 3.53% Number of pooled observations 55,340 84,821 25,973
Panel C: Volatile versus Stable Stocks
Volatile Medium Stable
(1) (2) (3) (4)Intercept -0.0007 0.004*** 0.002***
(0.83) (8.20) (3.12) FEUp 3.623*** 2.877*** 1.776***
(28.65) (35.61) (14.81) FEUp x PosSent 0.236 0.174 0.196
(1.31) (1.57) (1.22) FEDown 1.202*** 1.519*** 1.083***
(11.72) (22.94) (9.63) FEDown x PosSent -0.577*** -0.405*** -0.017
(4.11) (4.56) (0.12) Size 0.00008 -0.0005*** -0.0004***
(0.43) (7.42) (4.57)
Adjusted R-squared 3.56% 3.97% 2.90% Number of pooled observations 46,749 88,827 25,636
28

Panel D: Payer versus Non-payers Non-Payers Medium Highest Payers
(1) (2) (3) (4)Intercept 0.0007 0.003*** -0.0008
(1.18) (6.12) (0.670 FEUp 3.623*** 2.378*** 2.674***
(35.41) (29.91) (13.62) FEUp x PosSent 0.225 0.124 -0.837***
(1.60) (1.10) (3.18) FEDown 1.302*** 1.568*** 1.647***
(15.76) (22.16) (10.08) FEDown x PosSent -0.581*** -0.223** -0.795***
(5.37) (2.21) (3.59) Size -0.00006 -0.0004*** -0.0009
(0.44) (5.94) (0.61)
Adjusted R-squared 3.77% 4.02% 3.07% Number of pooled observations 74,228 64,972 13,690
Panel E: Growth versus Distressed Firms
Distressed Medium Growth
(1) (2) (3) (4)Intercept 0.006*** 0.004*** -0.004***
(6.20) (8.41) (4.36) FEUp 2.413*** 3.164*** 4.689***
(21.86) (39.02) (23.21) FEUp x PosSent 0.400*** 0.048 -0.088
(2.70) (0.43) (0.31) FEDown 0.849*** 1.527*** 1.912***
(8.20) (23.58) (12.34) FEDown x PosSent -0.464*** -0.405*** -0.061
(3.70) (4.50) (0.26) Size -0.001*** -0.0006*** 0.0005***
(7.08) (8.62) (3.41)
Adjusted R-squared 6.41% 4.22% 2.84% Number of pooled observations 18,149 90,837 43,937
29
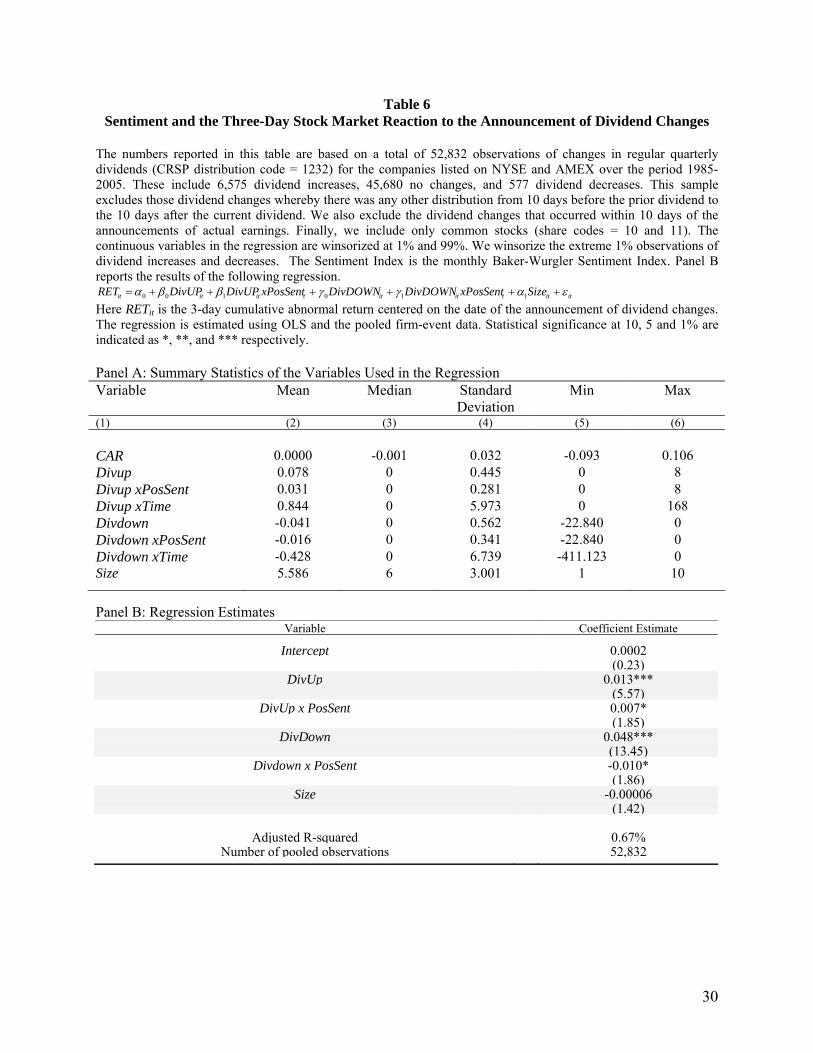
Table 6 Sentiment and the Three-Day Stock Market Reaction to the Announcement of Dividend Changes
The numbers reported in this table are based on a total of 52,832 observations of changes in regular quarterly dividends (CRSP distribution code = 1232) for the companies listed on NYSE and AMEX over the period 1985-2005. These include 6,575 dividend increases, 45,680 no changes, and 577 dividend decreases. This sample excludes those dividend changes whereby there was any other distribution from 10 days before the prior dividend to the 10 days after the current dividend. We also exclude the dividend changes that occurred within 10 days of the announcements of actual earnings. Finally, we include only common stocks (share codes = 10 and 11). The continuous variables in the regression are winsorized at 1% and 99%. We winsorize the extreme 1% observations of dividend increases and decreases. The Sentiment Index is the monthly Baker-Wurgler Sentiment Index. Panel B reports the results of the following regression.
itittitittititit SizexPosSentDivDOWNDivDOWNxPosSentDivUPDivUPRET εαγγββα ++++++= 110100
Here RETit is the 3-day cumulative abnormal return centered on the date of the announcement of dividend changes. The regression is estimated using OLS and the pooled firm-event data. Statistical significance at 10, 5 and 1% are indicated as *, **, and *** respectively. Panel A: Summary Statistics of the Variables Used in the Regression Variable Mean Median Standard
Deviation Min Max
(1) (2) (3) (4) (5) (6) CAR 0.0000 -0.001 0.032 -0.093 0.106 Divup 0.078 0 0.445 0 8 Divup xPosSent 0.031 0 0.281 0 8 Divup xTime 0.844 0 5.973 0 168 Divdown -0.041 0 0.562 -22.840 0 Divdown xPosSent -0.016 0 0.341 -22.840 0 Divdown xTime -0.428 0 6.739 -411.123 0 Size 5.586 6 3.001 1 10
Panel B: Regression Estimates
Variable Coefficient Estimate
Intercept 0.0002 (0.23)
DivUp 0.013*** (5.57)
DivUp x PosSent 0.007* (1.85)
DivDown 0.048*** (13.45)
Divdown x PosSent -0.010* (1.86)
Size -0.00006 (1.42)
Adjusted R-squared 0.67% Number of pooled observations 52,832
30

Table 7 Sentiment and the Three-Day Stock Market Reaction to the Announcement of Stock Splits
The numbers reported in this table are based on 8,362 splits and stock dividend announcements (CRSP distribution codes: 5523 and 5533) made by companies listed on NYSE/AMEX/NASDAQ over the period 1985-2005. The sample includes only those announcements whereby new stocks issued constitute at least 25% of the original issue. We include only common stocks (share codes = 10 and 11). All continuous variables are winsorized at 1% and 99%. Sentiment Index is the monthly Baker-Wurgler Sentiment Index. Panel B reports the results of the following regression.
ittitittit TimeSizeSpFactorPosSentRET εγγγβα +++++= 21000
Here RETit is the 3-day cumulative abnormal return centered on the date of the announcement of stock splits. The regression is estimated using OLS and the pooled firm-event data. Statistical significance at 10, 5 and 1% are indicated as *, **, and *** respectively. Panel A: Summary Statistics of the Variables Used in the Regression Variable Mean Median Standard
Deviation Min Max
(1) (2) (3) (4) (5) (6)
CAR 0.0293 0.020 0.058 -0.105 0.273 Pos Sent 0.527 1 0.499 0 1 Split Factor 0.783 1.000 0.487 0.250 9.000. Size 4.421 4 2.902 1 10
Panel B: Regression Estimates Variable Coefficient Estimate t-statistics
Intercept 0.025*** 11.77 Pos Sent 0.005 4.13 Split Factor 0.013*** 9.99 Size -0.004*** 17.36 Time Trend 0.0006*** 5.92 Adjusted R2 4.16% Number of pooled observations 8,362 Time Period 1985-2005
31

32
itittitittit iorRETTimeSizeRpRatioPosSentRET εγγγγβα ++++++= Pr321000
Table 8 Sentiment and the Three-Day Stock Market Reaction to the Announcement of Stock Repurchases
The sample of repurchases used here comes from Lee, Lakanishok. The total number of repurchases are 6,170 over the period from 1980-2000. We remove those firm-event observations where another repurchase announcement was made by the same company over the previous 5 days. We include only common stocks (share codes = 10 and 11). All continuous variables are winsorized at 1% and 99%. Sentiment Index is the monthly Baker-Wurgler Sentiment Index. Panel B reports the results of the following regression.
Here RETit is the 3-day cumulative abnormal return centered on the date of the announcement of stock repruchases. The regression is estimated using OLS and the pooled firm-event data. Statistical significance at 10, 5 and 1% are indicated as *, **, and *** respectively. Panel A: Summary Statistics of the Variables Used in the Regression Variable Mean Median Standard
Deviation Min Max
(1) (2) (3) (4) (5) (6)
CAR 0.0193 0.015 0.073 -0.243 0.245 Pos Sent 0.589 1 0.492 0 1 Repurchase Ratio 0.072 0.056 0.054 0.005 0.315 Prior Ret -0.091 -0.129 0.402 -0.888 1.434 Size 5.231 5 2.890 1 10
Panel B: Regression Estimates Variable Coefficient Estimate t-statistics
Intercept 0.036*** 8.81 Pos Sent 0.0039** 1.98 Repurchase Ratio 0.126*** 7.45 Prior Ret -0.0077*** 3.30 Size -0.0028*** 8.94 Time Trend -0.001*** 4.73 Adjusted R2 3.10% Number of pooled observations 6,170 Time Period 1980-2000

Figure 1 Time Series of Monthly Baker-Wurgler Index (1985-2005)
-2.0
-1.5-1.0
-0.50.0
0.51.0
1.52.0
2.53.0
3.5
Jan-
85
Jan-
86
Jan-
87
Jan-
88
Jan-
89
Jan-
90
Jan-
91
Jan-
92
Jan-
93
Jan-
94
Jan-
95
Jan-
96
Jan-
97
Jan-
98
Jan-
99
Jan-
00
Jan-
01
Jan-
02
Jan-
03
Jan-
04
Jan-
05
Time
BW
Inde
x
33