INVESTOR REPORT 2Q17 - Foundation Home Page - … · · 2017-09-14INVESTOR REPORT 2Q17 South...
24
4643 S Ulster Street | Suite 1040 | Denver, CO 80237 303.694.1900 | innovestinc.com INVESTOR REPORT 2Q17 South Dakota School of Mines & Technology Foundation Scott Middleton, CFA, CIMA ® Steve Karsh Sloan Smith, CAIA Richard Todd Prepared by: Michelle Weeks
Transcript of INVESTOR REPORT 2Q17 - Foundation Home Page - … · · 2017-09-14INVESTOR REPORT 2Q17 South...

4643 S Ulster Street | Suite 1040 | Denver, CO 80237 303.694.1900 | innovestinc.com
INVESTOR REPORT 2Q17
South Dakota School of Mines &
Technology Foundation
Scott Middleton, CFA, CIMA®
Steve Karsh
Sloan Smith, CAIA
Richard Todd
Prepared by: Michelle Weeks

© 2017 INNOVEST PORTFOLIO SOLUTIONS, LLC
INNOVEST AT A GLANCE
Our History
— Founded in 1996 by Richard Todd and Wendy Dominguez who lead the firm today
— Independent, privately held and employee-owned— SEC Registered Investment Advisor— Currently more than $16 billion in firm assets*
Our Professionals
— 46 employees— Long-term relationships with top tier managers, vendors, and
service providers— 95% employee retention rate— Demonstrated ability to hire and retain top quality talent
Alignment of Interest with Our Clients
— 98% client retention— Conflict-free, independent and objective advocate— A consistent investment philosophy since the firm’s inception— A client-centered, risk-focused, and performance-driven culture— Year-over-year revenue growth 19 of the last 20 years— 2016 Client Survey Results: Overall Client Satisfaction 4.7 (5-point
Scale)
Award-Winning Team
— Innovest named one of the Best Places to Work in the nation, 2016, 2014, Pensions & Investments
— Innovest ranked Forbes #3 Fastest Growing RIA Firms— Ranked #1 among 2015 Investment Managers in Colorado**— Recognized for 403(b) Plan Conversion Campaign, 2016, The Eddy
Awards— Finalist for the Colorado Top Company Award, 2015, ColoradoBiz— Top 100 Wealth Managers in the nation, 2015, Forbes— 2014 Retirement Plan Adviser Team of the Year, PLANSPONSOR— 19th Fastest Growing RIA in the nation, 2015, Financial Advisor
Fiduciary Expertise
— One of the first investment firms in the Rocky Mountain region rooted in prudent fiduciary principles
— Accreditations through Investment Management Consultants Association and Center for Fiduciary Studies
— Process-oriented approach with a focus on investment and spending policies
— Expert Witness in nearly 60 cases involving fiduciary investment responsibilities
— Numerous fiduciary certifications: AIF™, AIFA ™, CIMA®, CFA , QPFC, RF™, RPS
Money Management Experience
— 16 member Investment Committee with median experience of more than 20 years
— Principals have more than 25 years of experience managing large pension and foundation portfolios
— Disciplined and opportunistic approach to forward-looking portfolio design
— Experts in many investment strategies: active, passive, hedge funds, and other alternatives
— Emphasis on downside risk quantification in developing portfolio design
Client Access and Transparency
— Direct access to Innovest’s investment and operational heads at all times
— Routine access to closed products, waived investment minimums, lower product fees, and socially responsible mandates
— Customized asset allocation, benchmarking and reporting
Diverse Client Base
— 250+ clients in 21 states— Retirement Plans— Foundations & Endowments— Wealthy Families*As of April 2017
** Denver Business Journal – assets under management as of 10/1/16
Privileged and Confidential
INTEGRITY. BALANCE. OBJECTIVITY.2

INNOVEST’S HISTORY WITH SOUTH DAKOTA SCHOOL OF MINES AND TECHNOLOGY EDUCATION
2008 - 2009
• Entered into contract between Innovest Portfolio Solutions and South Dakota School of Mines and Technology Foundation .
• Prepared first quarterly performance report and continue to date.
• Recommended consolidation of custody of the portfolio’s long term assets.
• Completed spending simulations to help determine the appropriate asset allocation, resulting in a transition of the portfolio to revised asset allocation levels and new asset classes.
• Purchased Private Advisors Stable Value and Common Sense Offshore as part of new allocation.
• Completed manager searches for mid and small cap equities, international equity, hedge fund of funds, leveraged hedge fund of funds, private equity and real estate strategies, resulting in the hiring of several managers in 2010 (see note below).
• Replaced Blackrock High Yield with JP Morgan High Yield due to management changes.
2010 - 2011
• Delivered Emerging Markets presentation and related manager search.
• Completed Liquid Low Correlated Hedge Fund manager search.• Implemented a new allocation after review of the annual Asset
Allocation Study
2010 – 2011 Continued
• To improve portfolio diversification, added Cornerstone Patriot Fund, UBS Trumbull Private Real Estate Fund, Wells Fargo Emerging Markets, Highbridge Dynamic Commodities, Common Sense Long Biased, and Common Fund Capital PE VIII. Also replaced Fidelity Floating Rate with Eaton Vance Floating and replaced Janus Perkins Mid Cap Value with iShares Russell Mid Cap Value and John Hancock Disciplined Value.
2012 - 2013
• Delivered Active vs. Passive Investing presentation• Delivered illiquid credit presentation and related
manager search, resulting in the addition of Portfolio Advisors Private Equity VII investment.
• Completed analysis of the portfolio’s expense ratios of each of the investment managers.
• Received a full redemption of Common Sense Offshore and partial redemptions of Private Advisors Stable Value and Common Sense Long Biased.
• Added Fidelity Contra Fund to replace Weber due to inconsistent performance. Replaced Fidelity Floating Rate with Eaton Vance Floating Rate and replaced Janus Perkins Mid Cap Value with John Hancock Disciplined Mid Cap Value.
INTEGRITY. BALANCE. OBJECTIVITY.3

INNOVEST’S HISTORY WITH SOUTH DAKOTA SCHOOL OF MINES AND TECHNOLOGY EDUCATION
2014 – 2016
• Provided Asset Allocation Study along with quarterly performance reports; Delivered Fiduciary Education
• Removed Highbridge Commodity from plan due to poor performance and directed complete Commodity allocation into PIMCO Commodity. Added an additional commitment to Lighthouse Global Long/Short with the proceeds from the Common Sense Redemption.
• Conducted International Core Equity search including current manager (Thornburg), and index fund, and two active managers. Added iShares MSCI EAFE to portfolio to diversify International Equity allocation, which was later replaced by Vanguard Total Intl Stock.
• Presented searches on Core Fixed Income, Emerging Markets Equity, LCH Basket, and PIMCO Commodity replacement.
• Added Vanguard 500 Index to replace SFM due to poor performance and to lower overall costs. Added Vanguard Sm Cap Growth to lower costs and increase diversification in the SMID cap space, and replaced PIMCO Commodity with Credit Suisse Commodity.
• Chose new allocation adding Fixed Income as an asset class.• Innovest presented searches on MLPs and Reinsurance as new
asset classes, in addition to the annual asset allocation study. (2016)
• Decided to replace all US and International Developed managers/products with Vanguard Index funds and ETFS.
• Chose to sell all of the Hedge Fund of Fund positions.
2016- 2017
• Replaced WF Emerging Markets with Vanguard Emerging Markets.
• Redeemed Lighthouse Global L/S Fund.• Chose a new asset allocation removing the
allocation to cash and hedge funds and adding to Large Cap and Fixed Income.
INTEGRITY. BALANCE. OBJECTIVITY.4

Performance Over Time
Risk and Return (Since Inception) Asset Allocation
Cumulative Performance over Time
Change in Account Value
LastQuarter
Year ToDate
1Year
3Years
5Years
7Years
SinceInception
InceptionDate
SDSM Total Fund 2.17 6.64 11.43 3.50 7.02 7.51 8.75 04/01/2009
SDSM Custom Benchmark 2.54 7.14 12.32 4.11 8.22 8.47 10.46
Difference -0.37 -0.50 -0.89 -0.61 -1.20 -0.96 -1.71
Market ValueAs of
04/01/2017
Market ValueAs of
06/30/2017
Change$
SDSM Total Fund 54,168,246 55,227,958 1,059,712
$0 $2,230,064 $4,460,128 $6,690,192 $8,920,256 $11,150,320
Schwab Money Market Fund
Common Fund Capital Int'l VII
TIFF PE Partners 2011
CommonFund Capital PE VIII
TIFF Absolute Return Pool
Private Advisors Stable Value Fund, Ltd.
Port Advisors PEFVI
Portfolio Advisors Private Equity VII
JPMorgan High Yield Select
Vanguard Mid Cap
Vanguard Small Cap Index
Vanguard Mid Cap Index
Vanguard Small Cap
UBS Trumbull Property Fund
Barings Core Property Fund
Credit Suisse Commodity Return Strategy
Eaton Vance Floating Rate; I
Vanguard Total Intl ETF
Vanguard Total Intl Stock Index
Vanguard S&P 500 ETF
Vanguard Emerging Markets Stock Idx
Vanguard Total Bond Market Idx
Vanguard Institutional Index
$184,293
$207,975
$387,345
$469,618
$728,011
$940,346
$1,000,176
$1,005,658
$1,080,811
$1,242,774
$1,317,854
$1,441,161
$1,504,765
$1,967,001
$2,070,107
$2,537,739
$3,205,694
$3,253,322
$3,917,402
$4,091,456
$5,331,036
$8,408,253
$8,935,160
8.0
10.0
12.0
14.0
16.0
18.0
Re
turn
(%)
7.2 8.1 9.0 9.9 10.8 11.7 12.6 13.5Risk (Standard Deviation %)
70% MSCI ACWI/30% BC Gbl AggCustom BM
S&P 500 Index
SDSM Total Fund
SDSM Total Fund SDSM Custom Benchmark
-50 %
0%
50%
100%
150%
200%
6/09 12/09 6/10 12/10 6/11 12/11 6/12 12/12 6/13 12/13 6/14 12/14 6/15 12/15 6/16 12/16 6/17
Executive SummaryJune 30, 2017
INTEGRITY. BALANCE. OBJECTIVITY.5

THIS PAGE LEFT INTENTIONALLY BLANK
INTEGRITY. BALANCE. OBJECTIVITY.6

THE MARKETS
Investment Returns
First Half of 2017
c
1st Quarter 2nd Quarter
2Q17
13.81%
2.27%
9.34%
18.43%
4.99%
YTD
c
-5%
0%
5%
10%
15%
20%
25%
S&P 500
MSCI EAFE
MSCI EM
Russell 2000 TR
BBgBarc US Agg Bond
6.12%
1.45%
3.09%
6.27%
2.46%
INTEGRITY. BALANCE. OBJECTIVITY.7

GLOBAL ECONOMICS
• In 2007 the world economy grew by 5.6%, while
this year it is projected to grow by only 3.5%.
• India (7.2%) and China (6.6%) are the only two
large economies projected to grow rapidly in
2017, and the G7 is projected to grow by 1.9%
• Lower growth is a primary reason for lower
interest rates, lower inflation, and lower expected
investment returns.
Global Growth: Decelerating
Source: IMF. 2017 numbers are estimates.
Real GDP Growth: 2007 and 2017
• Inflation has fallen below the Fed’s target rate of
2.0%, despite a very low unemployment rate of
4.4%.
• Wages, salaries and benefits have risen a modest
2.5% in the last 12 months.
• June retail sales excluding gasoline were
moderately higher than a year ago—up 3.2%
Inflation: Below Target
Core rates exclude food and energy. CPI = Consumer Price Index. PCE = Personal Consumption Deflator.
Reported 7/6/17. Sources: BEA, BLS, Haver Analytics and Deutsche Bank Research.
US Core Inflation
0
2
4
6
8
10
12
14
16
China Germany India Japan United
Kingdom
United
States
World
2007 2017
INTEGRITY. BALANCE. OBJECTIVITY.8

GLOBAL ECONOMICS, CONTINUED
• In the next few months the US Federal Reserve
plans to begin trimming its $4.5 trillion balance
sheet, including its 20% ownership of US
government bonds.
• Central Banks purchased bonds in the credit crisis
to help reduce rates on mortgages and other debt.
• The unwinding of global quantitative easing is a
new phenomenon, the results of which are hard to
predict.
Percentage of Domestic Government Bonds Held by Central BanksFed: Time to Unwind
• Since the end of the housing market crisis, home
prices have recovered at a much faster pace than
wages.
• National home prices have appreciated about
5.5% in the last 12 months, while average hourly
earnings rose by 2.5% during the same period.
• The median price of an existing US home was
$252,800 in May (the highest on record), and
there is strong demand and limited supply for less
expensive housing.
Housing Prices and WagesUS Home Prices: Outpacing Wages
Shaded vertical area indicates recession. Sources: SLFR/FRED, BLS and FHFA. As of April 2017.
Sources: OECD and Deutsche Bank Global Markets Research
INTEGRITY. BALANCE. OBJECTIVITY.9
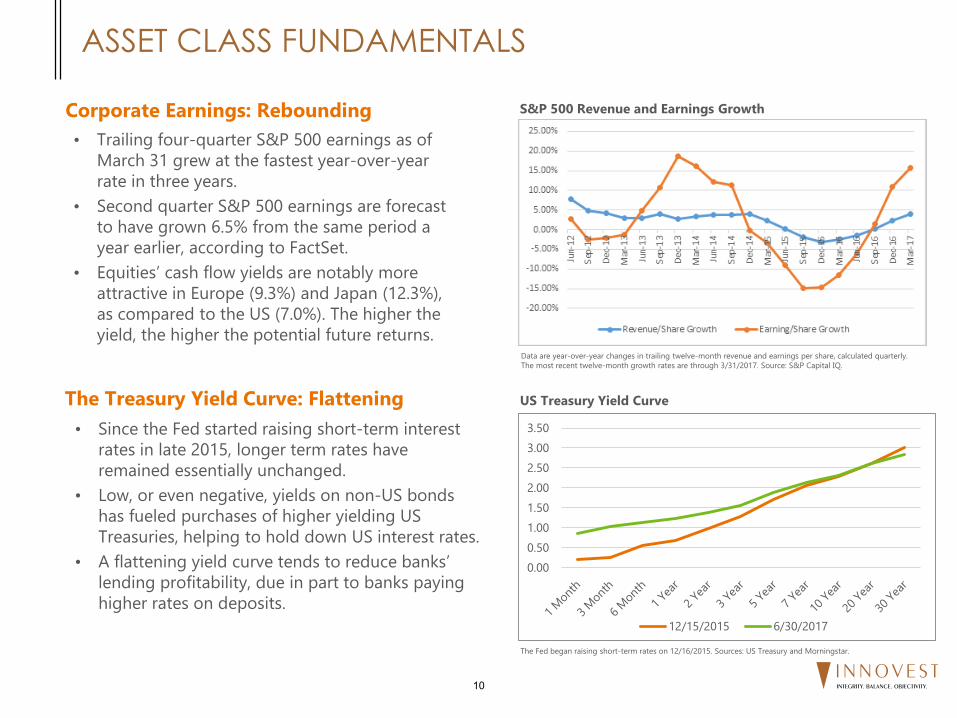
ASSET CLASS FUNDAMENTALS
Data are year-over-year changes in trailing twelve-month revenue and earnings per share, calculated quarterly.
The most recent twelve-month growth rates are through 3/31/2017. Source: S&P Capital IQ.
• Trailing four-quarter S&P 500 earnings as of
March 31 grew at the fastest year-over-year
rate in three years.
• Second quarter S&P 500 earnings are forecast
to have grown 6.5% from the same period a
year earlier, according to FactSet.
• Equities’ cash flow yields are notably more
attractive in Europe (9.3%) and Japan (12.3%),
as compared to the US (7.0%). The higher the
yield, the higher the potential future returns.
Corporate Earnings: Rebounding
• Since the Fed started raising short-term interest
rates in late 2015, longer term rates have
remained essentially unchanged.
• Low, or even negative, yields on non-US bonds
has fueled purchases of higher yielding US
Treasuries, helping to hold down US interest rates.
• A flattening yield curve tends to reduce banks’
lending profitability, due in part to banks paying
higher rates on deposits.
US Treasury Yield CurveThe Treasury Yield Curve: Flattening
The Fed began raising short-term rates on 12/16/2015. Sources: US Treasury and Morningstar.
S&P 500 Revenue and Earnings Growth
0.00
0.50
1.00
1.50
2.00
2.50
3.00
3.50
12/15/2015 6/30/2017
INTEGRITY. BALANCE. OBJECTIVITY.10

• Improvements in drilling and production
technology have significantly lowered break-even
costs for domestic oil drilling.
• The US rig count having doubled in the last year
and higher global production (despite OPEC’s
quotas) have pushed oil prices down by 20% since
February.
• Despite an improving outlook for MLPs’ volume
and distribution growth, retail investors have
reduced their exposures to the asset class.
• US high yield fixed income spreads have compressed
since early 2016.
• Annual default rates for US high yield bonds and
floating rate loans were recently 1.50% and 1.54%,
respectively, significantly below historic averages.
• Default rates on below-investment-grade paper are
expected to increase during the next recession.
Credit: Spreading it Thin
ASSET CLASS FUNDAMENTALS, CONTINUED
Energy: Supply Up, Prices Down
$60
$48
$60
$41 $46
$50
$30
$36 $38
$-
$20
$40
$60
$80
Permian (TX) Eagle Ford (TX) Bakken (ND)
2014 2015 2016
Assumes 10% IRR. Permian data represents an average of two primary plays in the region: the Permian Midland
Basin and the Permian Delaware Basin. Source: Wells Fargo Research as of March 2017.
High Yield Bond Spreads
Crude Oil: Break-Even Costs for Top-Producing US Regions
The spread is the yield-to-worst of the J.P. Morgan Domestic High Yield Index minus the yield on an equivalent-
maturity US Treasury. Reported 6/30/2017. Source: J.P. Morgan Asset Management.
INTEGRITY. BALANCE. OBJECTIVITY.11

MARKET PERFORMANCE AS OF 6/30/17
United States Equities
Short Term Annualized
QTD YTD 1 Year 3 Year 5 Year 7 Year 10 Year
S&P 500 3.09% 9.34% 17.90% 9.61% 14.63% 15.41% 7.18%
S&P 500 Value 1.51% 4.85% 15.86% 7.79% 13.82% 14.09% 5.25%
S&P 500 Growth 4.42% 13.33% 19.30% 11.03% 15.24% 16.57% 8.97%
Russell Mid Cap 2.70% 7.99% 16.48% 7.69% 14.72% 15.28% 7.67%
Russell Mid Cap Value 1.37% 5.18% 15.93% 7.46% 15.14% 15.29% 7.23%
Russell Mid Cap Growth 4.21% 11.40% 17.05% 7.83% 14.19% 15.24% 7.87%
Russell 2000 2.46% 4.99% 24.60% 7.36% 13.70% 14.35% 6.92%
Russell 2000 Value 0.67% 0.54% 24.86% 7.02% 13.39% 13.50% 5.92%
Russell 2000 Growth 4.39% 9.97% 24.40% 7.64% 13.98% 15.16% 7.82%
International Equities
QTD YTD 1 Year 3 Year 5 Year 7 Year 10 Year
MSCI EAFE 6.12% 13.81% 20.27% 1.15% 8.69% 7.91% 1.03%
MSCI EAFE Value 4.78% 11.12% 25.01% -0.59% 8.12% 7.15% -0.08%
MSCI EAFE Growth 7.52% 16.68% 15.70% 2.81% 9.19% 8.60% 2.06%
MSCI Japan 5.19% 9.92% 19.18% 5.54% 9.56% 7.46% 1.21%
MSCI AC Europe 7.56% 15.49% 21.72% 0.03% 8.92% 8.39% 0.97%
MSCI AC Asia Ex Japan 8.31% 22.81% 26.73% 5.02% 7.97% 6.92% 4.19%
MSCI EM 6.27% 18.43% 23.75% 1.07% 3.96% 3.87% 1.91%
MSCI EM Asia 8.74% 23.31% 28.26% 5.37% 8.11% 6.91% 4.18%
MSCI EM Europe 2.68% 4.11% 19.42% -7.53% -2.24% -0.65% -4.54%
MSCI EM Latin America -1.61% 10.32% 15.40% -6.33% -3.48% -2.03% -0.89%
Fixed Income
QTD YTD 1 Year 3 Year 5 Year 7 Year 10 Year
BBgBarc US Agg Bond 1.45% 2.27% -0.31% 2.48% 2.21% 3.19% 4.48%
BBgBarc US Corporate High Yield 2.17% 4.93% 12.70% 4.48% 6.89% 8.15% 7.67%
BBgBarc US Govt 1-3 Yr 0.20% 0.48% -0.07% 0.71% 0.65% 0.79% 2.01%
Credit Suisse Leveraged Loan 0.75% 1.96% 7.49% 3.49% 4.83% 5.29% 4.16%
BBgBarc Municipal 1.96% 3.57% -0.49% 3.33% 3.26% 4.21% 4.60%
S&P 500 Sector Performance
Short Term Annualized
QTD YTD 1 Year 3 Year 5 Year 7 Year 10 Year
S&P 500 Cons Disc 2.35% 11.00% 16.90% 12.21% 17.41% 19.45% 10.47%
S&P 500 Cons Staples 1.57% 8.03% 3.06% 10.19% 12.61% 14.82% 10.46%
S&P 500 Energy -6.36% -12.61% -4.14% -10.51% 1.64% 6.18% 1.28%
S&P 500 Financials 4.25% 6.88% 35.37% 12.36% 18.00% 14.06% 0.39%
S&P 500 Health Care 7.10% 16.07% 12.47% 11.02% 17.86% 18.13% 10.57%
S&P 500 Industrials 4.73% 9.51% 22.27% 10.24% 16.06% 16.27% 7.65%
S&P 500 Info Technology 4.14% 17.23% 33.89% 15.95% 17.18% 17.86% 10.70%
S&P 500 Materials 3.17% 9.21% 18.59% 4.74% 11.09% 12.51% 5.36%
S&P 500 Real Estate 2.76% 6.40% -0.42% 9.00% 9.79% 14.18% 5.70%
S&P 500 Telecom Services -7.05% -10.74% -11.71% 4.03% 5.85% 11.45% 3.69%
S&P 500 Utilities 2.21% 8.75% 2.47% 9.37% 11.17% 13.48% 6.97%
Returns for time periods of 1 year or longer are annualized.
Alternatives
QTD YTD 1 Year 3 Year 5 Year 7 Year 10 Year
Bloomberg Commodity -3.00% -5.26% -6.50% -14.81% -9.25% -5.68% -6.49%
Alerian MLP Infrastructure -6.90% -3.08% 1.17% -9.91% 2.89% 6.92% 6.62%
HFRI Fund of Fund Index 0.20% 2.59% 5.85% 1.35% 3.75% 2.93% 0.81%
INTEGRITY. BALANCE. OBJECTIVITY.12

FIXED INCOME MARKETS
As of 6/30/2017. Sources: Bloomberg, FactSet and Eaton Vance.
10-Year Government Bond Yields
Credit Spreads
Average spreads in basis points. Reported 6/30/2017. Corporate spreads are in basis points and measure option-adjusted yield spread to comparable maturity US Treasuries. Loan index spread represents the three-year spread over
LIBOR. Sources: JP Morgan, LCD and Eaton Vance.
INTEGRITY. BALANCE. OBJECTIVITY.13

THE CYCLICAL NATURE OF ASSET CLASS RETURNS
20%
15%
10%
5%
%
5%
10%
15%
20%
25%
30%
1992
1993
1994
1995
1996
1997
1998
1999
2000
2001
2002
2003
2004
2005
2006
2007
2008
2009
2010
2011
2012
2013
2014
2015
2016
Domestic vs. International Stocks
Rolling 3-Year Returns Ended December 31, 2016
Domestic Outperformed
30%
20%
10%
%
10%
20%
30%
1992
1993
1994
1995
1996
1997
1998
1999
2000
2001
2002
2003
2004
2005
2006
2007
2008
2009
2010
2011
2012
2013
2014
2015
2016
Stocks vs. Bonds
Rolling 3-Year Returns Ended December 31, 2016
Stocks Outperformed
15%
10%
5%
%
5%
10%
15%
20%
25%
1992
1993
1994
1995
1996
1997
1998
1999
2000
2001
2002
2003
2004
2005
2006
2007
2008
2009
2010
2011
2012
2013
2014
2015
2016
U.S. Large Cap vs. U.S. Small Cap Stocks
Rolling 3-Year Returns Ended December 31, 2016
Large Outperformed
20%
15%
10%
5%
%
5%
10%
15%
1992
1993
1994
1995
1996
1997
1998
1999
2000
2001
2002
2003
2004
2005
2006
2007
2008
2009
2010
2011
2012
2013
2014
2015
2016
Growth vs. Value Stocks (U.S.)
Rolling 3-Year Returns Ended December 31, 2016
Value Outperformed
International OutperformedBonds Outperformed
Small Outperformed
Growth Outperformed
INTEGRITY. BALANCE. OBJECTIVITY.14

Client Type: Foundation - South Dakota School of Mines & Technology
Time Horizon: Greater than Five Years
Expected Return: 3.65% to 4.65% over CPI
Risk Tolerances: Expected downside not to exceed –16.0% to -20.0% per year based on a statistical confidence level of 95% (1)
Long Term
Strategic Asset Investment Primary Peer Group
Lower Limit Allocation Upper Limit Category Manager Index Universe
Domestic Equity Domestic Equity
Large Cap Equity 16.00% 25.00% 35.00% Large Cap Equity Vanguard Inst Index 500 S&P 500 Lrg Cap Core
Vanguard S&P 500 ETF S&P 500 Lrg Cap Core
Small/Mid Cap Equity 5.00% 10.00% 16.00% Small/Mid Cap Equity Vanguard Mid Cap ETF CRSP US Mid Cap Index Mid Cap Core
Vanguard Mid Cap Index CRSP US Mid Cap Index Mid Cap Core
Vanguard Small Cap ETF CRSP US Small Cap Index Small Cap Core
Vanguard Small Cap Index CRSP US Small Cap Index Small Cap Core
International Equity 7.00% 12.00% 20.00% International Equity Vanguard Total Intl ETF FTSE Global ex US All Cap Intl Equity
Vanguard Total Int'l Stock FTSE Global ex US All Cap Intl Equity
Emerging Markets 5.00% 9.00% 10.00% Emerging Markets Vanguard Emerging Markets FTSE Emerging Markets Emerging Mkts
Fixed Income 5.00% 17.00% 35.00% Fixed Income Vanguard Total Bond Market Barclays Aggregate Core Fixed
High Yield 0.00% 2.00% 4.00% High Yield JP Morgan High Yield Bloomberg Barclays HY High Yield
Floating Rate Corporate Loans 0.00% 6.00% 9.00% Floating Rate Corporate Loans Eaton Vance Floating Rate CSFB Lev Ln Loan Part
Commodities 0.00% 5.00% 7.00% Commodities Credit Suisse Commodity Bloomberg Commodity NA
Real Estate 4.00% 8.00% 10.00% Real Estate UBS Trumbull Property Fund NCREIF ODCE Index Real Estate
Barings Core Property Fund NCREIF ODCE Index Real Estate
Absolute Return Funds Absolute Return Funds
Conservative Absolute Return Funds 0.00% 0.00% 15.00% Conservative Absolute Return Fd Private Advisors Stable Value Fund, Ltd HFRI FoF Conservative NA
Absolute Return Funds Absolute Return Funds TIFF Absolute Return Pool HFRI FoF NA
Private Equity 2.00% 4.00% 9.00% Private Equity Common Fund Capital VIII NA NA
Common Fund Capital Int'l NA NA
Portfolio Advisors Private Equity VI NA NA
TIFF PE Partners 2011 NA NA
Illiquid Credit 1.00% 2.00% 7.00% Illiquid Credit Portfolio Advisors Private Equity VII - SS NA NA
100.00%
Total Portfolio Strategic Benchmark*:
26.60% S&P 500
7.09% CRSP US Mid Cap Index
3.55% CRSP US Small Cap Index
12.77% FTSE Global ex US All Cap
9.57% FTSE Emerging Markets
18.09% Barclays Aggregate
2.13% Bloomberg Barclays HY
6.38% CSFB Lev Ln
5.32% Bloomberg Commodity
8.51% NCREIF ODCE Index
0.00% HFRI FoF Conservative
0.00% HFRI FoF
Total Portfolio Secondary Benchmark: CPI + 4.15%
*The benchmark allocation to Private Equity and Illiquid Credit will not be made until the portfolio allocation approaches the strategic target of 6% and 4%, respectively.
SDSM&T INVESTMENT POLICY SUMMARY - Updated June 2017
Client Variables
Asset Allocation Performance Benchmarks
(1) There is a 5% probability that the 1 year modeled loss of -15.4% to -18.4% will be exceeded based on 2017 capital markets assumptions. NOTE: The one-year modeled
loss will vary from year to year depending on future capital market assumptions.
INTEGRITY. BALANCE. OBJECTIVITY.15

March 31, 2017
Allocation Differences
0.0% 4.0% 8.0% 12.0%-4.0 %-8.0 %
Cash & Equivalents
Illiquid Credit
Private Equity
Absolute Return Funds
Real Estate
Commodities
Floating Rate Corporate Loans
High Yield
Fixed Income
Emerging Markets Equity
International Equity
Smid Cap Equity
Large Cap Equity
0.2%
0.5%
-0.1 %
4.8%
-0.7 %
-0.2 %
-0.1 %
0.0%
-3.8 %
0.5%
0.6%
-0.1 %
-1.6 %
June 30, 2017
Allocation Differences
0.0% 3.0% 6.0%-3.0 %-6.0 %
Cash & Equivalents
Illiquid Credit
Private Equity
Absolute Return Funds
Real Estate
Commodities
Floating Rate Corporate Loans
High Yield
Fixed Income
Emerging Markets Equity
International Equity
Smid Cap Equity
Large Cap Equity
0.3%
-0.2 %
-0.3 %
3.0%
-0.7 %
-0.4 %
-0.2 %
0.0%
-1.8 %
0.7%
1.0%
0.0%
-1.4 %
March 31, 2017
Market Value($)
Allocation(%)
Target(%)
Large Cap Equity 12,654,278 23.36 25.00
Smid Cap Equity 5,388,740 9.95 10.00
International Equity 6,811,818 12.58 12.00
Emerging Markets Equity 5,152,277 9.51 9.00
Fixed Income 7,166,794 13.23 17.00
High Yield 1,062,675 1.96 2.00
Floating Rate Corporate Loans 3,175,261 5.86 6.00
Commodities 2,621,979 4.84 5.00
Real Estate 3,977,851 7.34 8.00
Absolute Return Funds 2,612,907 4.82 0.00
Private Equity 2,102,900 3.88 4.00
Illiquid Credit 1,327,863 2.45 2.00
Cash & Equivalents 112,902 0.21 0.00
Total Fund 54,168,246 100.00 100.00
June 30, 2017
Market Value($)
Allocation(%)
Target(%)
Large Cap Equity 13,026,616 23.59 25.00
Smid Cap Equity 5,506,555 9.97 10.00
International Equity 7,170,724 12.98 12.00
Emerging Markets Equity 5,331,036 9.65 9.00
Fixed Income 8,408,253 15.22 17.00
High Yield 1,080,811 1.96 2.00
Floating Rate Corporate Loans 3,205,694 5.80 6.00
Commodities 2,537,739 4.60 5.00
Real Estate 4,037,107 7.31 8.00
Absolute Return Funds 1,668,357 3.02 0.00
Private Equity 2,065,114 3.74 4.00
Illiquid Credit 1,005,658 1.82 2.00
Cash & Equivalents 184,293 0.33 0.00
Total Fund 55,227,958 100.00 100.00
Asset Allocation vs. Target Allocation
INTEGRITY. BALANCE. OBJECTIVITY.16

Allocation
MarketValue
($)%
Performance(%)
LastQuarter
Jul-2016To
Jun-2017
YearTo Date
1Year
3Years
5Years
Apr-2009To
Jun-2017Since Innovest
SinceInception
InceptionDate
Large Cap Equity
Vanguard Institutional Index 8,935,160 16.18 3.08 (48) 17.86 (44) 9.32 (36) 17.86 (44) 9.59 (15) 14.60 (20) 16.86 (15) 13.51 (40) 09/01/2016
S&P 500 Index 3.09 (47) 17.90 (43) 9.34 (35) 17.90 (43) 9.61 (15) 14.63 (19) 16.87 (15) 13.54 (40)
IM U.S. Large Cap Core Equity (MF) Median 3.02 17.24 8.76 17.24 8.06 13.63 15.42 12.95
Vanguard S&P 500 ETF 4,091,456 7.41 3.07 (48) 17.86 (44) 9.31 (36) 17.86 (44) 9.57 (15) 14.59 (20) N/A 13.52 (40) 09/01/2016
S&P 500 Index 3.09 (47) 17.90 (43) 9.34 (35) 17.90 (43) 9.61 (15) 14.63 (19) 16.87 (15) 13.54 (40)
IM U.S. Large Cap Core Equity (MF) Median 3.02 17.24 8.76 17.24 8.06 13.63 15.42 12.95
Large Cap Equity Composite 13,026,616 23.59 3.08 17.98 9.32 17.98 7.85 13.39 15.56 15.56 04/01/2009
S&P 500 Index 3.09 17.90 9.34 17.90 9.61 14.63 16.87 16.87
Small/Mid Equity
Vanguard Mid Cap ETF 1,242,774 2.25 2.47 (35) 16.89 (44) 8.81 (15) 16.89 (44) 7.96 (15) 14.71 (14) 18.37 (10) 11.54 (49) 09/01/2016
CRSP U.S. Mid Cap TR Index 2.79 (26) 17.31 (37) 9.17 (11) 17.31 (37) 8.12 (13) 14.79 (13) 18.42 (9) 11.93 (43)
IM U.S. Mid Cap Core Equity (MF) Median 1.79 16.35 6.14 16.35 5.95 13.01 16.10 11.52
Vanguard Mid Cap Index 1,441,161 2.61 2.77 (27) 17.25 (38) 9.13 (12) 17.25 (38) 8.07 (14) 14.78 (13) 18.42 (9) 11.88 (43) 09/01/2016
CRSP U.S. Mid Cap TR Index 2.79 (26) 17.31 (37) 9.17 (11) 17.31 (37) 8.12 (13) 14.79 (13) 18.42 (9) 11.93 (43)
IM U.S. Mid Cap Core Equity (MF) Median 1.79 16.35 6.14 16.35 5.95 13.01 16.10 11.52
Vanguard Small Cap ETF 1,504,765 2.72 1.94 (43) 19.13 (82) 5.75 (14) 19.13 (82) 6.78 (51) 14.13 (43) 18.80 (23) 12.68 (74) 09/01/2016
CRSP U.S. Small Cap TR Index 1.93 (43) 19.09 (82) 5.75 (14) 19.09 (82) 6.75 (51) 14.34 (37) 19.20 (17) 12.65 (74)
IM U.S. Small Cap Core Equity (MF) Median 1.71 22.11 2.52 22.11 6.79 13.71 16.52 14.76
Vanguard Small Cap Index 1,317,854 2.39 1.95 (42) 19.14 (82) 5.76 (14) 19.14 (82) 6.78 (51) 14.13 (43) 18.80 (23) 12.67 (74) 09/01/2016
CRSP U.S. Small Cap TR Index 1.93 (43) 19.09 (82) 5.75 (14) 19.09 (82) 6.75 (51) 14.34 (37) 19.20 (17) 12.65 (74)
IM U.S. Small Cap Core Equity (MF) Median 1.71 22.11 2.52 22.11 6.79 13.71 16.52 14.76
Smid Cap Equity Composite 5,506,555 9.97 2.28 18.06 7.30 18.06 7.25 13.26 15.95 15.95 04/01/2009
SMid Cap Composite Benchmark 2.37 19.45 7.46 19.45 7.13 14.33 18.40 18.40
Asset Allocation & Performance
All Products are Net of Managers' Fees.Total Fund Return is Net of all Innovest, Mutual Fund, Hedge Fund and Separate Account Fees.*Returns are provided on the fund pages **30% S&P 500, 12% Russell 2500, 17% MSCI EAFE, 11% MSCI Emerging Markets, 30% Barclays Agg
INTEGRITY. BALANCE. OBJECTIVITY.17

Asset Allocation & PerformanceAllocation
MarketValue
($)%
Performance(%)
LastQuarter
Jul-2016To
Jun-2017
YearTo Date
1Year
3Years
5Years
Apr-2009To
Jun-2017Since Innovest
SinceInception
InceptionDate
International Equity
Vanguard Total Intl ETF 3,253,322 5.89 6.36 (54) 20.69 (46) 15.34 (58) 20.69 (46) 1.52 (55) 7.79 (55) N/A 14.74 (43) 09/01/2016
FTSE Global ex USA All Cap Index (Net) 5.71 (70) 20.41 (48) 14.06 (74) 20.41 (48) 1.37 (58) 7.81 (55) 10.86 (51) 14.08 (51)
IM International Equity (SA+CF+MF) Median 6.49 20.07 16.07 20.07 1.79 8.12 10.86 14.15
Vanguard Total Intl Stock Index 3,917,402 7.09 5.82 (68) 20.05 (44) 14.79 (33) 20.05 (44) 1.35 (46) 7.68 (67) N/A 3.60 (46) 10/01/2014
FTSE Global ex USA All Cap Index (Net) 5.71 (73) 20.41 (35) 14.06 (63) 20.41 (35) 1.37 (45) 7.81 (62) 10.86 (25) 3.53 (49)
IM Intl Multi-Cap Core Equity (MF) 6.18 19.84 14.45 19.84 1.24 8.29 10.16 3.50
International Equity Composite 7,170,724 12.98 6.07 20.56 15.04 20.56 1.82 6.81 9.03 9.03 04/01/2009
Intl Equity Composite Benchmark 5.71 20.13 14.06 20.13 1.14 8.69 10.41 10.41
Emerging Markets Equity
Vanguard Emerging Markets Stock Idx 5,331,036 9.65 3.47 (87) 18.86 (64) 14.69 (81) 18.86 (64) 0.64 (52) 3.36 (61) 9.41 (59) 9.54 (81) 11/01/2016
FTSE Emerging Mkts All Cap Index 3.83 (83) 19.67 (58) 14.35 (83) 19.67 (58) 1.67 (30) 4.53 (38) 10.50 (34) 9.55 (80)
IM Emerging Markets Equity (MF) Median 5.95 21.14 18.68 21.14 0.69 3.84 9.78 12.89
Fixed Income
Vanguard Total Bond Market Idx 8,408,253 15.22 1.48 (46) -0.44 (77) 2.40 (52) -0.44 (77) 2.43 (33) 2.13 (60) 3.98 (78) 2.50 (61) 10/01/2015
Bloomberg Barclays U.S. Aggregate Index 1.45 (52) -0.31 (73) 2.27 (62) -0.31 (73) 2.48 (27) 2.21 (54) 4.06 (76) 2.48 (62)
IM U.S. Broad Mkt Core Fxd Income (MF) 1.45 0.32 2.41 0.32 2.19 2.27 4.89 2.67
High Yield
JPMorgan High Yield Select 1,080,811 1.96 1.71 (58) 10.25 (64) 4.03 (57) 10.25 (64) 3.30 (45) 5.95 (42) 10.89 (53) 9.01 (50) 07/01/2009
Bloomberg Barclays U.S. Corporate High Yield 2.17 (20) 12.70 (19) 4.93 (18) 12.70 (19) 4.48 (10) 6.89 (13) 12.80 (8) 10.32 (10)
IM U.S. High Yield Bonds (MF) Median 1.78 10.86 4.20 10.86 3.11 5.76 10.95 9.01
Floating Rate Corporate Loans
Eaton Vance Floating Rate; I 3,205,694 5.80 0.96 (11) 8.23 (23) 2.44 (11) 8.23 (23) 3.58 (5) 4.19 (27) 8.24 (22) 3.72 (16) 07/01/2013
CSFB Leveraged Loan 0.76 (24) 7.47 (35) 1.97 (21) 7.47 (35) 3.48 (9) 4.82 (3) 8.78 (12) 4.13 (3)
Loan Participation Mutual Funds Median 0.56 6.82 1.46 6.82 2.66 3.77 7.22 3.14
Commodities
Credit Suisse Comm. Return Strategy 2,537,739 4.60 -3.21 (21) -5.86 (28) -4.93 (27) -5.86 (28) -14.46 (41) -9.20 (50) -3.18 (46) -2.41 (53) 10/01/2015
Bloomberg Commodity Index Total Return -3.00 (15) -6.50 (38) -5.26 (31) -6.50 (38) -14.81 (46) -9.25 (50) -3.25 (47) -3.04 (62)
IM Commodities General (MF) Median -4.01 -7.21 -5.91 -7.21 -15.19 -9.29 -3.69 -2.36
All Products are Net of Managers' Fees.Total Fund Return is Net of all Innovest, Mutual Fund, Hedge Fund and Separate Account Fees.*Returns are provided on the fund pages **30% S&P 500, 12% Russell 2500, 17% MSCI EAFE, 11% MSCI Emerging Markets, 30% Barclays Agg
INTEGRITY. BALANCE. OBJECTIVITY.18

Asset Allocation & PerformanceAllocation
MarketValue
($)%
Performance(%)
LastQuarter
Jul-2016To
Jun-2017
YearTo Date
1Year
3Years
5Years
Apr-2009To
Jun-2017Since Innovest
SinceInception
InceptionDate
Real Estate
UBS Trumbull Property Fund 1,967,001 3.56 1.18 (90) 5.60 (95) 2.34 (100) 5.60 (95) 9.62 (95) 9.82 (95) 8.31 (84) 11.39 (95) 04/01/2010
NCREIF ODCE 1.71 (72) 7.88 (65) 3.51 (64) 7.88 (65) 11.34 (58) 11.79 (64) 8.91 (69) 13.26 (68)
IM U.S. Open End Private RE (SA+CF) 1.91 8.31 3.77 8.31 11.81 12.39 9.39 14.09
Barings Core Property Fund 2,070,107 3.75 1.81 (64) 8.36 (45) 3.35 (69) 8.36 (45) 10.91 (63) 10.61 (85) 8.49 (79) 12.04 (85) 04/01/2010
NCREIF ODCE 1.71 (72) 7.88 (65) 3.51 (64) 7.88 (65) 11.34 (58) 11.79 (64) 8.91 (69) 13.26 (68)
IM U.S. Open End Private RE (SA+CF) 1.91 8.31 3.77 8.31 11.81 12.39 9.39 14.09
Real Estate Composite 4,037,107 7.31 1.50 7.01 2.86 7.01 10.30 10.20 N/A 11.72 04/01/2010
NCREIF ODCE 1.71 7.88 3.51 7.88 11.34 11.79 8.91 13.26
Conservative Absolute Return Funds
Private Advisors Stable Val Fund, Ltd. 940,346 1.70 0.80 8.37 2.87 8.37 0.60 3.27 4.44 4.44 04/01/2009
HFRI FOF: Conservative Index 0.37 5.15 1.58 5.15 1.45 3.61 3.49 3.49
Absolute Return Funds
TIFF Absolute Return Pool 728,011 1.32 0.03 2.64 2.33 2.64 1.00 5.00 7.17 1.08 01/01/2014
HFRI Fund of Funds Composite Index 0.70 6.37 3.10 6.37 1.52 3.85 3.70 1.91
Absolute Return Funds Composite 1,668,357 3.02 0.46 6.26 2.61 6.26 1.55 3.36 2.65 2.65 04/01/2009
Absolute Return Funds Benchmark 0.53 5.76 2.34 5.76 1.48 3.73 3.51 3.51
Private Equity*
CommonFund Capital PE VIII 469,618 0.85 N/A N/A N/A N/A N/A N/A N/A N/A 12/01/2011
Common Fund Capital Int'l 207,975 0.38 N/A N/A N/A N/A N/A N/A N/A N/A 04/01/2011
Port Advisors PAPEF VI 1,000,176 1.81 N/A N/A N/A N/A N/A N/A N/A N/A 04/01/2009
TIFF PE Partners 2011 387,345 0.70 N/A N/A N/A N/A N/A N/A N/A N/A 06/01/2011
Illiquid Credit*
Port Advisors PAPEF VII 1,005,658 1.82 N/A N/A N/A N/A N/A N/A N/A N/A 10/01/2012
Total Fund
SDSM Foundation Total Fund - Net 55,227,958 100.00 2.17 11.43 6.64 11.43 3.50 7.02 8.75 4.77 10/01/2003
SDSM Foundation Total Fund - Gross 2.17 11.63 6.70 11.63 3.77 7.36 9.14 5.00
SDSM Custom Benchmark 2.54 12.32 7.14 12.32 4.11 8.22 10.46 6.69
Return Benchmark (CPI + SDSM&T) 1.50 6.03 3.54 6.03 5.79 6.67 7.33 7.98
Spending Benchmark (HEPI + 5.5%) N/A N/A N/A N/A N/A N/A N/A N/A
70% MSCI ACWI / 30% Barclays Global Agg 3.90 12.63 9.57 12.63 3.75 8.04 10.66 7.26
70% Global Eq/30% Barclays Agg** 3.39 13.60 8.59 13.60 5.01 8.82 11.68 7.96
All Products are Net of Managers' Fees.Total Fund Return is Net of all Innovest, Mutual Fund, Hedge Fund and Separate Account Fees.*Returns are provided on the fund pages **30% S&P 500, 12% Russell 2500, 17% MSCI EAFE, 11% MSCI Emerging Markets, 30% Barclays Agg
INTEGRITY. BALANCE. OBJECTIVITY.19

Fund Type Commitment ContributedOutstanding Commitment
Percent Contributed Distributed Current Value Total Value
Total Value/Paid‐In
Estimated Inception‐to‐Date IRR
Date of First Capital CallTotal Value
PAPEF VI Private Equity $1,500,000 $971,182 $528,818 65% $481,261 $1,044,114 $1,525,375 1.57 x 10.98% 14.96% 1 2/23/2009
Commonfund Private Equity Partners VIII Private Equity $700,000 $402,500 $297,500 58% $73,113 $471,104 $544,217 1.35 x 14.03% NM 1 12/31/2011
Commonfund International Equity Partners (CIP VII) Private Equity $300,000 $196,800 $103,200 66% $40,758 $202,637 $243,395 1.24 x 7.30% NM 1 3/31/2011
TIFF Private Equity Partners 2011 Private Equity $500,000 $385,000 $115,000 77% $117,782 $349,738 $467,520 1.21 x 9.09% NM 1 5/27/2011PAPEF VIIPAPEF VII ‐ Special Situations Illiquid Credit $2,000,000 $1,112,628 $887,372 56% $90,696 $1,327,863 $1,418,559 1.27 x 7.58% 5.35% 2 10/15/2012PAPEF VII ‐ Special Situations Diversified
Based on 12/31/2016 Market ValuesNM ‐ Not Yet Meaningful
2 Weighted Index Return is the approximate return an investor would have received from the Barclays High Yield Index using the same cash flow timeline as the fund throughout the fund's life.
1 Weighted Index Return is the approximate return an investor would have received from the S&P 500 using the same cash flow timeline as the fund throughout the fund's life.
Estimated Weighted
Index Return
SDSM&T Summary of Private Investments
Total Value/Paid‐In (TVPI) measures the total value of the cumulative distributions to investors plus the total value of the unrealized investments relative to the total capital drawn from investors.
Estimated Inception‐to‐Date IRR and Estimated Weighted Index Return represent the total value‐weighted average of underlying fund sector IRRs and Weighted Index Returns for funds that report performance by sector. Consult Capital Account statement to see underlying figures.
INTEGRITY. BALANCE. OBJECTIVITY.20
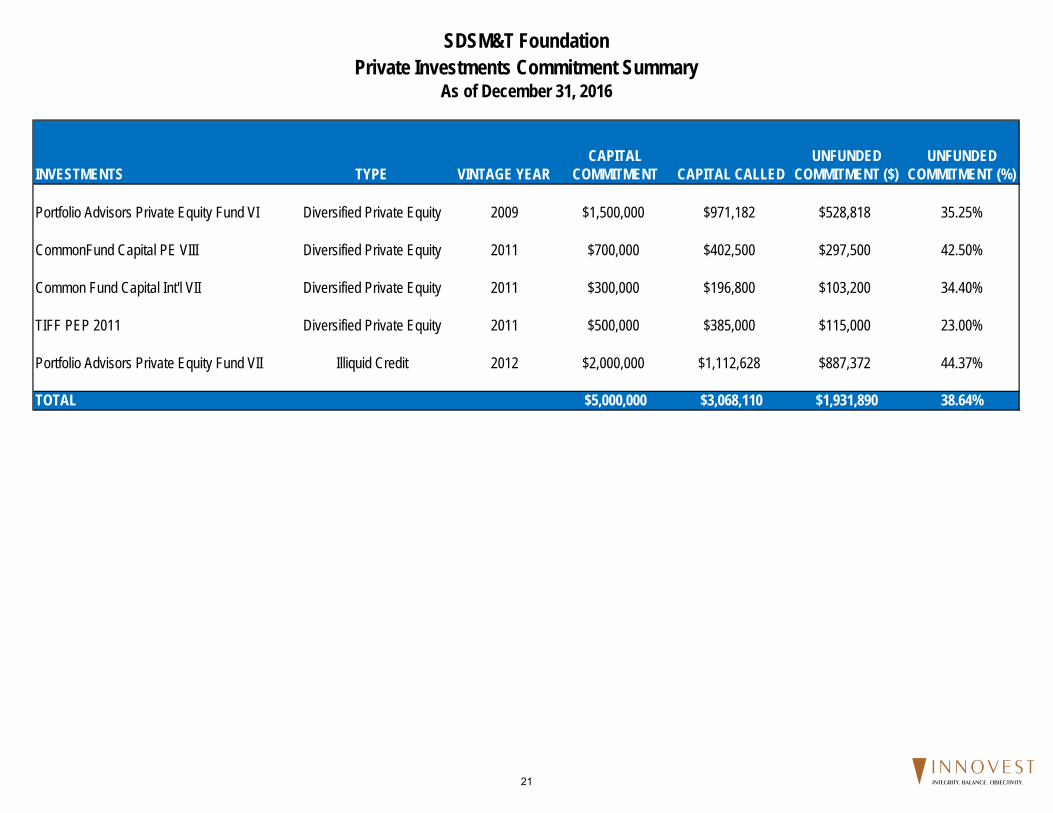
SDSM&T FoundationPrivate Investments Commitment Summary
As of December 31, 2016
INVESTMENTS TYPE VINTAGE YEARCAPITAL
COMMITMENT CAPITAL CALLEDUNFUNDED
COMMITMENT ($)UNFUNDED
COMMITMENT (%)
Portfolio Advisors Private Equity Fund VI Diversified Private Equity 2009 $1,500,000 $971,182 $528,818 35.25%
CommonFund Capital PE VIII Diversified Private Equity 2011 $700,000 $402,500 $297,500 42.50%
Common Fund Capital Int'l VII Diversified Private Equity 2011 $300,000 $196,800 $103,200 34.40%
TIFF PEP 2011 Diversified Private Equity 2011 $500,000 $385,000 $115,000 23.00%
Portfolio Advisors Private Equity Fund VII Illiquid Credit 2012 $2,000,000 $1,112,628 $887,372 44.37%
TOTAL $5,000,000 $3,068,110 $1,931,890 38.64%
INTEGRITY. BALANCE. OBJECTIVITY.21

SDSM&TFLiquidity Schedule As of: 12/31/2016 (updated annually)
Asset Class Manager One Week One Month One Quarter Two Quarters Three Quarters One Year Illiquid2 Contributions Withdrawals Notice Lock
Large CapVanguard Insititutional Index 7,927,752$ 7,927,752$ Vanguard S&P 500 ETF 3,782,837$ 3,782,837$ Daily Daily None None
Mid CapVanguard Mid Cap Index 1,320,543$ 1,320,543$ Vanguard Mid Cap ETF 1,147,814$ 1,147,814$ Daily Daily None None
Small CapVanguard Small Cap Index 1,246,081$ 1,246,081$ Vanguard Small Cap ETF 1,431,714$ 1,431,714$ Daily Daily None None
InternationalVanguard Total International Stock Index 3,168,453$ 3,168,453$ Daily Daily None NoneVanguard Total International ETF 2,872,088$ 2,872,088$ Daily Daily None None
Emerging MarketsVanguard Emerging Markets Stock Index 4,501,792$ 4,501,792$ Daily Daily None None
Fixed IncomeVanguard Total Bond Market Index 5,891,860$ 5,891,860$ Daily Daily None None
High YieldJP Morgan High Yield Select 1,038,915$ 1,038,915$ Daily Daily None None
Floating Rate Corporate LoansEaton Vance Floating Rate 3,129,266$ 3,129,266$ Daily Daily None None
CommoditiesCredit Suisse Commodity 2,669,364$ 2,669,364$ Daily Daily None None
Real EstateUBS Trumbull Property Fund3, 6, 7 1,933,071$ 1,933,071$ Quarterly Quarterly 60 Days NoneBarings Core Property Fund3, 8 2,044,779$ 2,044,779$ Quarterly Quarterly 30 days None
Hedging StrategiesPrivate Advisors Stable Value Fund3, 5, 11 2,056,772$ 2,056,772$ N/A Liq. Schedule N/A N/ATIFF Absolute Return Pool3, 9, 10, 11 1,059,561$ 335,528$ 335,528$ 335,528$ 52,978$ Monthly Liq. Schedule 30 days N/A
Private EquityCommonFund Capital PE VIII4 445,395$ 445,395$ N/A N/A N/A N/ACommonFund Capital International VII4 190,058$ 190,058$ N/A N/A N/A N/APortfolio Advisors PAPEF VI4 1,060,608$ 1,060,608$ N/A N/A N/A N/ATIFF PE Partners 20114 344,795$ 344,795$ N/A N/A N/A N/A
Illiquid CreditPortfolio Advisors PAPEF VII4 1,244,825$ 1,244,825$ N/A N/A N/A N/A
CashCash 1,388,797$ 1,388,797$ Daily Daily None None
Total Portfolio 51,897,140$ 41,517,276$ -$ 335,528$ 2,380,307$ 2,268,599$ 2,109,750$ 3,285,681$
% of Portfolio 80.0% 0.0% 0.6% 4.6% 4.4% 4.1% 6.3%% of Portfolio Cumulative 80.0% 80.0% 80.6% 85.2% 89.6% 93.7% 100.0%1Cash availability assumes that the notice would be give at the beginning of the quarter/month.2Illiquid means it will take more than one year for cash to become available.3Market Value as of 12/31/2016. Liquidity4Market Value as of 9/30/2016. One Week 80.0%5This liquidity schedule follows the continued redemption process for the Portfolio Advisors Stable Value Fund. Cash flows will be intermittent based on underlying funds. One Month 0.0%
One Quarter 0.6%Two Quarters 4.6%Three Quarters 4.4%One Year 4.1%Illiquid 6.3%
8Liquidation timeline based on conservative estimates generated by adding one quarter to the Fund's stated withdrawal period.
11For Hedge Fund of Funds, the total redemption might be gated by the fund and the fund may hold back 5-10% of the investment until the final audit is completed.
10Request for 100% redemption submitted 2/3/2017.
Cash Availability1
Market Value (12/31/2016)
7To redeem all or a portion of the investment value, investors must notify the GP in writing at least 60 days prior to the relevant valuation date (typically, the last business day of the quarter). If total fund redemption requests exceed 50% of available cash in any period, the fund will apply the allocation of available cash to redeem each requesting investor on a pro rata basis. Redemptions will be paid after the end of the quarter in which the redemption request occurs.
6The GP holds "closings" on a quarterly basis on the first business day of each quarter or other date at GP's discretion for existing and new investors to buy in to the fund. Number of shares offered at each closing will be based on the fund's NAV at the valuation date (typically, the last business day of each quarter).
9Partial redemption proceeds will be paid as soon as practical after the determination of the final NAV applicable to such series of shares, typically within 30 days of month-end. If redeeming all shares, 95% (subject to director discretion) of proceeds will be paid with standard redemption procedures, typically within 30 days of month-end with the residual amount sent after the fund's audit is completed, typically the following June.
One Week80.0%
One Quarter0.6%
Two Quarters4.6%
Three Quarters4.4%
One Year4.1%
Illiquid6.3%
INTEGRITY. BALANCE. OBJECTIVITY.22

Cumulative Returns
Risk and Return
SDSM Foundation Total Fund SDSM Custom Benchmark Spending Benchmark (HEPI + 5.5%)
-50 %
0%
50%
100%
150%
200%
6/09 12/09 6/10 12/10 6/11 12/11 6/12 12/12 6/13 12/13 6/14 12/14 6/15 12/15 6/16 12/16 6/17
6
9
12
15
18
21
Re
turn
(%)
5 6 7 8 9 10 11 12 13 14 15
Risk (Standard Deviation %)
SDSM Foundation Total Fund
S&P 500 Index
Total Portfolio Performance AnalysisAs of June 30,2017
Since 4/1/2009
INTEGRITY. BALANCE. OBJECTIVITY.23

-1.0
2.0
5.0
8.0
11.0
14.0
17.0
20.0 Return
-1.0
-0.1
0.8
1.7
2.6
3.5
4.4
5.3
6.2
7.1
SharpeRatio
1Year
3Years
5Years
Apr-2009To
Jun-2017
1Year
3Years
5Years
Apr-2009To
Jun-2017
SDSM Foundation Total Fund 11.63 (67) 3.77 (61) 7.36 (67) 9.14 (56) 3.94 (48) 0.70 (55) 1.41 (63) 1.15 (47)¢
SDSM Custom Benchmark 12.32 (60) 4.11 (51) 8.22 (35) 10.46 (35) 4.53 (30) 0.73 (51) 1.46 (50) 1.12 (55)�
70% MSCI ACWI / 30% Barlcays Global Agg 12.63 (59) 3.75 (61) 8.04 (43) 10.66 (33) 2.34 (96) 0.60 (69) 1.27 (87) 0.95 (100)p
5th Percentile 15.10 5.08 9.47 11.85 5.60 1.17 1.65 1.41
1st Quartile 13.80 4.52 8.81 11.16 4.61 0.85 1.56 1.23
Median 13.17 4.11 7.72 9.65 3.83 0.73 1.45 1.14
3rd Quartile 11.01 3.27 7.17 8.30 3.31 0.56 1.30 1.07
95th Percentile 5.99 1.98 6.36 7.02 2.50 0.40 1.14 0.95
Population 39 36 30 22 39 36 30 22
Risk Statistics vs. Peer GroupSmall Endowment/Foundations (AUM <$100mm and Equity Allocation <60%)
June 30, 2017
Parentheses contain percentile rankings.Calculation based on quarterly periodicity.
INTEGRITY. BALANCE. OBJECTIVITY.24