Investor Relations | Wirecard - Quarterly Statement for the first … · EUR 20.1 billion (Q1 2018:...
24
Wirecard AG Quartalsmitteilung für das erste Quartal 2018 1 Transaction volume increased by 37.4 percent Consolidated revenues increased by 34.8 percent EBITDA increase by 40.7 percent Earnings after taxes rose by 50.0 percent Free cash flow increased by 37.5 percent EBITDA 2019 guidance raised Wirecard Group Q1 2019 Q1 2018 Revenues 566.7 420.4 in EUR million EBITDA 158.0 112.3 in EUR million EBIT 126.5 88.4 in EUR million Earnings per share (basic) 0.86 0.57 EUR Equity 2,047.8 1,670.0 in EUR million Total assets / total equity and liabilities 6,489.7 4,697.6 in EUR million Cash flow from operating activities (adjusted) 143.4 87.4 in EUR million Employees (average) 5,502 4,913 of which part-time 331 346 CEO Markus Braun: “The convergence of digital payment with innovative value-added services in the field of financial services and data-driven services on one platform will drive the formation of one of the world’s largest growth markets.”
Transcript of Investor Relations | Wirecard - Quarterly Statement for the first … · EUR 20.1 billion (Q1 2018:...

Wirecard AG Quartalsmitteilung für das erste Quartal 2018 1
Transaction volume increased by 37.4 percent
Consolidated revenues increased by 34.8 percent
EBITDA increase by 40.7 percent
Earnings after taxes rose by 50.0 percent
Free cash flow increased by 37.5 percent
EBITDA 2019 guidance raised
Wirecard Group Q1 2019 Q1 2018
Revenues 566.7 420.4 in EUR million
EBITDA 158.0 112.3 in EUR million
EBIT 126.5 88.4 in EUR million
Earnings per share (basic) 0.86 0.57 EUR
Equity 2,047.8 1,670.0 in EUR million
Total assets / total equity and liabilities 6,489.7 4,697.6 in EUR million
Cash flow from operating activities (adjusted) 143.4 87.4 in EUR million
Employees (average) 5,502 4,913
of which part-time 331 346
CEO Markus Braun: “The convergence of digital payment with innovative value-added services in the field of financial
services and data-driven services on one platform will drive the formation of one of the world’s largest growth markets.”

Quarterly Statement for the first quarter of 2019
Preliminary remark about this Quarterly
Statement
Wirecard AG (hereafter also referred to as “Wirecard” or
the “Group”) generally publishes its figures in EUR million
or EUR billion, respectively. As a result of rounding, it is
possible that the individual figures do not add up exactly
to form the totals stated and that the figures and percent-
ages do not give an exact representation of the absolute
values to which they relate.
The comparability of the figures is limited due to the first
time application of IFRS 16 (Leases) as of 1 January 2019
and the absence of retrospective presentation for the fis-
cal year 2018. Furthermore, the figures for the compara-
tive period 2018 were only partially restated as part of ad-
justments made in accordance with IAS 8, in particular the
figures for the consolidated statement of profit or loss and
the consolidated statement of cash flows for the compar-
ative period from 1 January to 31 March 2018 are un-
changed from the previous year's quarterly report. In this
context, we also refer to the explanations in the explana-
tory notes in section 2.6 Amendments to accounting and
valuation policies that do not yet require mandatory appli-
cation as well as 2.7 Corrections in accordance with IAS
8 in the Annual Report 2018.
Information about Wirecard
Wirecard (GER:WDI) is one of the world’s fastest growing
digital platforms in the area of financial commerce. We
provide both business customers and consumers with a
constantly expanding ecosystem of real-time value-added
services built around innovative digital payments by using
an integrated B2B2C approach. This ecosystem
concentrates on the areas payment & risk, retail &
transaction banking, loyalty & couponing, data analytics &
conversion rate enhancement in all sales channels
(online, mobile, ePOS). Wirecard operates regulated
financial institutions in several key markets and holds
issuing and acquiring licenses from all major payment and
card networks. Wirecard AG is listed on the Frankfurt
Stock Exchange (DAX and TecDAX, ISIN
DE0007472060). Visit us on www.wirecard.com, follow us
on Twitter @wirecard and on Facebook @wirecardgroup.
Business performance in the period under
review
From a macroeconomic perspective, there are positive
growth opportunities unchanged for the sales markets rel-
evant to Wirecard despite geopolitical and financial policy
uncertainties. Due to the global market presence of Wire-
card and its numerous international locations, a stable risk
diversification in terms of regional political and economic
uncertainties on the market has been achieved. From an
industry perspective, Wirecard continues to participate in
the significant growth of the payment industry. In its
“World Payment Report 2018” study, the company
Capgemini expects cashless payments to grow by around
14 percent per year up to 2021. Emerging countries in Asia
(such as Malaysia, Thailand and Indonesia) will experi-
ence the highest growth rates in this sector of around 29
percent per year. The trend towards digitalisation of the
entire payment ecosystem is continuing across all sectors
and sales channels. Digital payment solutions are emerg-
ing along the whole value added chain that are character-
ised by innovation, efficiency, security and convenience
for the customer.
Wirecard achieved its operating targets and increased the
number of large and medium-sized customers to around
42 thousand. The number of small customers is around
251 thousand. In the company’s core business, it was
possible to expand cooperation with numerous existing
customers and partners. New customers were acquired
from all industries and sectors. For example, the business
relationship with Ctrip, Qixxit, Ringana, Swatch, United
Money, P.F.C., Google Pay, BASF, Stockmann, Oney,
Sony, Segmüller, Tirol Werbung, Twisto, Beşiktaş JK, Tal-
link Grupp, MBILLS, ANA Group, Elush Retail Group, Al
Ansari Exchange, O2, RBL Bank, Feinkost Käfer was
newly established or expanded during or after the period
under review.
3
Wirecard - Quarterly Statement for the first quarter of 2019 3
After the period under review, Wirecard has announced
the planning of the strategic partnership with TON Labs,
infrastructure developer for the Telegram Open Network
(TON). Telegram is a cloud-based multi-platform messag-
ing application focused on security and performance with
more than 200 million active users all over the world. TON
is a multi-chain architecture introduced by Telegram in-
stant messaging service developers. Wirecard and TON
Labs plan their collaboration to develop joint digital finan-
cial services, payments and banking platform.
After the period under report, the Company and SoftBank
Group Corp., Japan, have signed a binding term sheet
(MoU) under which an affiliate of SoftBank Group shall in-
vest approximately EUR 900 million in Wirecard via a con-
vertible bond mechanism and a strategic partnership for
digital payment solutions to enhance business in Japan
and South Korea shall be formed.
For means of the financial investment, Wirecard shall is-
sue convertible bonds with a term of five years exclusively
to SoftBank, convertible to 6,923,076 ordinary Wirecard
shares (currently corresponding to approximately 5.6 per-
cent of common stock) at EUR 130 per Wirecard share.
The intended issuance of convertible bonds, under exclu-
sion of subscription rights, is subject to the approval of
Wirecard's Annual Shareholders meeting to be held on
18 June 2019.
Within the scope of the strategic partnership for digital
payment solution, SoftBank Group will seek to support
Wirecard's geographic expansion into Japan and South
Korea, as well as providing collaboration opportunities
within SoftBank Group's global portfolio in digital pay-
ments, data-analytics/ Artificial Intelligence and other in-
novative digital financial services. Furthermore, the part-
nership shall also extend to joint exploration of new prod-
uct and service offers in digital lending in order to leverage
from high quality customer portfolios, strong liquidity and
other innovative financing solutions.
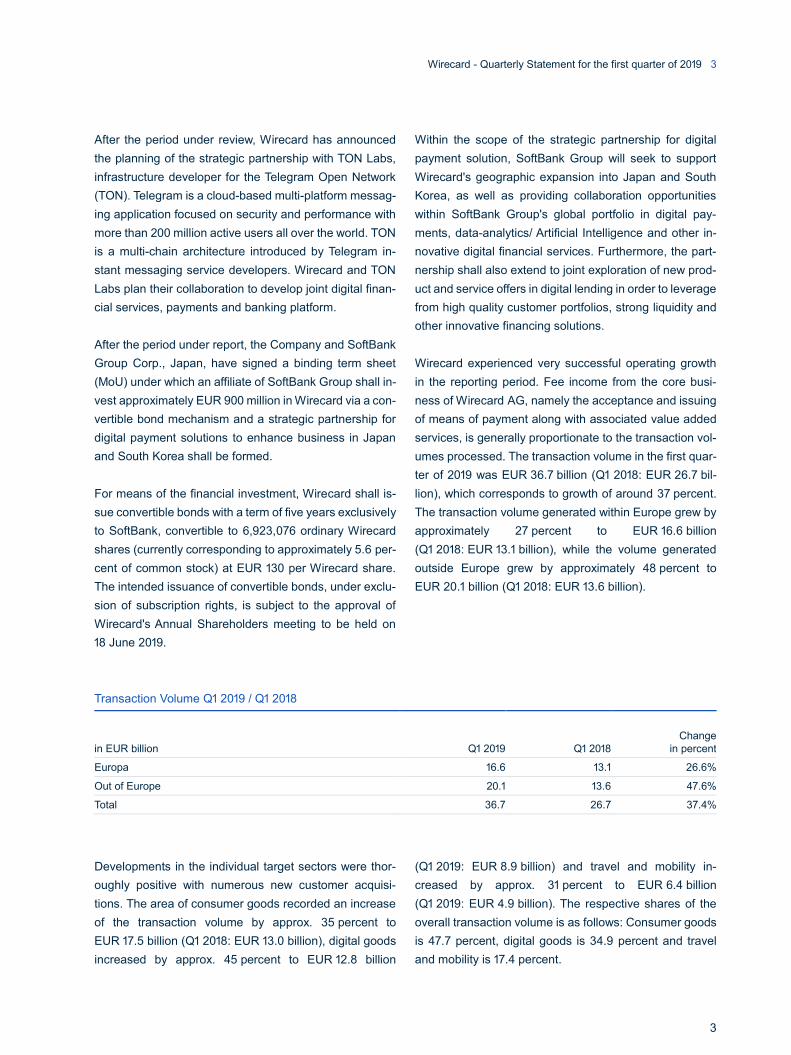
Wirecard experienced very successful operating growth
in the reporting period. Fee income from the core busi-
ness of Wirecard AG, namely the acceptance and issuing
of means of payment along with associated value added
services, is generally proportionate to the transaction vol-
umes processed. The transaction volume in the first quar-
ter of 2019 was EUR 36.7 billion (Q1 2018: EUR 26.7 bil-
lion), which corresponds to growth of around 37 percent.
The transaction volume generated within Europe grew by
approximately 27 percent to EUR 16.6 billion
(Q1 2018: EUR 13.1 billion), while the volume generated
outside Europe grew by approximately 48 percent to
EUR 20.1 billion (Q1 2018: EUR 13.6 billion).
Transaction Volume Q1 2019 / Q1 2018
in EUR billion Q1 2019 Q1 2018
Change
in percent
Europa 16.6 13.1 26.6%
Out of Europe 20.1 13.6 47.6%
Total 36.7 26.7 37.4%
Developments in the individual target sectors were thor-
oughly positive with numerous new customer acquisi-
tions. The area of consumer goods recorded an increase
of the transaction volume by approx. 35 percent to
EUR 17.5 billion (Q1 2018: EUR 13.0 billion), digital goods
increased by approx. 45 percent to EUR 12.8 billion
(Q1 2019: EUR 8.9 billion) and travel and mobility in-
creased by approx. 31 percent to EUR 6.4 billion
(Q1 2019: EUR 4.9 billion). The respective shares of the
overall transaction volume is as follows: Consumer goods
is 47.7 percent, digital goods is 34.9 percent and travel
and mobility is 17.4 percent.

Outlook
The Management Board expects the positive business
performance to continue in the remaining
nine months of 2019 and is not aware of any significant
changes to the forecasts for the macroeconomic and sec-
tor-specific framework conditions described in detail in the
Annual Report. The Management Board raised its fore-
cast to achieve an EBITDA for the 2019 fiscal year of be-
tween EUR 760 million and EUR 810 million (from of be-
tween EUR 740 million and EUR 800 million).

5
Wirecard - Quarterly Statement for the first quarter of 2019 5
Results of financial position and financial performance
Notes to the consolidated statement of profit or
loss
In the first quarter 2019, Wirecard achieved further signif-
icant growth in both revenues and operating profit.
Group gross profit (revenues including other own work
capitalised less cost of materials) increased by
38.3 percent to EUR 275.4 million in the first quarter 2019
(Q1 2018: EUR 199.1 million).
Revenue trends
Consolidated revenues increased in the first quarter 2019
by 34.8 percent from EUR 420.4 million to EUR 566.7 mil-
lion.
Revenues generated in the first quarter 2019 in the core
segment of Payment Processing & Risk Management,
arising from risk management services and the pro-
cessing of online payment transactions, increased by 41.7
percent from EUR 298.6 million to EUR 423.1 million.
The share of total consolidated revenues accounted for
by the Acquiring & Issuing segment grew by 16.2 percent
in the first quarter 2019 due to organic growth within the
Group to EUR 158.3 million (Q1 2018: EUR 136.2 million),
of which the share accounted for by Issuing amounted to
EUR 61.5 million in the first quarter 2019 (Q1 2018: EUR
59.2 million).
The interest income generated by the Acquiring & Issuing
segment in the first quarter 2019 totalled EUR 5.5 million
(Q1 2018: EUR 4.5 million) and is recognised as revenue
in the consolidated statement of profit or loss in accord-
ance with IFRS accounting principles.
Trends in key expense items
The Group’s cost of materials increased in the first quarter
2019 to EUR 301.1 million compared to EUR 230.0 million
in Q1 2018. The cost of materials mainly comprises of
charges from credit card issuing banks (interchange),
fees from credit card companies (for example, Master-
Card and Visa), transaction costs as well as transaction-
related charges from third-party providers (for example, in
the area of risk management and acquiring). Expenses
for payment guarantees are also included in the area of
risk management. The area of acquiring also includes
commission costs for external sales.
Group personnel expenses rose to EUR 76.9 million in
the first quarter 2019, up by 46.5 percent quarter on quar-
ter (Q1 2018: EUR 52.5 million). The consolidated person-
nel expense ratio increased by 1.1 percentage points
quarter on quarter to 13.6 percent.
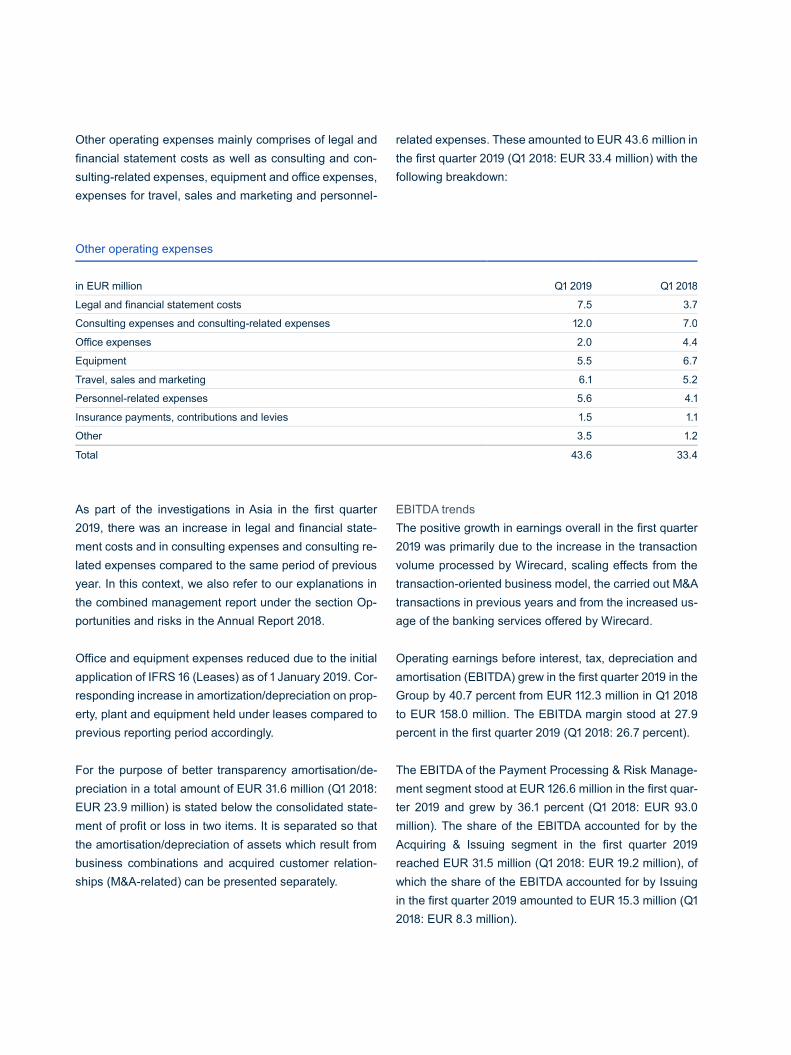
Other operating expenses mainly comprises of legal and
financial statement costs as well as consulting and con-
sulting-related expenses, equipment and office expenses,
expenses for travel, sales and marketing and personnel-
related expenses. These amounted to EUR 43.6 million in
the first quarter 2019 (Q1 2018: EUR 33.4 million) with the
following breakdown:
Other operating expenses
in EUR million Q1 2019 Q1 2018
Legal and financial statement costs 7.5 3.7
Consulting expenses and consulting-related expenses 12.0 7.0
Office expenses 2.0 4.4
Equipment 5.5 6.7
Travel, sales and marketing 6.1 5.2
Personnel-related expenses 5.6 4.1
Insurance payments, contributions and levies 1.5 1.1
Other 3.5 1.2
Total 43.6 33.4
As part of the investigations in Asia in the first quarter
2019, there was an increase in legal and financial state-
ment costs and in consulting expenses and consulting re-
lated expenses compared to the same period of previous
year. In this context, we also refer to our explanations in
the combined management report under the section Op-
portunities and risks in the Annual Report 2018.
Office and equipment expenses reduced due to the initial
application of IFRS 16 (Leases) as of 1 January 2019. Cor-
responding increase in amortization/depreciation on prop-
erty, plant and equipment held under leases compared to
previous reporting period accordingly.
For the purpose of better transparency amortisation/de-
preciation in a total amount of EUR 31.6 million (Q1 2018:
EUR 23.9 million) is stated below the consolidated state-
ment of profit or loss in two items. It is separated so that
the amortisation/depreciation of assets which result from
business combinations and acquired customer relation-
ships (M&A-related) can be presented separately.
EBITDA trends
The positive growth in earnings overall in the first quarter
2019 was primarily due to the increase in the transaction
volume processed by Wirecard, scaling effects from the
transaction-oriented business model, the carried out M&A
transactions in previous years and from the increased us-
age of the banking services offered by Wirecard.
Operating earnings before interest, tax, depreciation and
amortisation (EBITDA) grew in the first quarter 2019 in the
Group by 40.7 percent from EUR 112.3 million in Q1 2018
to EUR 158.0 million. The EBITDA margin stood at 27.9
percent in the first quarter 2019 (Q1 2018: 26.7 percent).
The EBITDA of the Payment Processing & Risk Manage-
ment segment stood at EUR 126.6 million in the first quar-
ter 2019 and grew by 36.1 percent (Q1 2018: EUR 93.0
million). The share of the EBITDA accounted for by the
Acquiring & Issuing segment in the first quarter 2019
reached EUR 31.5 million (Q1 2018: EUR 19.2 million), of
which the share of the EBITDA accounted for by Issuing
in the first quarter 2019 amounted to EUR 15.3 million (Q1
2018: EUR 8.3 million).

Wirecard - Quarterly Statement for the first quarter of 2019 7
Financial result
The financial result stood at EUR –2.0 million in the first
quarter 2019 (Q1 2018: EUR –5.4 million). Group financial
expenses stood at EUR 7.9 million in the first quarter 2019
(Q1 2018: EUR 9.2 million). The Group financial income in
the first quarter 2019 stood at EUR 5.9 million (Q1 2018:
EUR 3.8 million).
Taxes
Due to the international orientation of the Group, the cash
tax rate (excluding deferred taxes) amounted to 13.0 per-
cent in the first quarter 2019 (Q1 2018: 16.7 percent). In-
cluding deferred taxes, the tax rate was 14.6 percent (Q1
2018: 14.7 percent).
Earnings after tax
Earnings after tax in the first quarter 2019 increased by
50.0 percent compared to Q1 2018, from EUR 70.8 million
to EUR 106.3 million.
Earnings per share
The average number of issued shares on an undiluted ba-
sis amounted to 123,565,586 shares in the first quarter
2019 (Q1 2018: 123,565,586 shares). Basic (undiluted)
earnings per share stood at EUR 0.86 in the first quarter
2019 (Q1 2018: EUR 0.57).

Notes to the consolidated statement of
financial position – assets
Intangible assets
Intangible assets comprises of goodwill, customer rela-
tionships, internally-generated intangible assets and
other intangible assets.
Goodwill and customer relationships
In the first quarter 2019, goodwill changed as a result of
currency-related valuations by EUR 13.8 million as at the
reporting date. As of 31 March 2019, goodwill totalled
EUR 719.7 million (31 December 2018: EUR 705.9 mil-
lion) and is assigned to the following groups of cash-gen-
erating units:
Goodwill
in EUR million 31 Mar 2019 31 Dec 2018
Payment Processing & Risk Management 564.3 552.6
Acquiring & Issuing 155.1 153.0
Call Center & Communication Services 0.3 0.3
Total 719.7 705.9
Less: impairment losses 0.0 0.0
719.7 705.9
The change in the item customer relationships of
EUR 2.8 million in the reporting period is mainly related to
amortisation/depreciation and currency-related valuations
as of the reporting date.
Amortisation commences together with the flow of bene-
fits and is performed over the useful life of each respective
customer relationship.
Internally-generated intangible assets
In the first quarter 2019, internally-generated software was
developed and capitalised in the amount of EUR 9.8 mil-
lion (Q1 2018: EUR 8.7 million).
Property, plant and equipment
The increase in this item is mainly attributable to the initial
application of IFRS 16 (Leases) as of 1 January 2019.
The carrying amount of properties, technical equipment,
operating and office equipment as well as motor vehicles
held as part of leases as of 31 March 2019 totalled
EUR 66.6 million (31 December 2018: EUR 36.5 million
as part of finance leases according to IAS 17) and is re-
ported accordingly under property, plant and equipment.
The leased items partly serve as collateral for the respec-
tive obligations from the lease agreements.

Wirecard - Quarterly Statement for the first quarter of 2019 9
Financial and other assets / interest-bearing securities
Financial and other assets and interest bearing securities
as of 31 March 2019 totalled EUR 401.9 million (31 De-
cember 2018: EUR 413.6 million). The breakdown of the
reporting data is as follows:
Financial and other assets / interest-bearing securities
in EUR million 31 Mar 2019 31 Dec 2018
Visa preferred stock 28.4 23.6
Financing agreements (amongst others sales partner) 133.0 132.9
Convertible bonds 13.2 13.2
Securities 2.4 2.3
Securities/collared floaters from bank business 18.9 24.7
Receivables from bank business (mostly from FinTech business) 116.2 123.4
Other M&A related assets 83.7 89.5
Other 6.1 3.9
401.9 413.6
As part of the purchase price allocations related to the ac-
quisition of Citi's card acceptance business in the Asia-
Pacific region in accordance with IFRS 3, various other
assets were identified that were recognised accordingly in
a separate item. This was due to accounting-specific rules
for the accounting of various contractual rights and assets
in accordance with IFRS 3.
Receivables of the acquiring business
The items receivables of the acquiring business as well
as liabilities of the acquiring business of Wirecard are
mainly characterised by the transaction volume of mer-
chants that utilise Wirecard's payment services. Due in
particular to the legal guidelines for the licensing agree-
ments depending on the region and sector in which the
merchant and acquiring partner operate, as well as to the
business relationship between the merchant and
Wirecard, different business models are utilised can result
in varying accounting methods being applied. The trans-
action volumes within and via Wirecard are correspond-
ingly reported separately under the item receivables of the
acquiring business in the consolidated statement of finan-
cial position as trade receivables from credit card organi-
sations, banks and acquiring partners.
Depending on the reporting date and the payment cycle,
the statement of financial position items receivables of the
acquiring business as well as liabilities of the acquiring
business are subject to considerable fluctuations from
one reporting date to another. These fluctuations occur in
particular due to delayed payouts on account of the public
holidays between reporting periods. During the actual pro-
cessing of the transactions, it is also sometimes possible
that the payment of credit card volumes from Wirecard to
the merchant already takes place before the funds are re-
ceived from the credit card companies. Particularly, this
product has developed very positively in Brazil and in the
Asia-Pacific portfolios. This results in, amongst other
things, higher receivables in comparison to the corre-
sponding liabilities.

Trade and other receivables
The statement of financial position item “trade and other
receivables” splits as follows:
Trade and other receivables
in EUR million 31 Mar 2019 31 Dec 2018
Receivables from bank business (mostly from FinTech business) 95.8 98.0
Receivables from prepaid card business 37.8 40.3
Other M&A related receivables 37.0 31.4
Other trade receivables 112.4 115.6
Other receivables 74.1 72.2
357.1 357.4
Other receivables comprises of rent, insurances and other
services that due to their contractual terms are accrued
over the reporting date. In addition, this sub-item com-
prises deposits, receivables from employees and other
assets.
Interest-bearing securities and fixed-term deposits
Apart from investing in various interest-bearing securities,
Wirecard has also invested as in previous years in fixed-
term deposits in order to improve its interest income. All
investments are only concluded with banks or counterpar-
ties that meet the creditworthiness requirements from the
Group’s own risk evaluation and – to the extent that ex-
ternal ratings are available – are assessed as having a
credit risk by renowned ratings agencies. Fixed-term de-
posits with a term of more than three months are reported
under Interest-bearing securities and fixed-term deposits.
In contrast, fixed-term deposits with a term of up to three
months are reported under Cash and cash equivalents.
Cash and cash equivalents
As of 31 March 2019, the item Cash and cash equivalents
totalling EUR 2,829.6 million (31 December 2018:
EUR 2,719.8 million) included cash in hand and bank bal-
ances (demand deposits, fixed-term deposits with a term
of up to three months and overnight deposits). This item
also includes cash from current customer deposits of
Wirecard Bank AG and Wirecard Card Solutions Ltd.
which are not invested in interest-bearing securities
(31 March 2019: EUR 1,582.9 million; 31 December 2018:
EUR 1,263.0 million) and funds from the acquiring busi-
ness of Wirecard Bank AG (31 March 2019:
EUR 346.9 million; 31 December 2018: EUR 453.4 mil-
lion). To improve its interest income, Wirecard invests
some of the customer deposits in various short, medium
and long-term interest bearing securities (collared floaters
and interest-bearing securities). These are reported under
non-current financial and other assets and current inter-
est-bearing securities. Excluding the purchase of these
securities and the fixed-term deposits with a term of more
than three months, the item Cash and cash equivalents
would have been EUR 527.6 million higher as of the re-
porting date (31 December 2018: EUR 166.6 million).

Wirecard - Quarterly Statement for the first quarter of 2019 11
Notes to the consolidated statement of
financial position – equity and liabilities
Subscribed capital
As of 31 March 2019, the subscribed capital was
EUR 123.6 million (31 December 2018: EUR 123.6 mil-
lion) and comprised 123,565,586 (31 December 2018:
123,565,586) no-par value shares with a notional interest
in the common stock of EUR 1.00 per share.
Retained earnings
A dividend of EUR 0.18 per dividend-entitled ordinary
share was approved for distribution to shareholders at the
Annual General Meeting 2018 on 21 June 2018, which cor-
responds to a total amount of EUR 22.2 million.
A proposal will be made at the 2019 Annual General Meet-
ing to pay a dividend of EUR 0.20 per share to the share-
holders, which corresponds to a total amount of
EUR 24.7 million.
Other components of equity
Translation reserve
The foreign currency translation reserve changed in the
first quarter 2019 due to foreign currency translations with
no effect on profit or loss according to IAS 21 from EUR –
71.2 million as of the reporting date of the previous year to
EUR –52.4 million as of 31 March 2019. This development
was primarily attributable to goodwill and customer rela-
tionships accounted for in foreign currencies due to the
acquisitions concluded in previous years.
Non-current liabilities
Non-current liabilities are split into non-current interest-
bearing liabilities, other non-current liabilities and de-
ferred tax liabilities.
Non-current interest-bearing liabilities
Non-current interest-bearing liabilities are related to the
financing of the acquisitions completed in previous years
in general. They increased in the first quarter 2019 by
EUR 150.0 million from EUR 1,348.7 million as of 31 De-
cember 2018 to EUR 1,498.7 million as of 31 March 2019.
The increase in the first quarter 2019 is related to the prod-
uct offering for Merchant Cash Advance or real-time pay-
outs of transactions made, which is available in particular
to small and medium-sized merchants.

Other non-current liabilities
This statement of financial position item splits as follows:
Other non-current liabilities
in EUR million 31 Mar 2019 31 Dec 2018
Earnout liabilities 5.9 5.6
Lease liabilities 47.6 27.2
Variable remuneration and pension benefits 2.9 2.0
Other M&A related liabilities 112.2 120.0
Other non-current liabilities 6.1 9.1
174.6 163.8
The portion of earnout components and current purchase
price liabilities that is due within the period of one year is
EUR 26.5 million as of 31 March 2019 (31 December 2018:
EUR 25.9 million) and is disclosed under current liabilities.
The increase in leasing liabilities is due in particular to the
initial application of IFRS 16 (Leases) as of 1 January
2019.
As part of the purchase price allocation related to the ac-
quisition of Citi's card acceptance business in the Asia-
Pacific region, further other non-current liabilities were
identified that were recognised accordingly in a separate
item. This is due to accounting-specific rules for the ac-
counting of various contractual obligations and liabilities
in accordance with IFRS 3.
Deferred tax liabilities
Deferred taxes of EUR 80.5 million (31 December 2018:
EUR 80.1 million) refer to temporary differences between
the carrying amounts of assets and liabilities in the tax
statement of financial position and their carrying amounts
in the consolidated statement of financial position accord-
ing to IFRS. These are reported under non-current liabili-
ties and are due, in particular, to the disclosure of intangi-
ble assets as part of the acquisitions concluded in previ-
ous years.
Current liabilities
Current liabilities consist of liabilities of the acquiring busi-
ness, trade payables, interest-bearing liabilities, other
provisions, other liabilities, customer deposits from bank-
ing operations of Wirecard Bank AG and Wirecard Card
Solutions Ltd. and tax provisions.
Liabilities of the acquiring business
The items “liabilities of the acquiring business” and “re-
ceivables of the acquiring business” of Wirecard are
mainly characterised by the transaction volume of mer-
chants that use Wirecard's payment services. If the trans-
actions are processed via licensed acquirers that belong
to Wirecard, the amount of the transaction volume re-
mains under trade payables to merchants until the pay-
ment is made. Depending on the means of payment and
the contractual provisions, this can take place daily,
weekly or monthly, whereby a security reserve is gener-
ally held for longer periods of time. In individual cases,
particularly when dealing with large customers who want
to optimise their own cash management, Wirecard agrees
to replace these security reserves with bank guarantees,
government-backed guarantees or similar colleteral, as
well as to even completely forego a security reserve if
dealing with state-owned merchants. This reduces the
item trade payables respectively slows the increase in this
item.

Wirecard - Quarterly Statement for the first quarter of 2019 13
Depending on the reporting date and the payment cycle,
the statement of financial position items liabilities of the
acquiring business as well as receivables of the acquiring
business are subject to considerable fluctuations from
one reporting date to another. These fluctuations occur, in
particular, due to delayed payouts on account of the public
holidays between respective reporting periods. During the
actual processing of the transactions, it is also sometimes
possible that the payment credit card volumes from
Wirecard to the merchant already takes place before the
funds are received from the credit card companies. This
can result in, amongst other things, higher receivables in
comparison to the corresponding liabilities.
Trade payables
Trade payables comprises of payables from the operating
business that are not allocated to the area of acquiring
due to their nature.
Interest-bearing liabilities
Current interest-bearing liabilities of EUR 112.3 million
(31 December 2018: EUR 117.4 million) mainly comprises
of loans that are due within one year.
Other liabilities
This statement of financial position item details as follows:
Other liabilities
in EUR million 31 Mar 2019 31 Dec 2018
Accruals 75.5 65.2
Other M&A related liabilities 51.6 45.4
Lease liabilities 25.5 16.5
Purchase price liabilities 26.5 25.9
Other 37.1 33.6
216.2 186.6
The increase in leasing liabilities is due in particular to the
initial application of IFRS 16 (Leases) as of 1 January
2019.
Customer deposits from banking operations
As of 31 March 2019, this statement of financial position
item includes customer deposits of EUR 1,582.9 million
(31 December 2018: EUR 1,263.0 million) with Wirecard
Bank AG and Wirecard Card Solutions Ltd.

Notes to the consolidated statement of cash
flows
Cash flow from operating activities
The cash flow from operating activities before the
changes from banking operations in the first quarter 2019
changed from EUR 82.9 million in Q1 2018 to
EUR 30.1 million, mainly due to the special system used
in acquiring, which is impacted by cut-off date effects of a
transitory nature inherent in the business model. It should
be especially noted in this context that because of a very
sharp increase in the cash flow from operating activities
in the fourth quarter of 2018, which was mainly due to de-
layed payouts on account of the public holidays, an oppo-
site cash flow trend is expected in the first half-year of
2019.
In the first quarter 2019, cash flow from the banking oper-
ations of EUR –31.5 million was generated (Q1 2018:
EUR –54.0 million). The main reason for this develop-
ment was the increase in customer deposits from
Wirecard's growing issuing business, which were increas-
ingly invested in short-term assets from the banking sec-
tor. The cash flow from operating activities in the first quar-
ter 2019 thus stood at EUR –1.3 million (Q1 2018: EUR
28.9 million).
Cash flow from investing activities
The cash flow from investing activities is the result of the
cash inflows from non-current assets (excluding deferred
taxes) and the cash outflows for investments in non-cur-
rent assets (excluding deferred taxes). The cash flow from
investing activities totalled EUR –18.8 million in the report-
ing period (Q1 2018: EUR –33.4 million).
The cash outflows for investments mainly comprise of the
following:
Substantial cash outflows for investments
in EUR million Q1 2019 Q1 2018
Strategic transactions/M&A 0.0 19.7
Internally-generated intangible assets 9.8 8.7
Other intangible assets (software) 4.3 3.1
Property, plant and equipment 4.6 4.0
Cash flow from financing activities
Cash flow from financing activities in the first quarter 2019
mainly concerns cash inflows from drawing on financial
liabilities of EUR 150.0 million (Q1 2018: EUR 70.0 mil-
lion), which are related to the product offering for Mer-
chant Cash Advance or real-time payouts of transactions
made, which is available in particular to small and me-
dium-sized merchants. Opposite, there was a cash out-
flow for the repayment of financial liabilities of EUR –
0.4 million (Q1 2018: EUR –0.6 million). In addition, repay-
ments were carried out in context of lease liabilities, which
resulted in a net cash flow of EUR –7.2 million (Q1 2018:
EUR –3.5 million).
Wirecard - Quarterly Statement for the first quarter of 2019 15
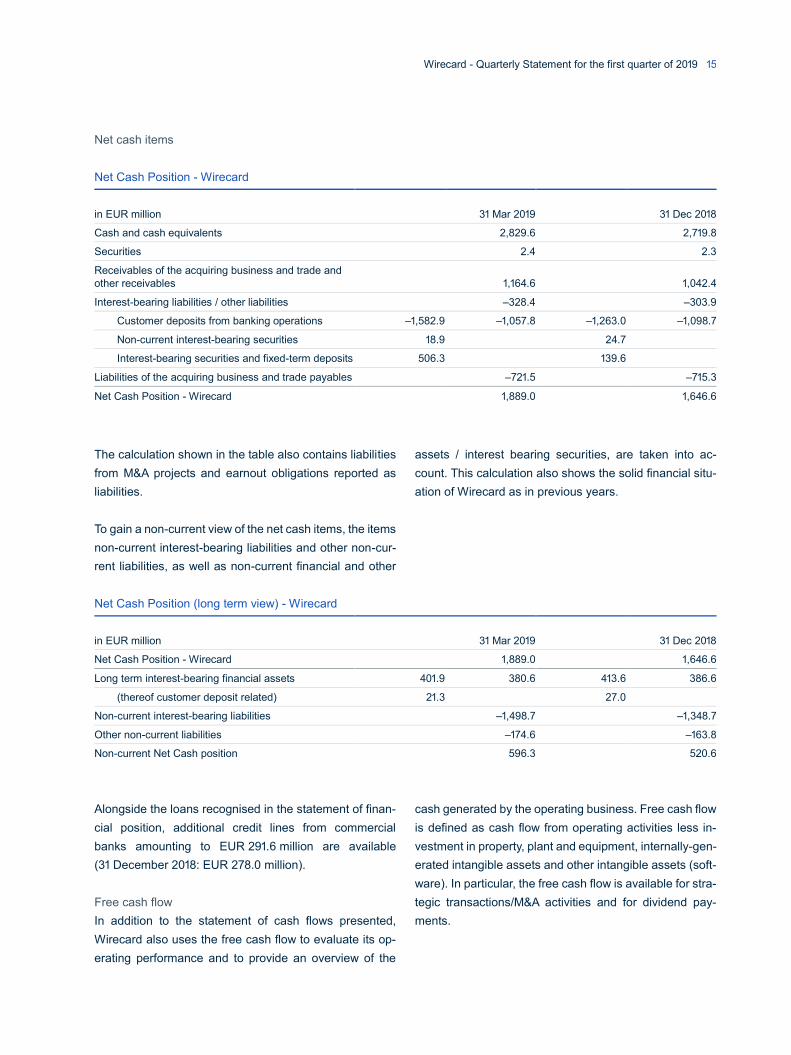
Net cash items
Net Cash Position - Wirecard
in EUR million 31 Mar 2019 31 Dec 2018
Cash and cash equivalents 2,829.6 2,719.8
Securities 2.4 2.3
Receivables of the acquiring business and trade and
other receivables 1,164.6 1,042.4
Interest-bearing liabilities / other liabilities –328.4 –303.9
Customer deposits from banking operations –1,582.9 –1,057.8 –1,263.0 –1,098.7
Non-current interest-bearing securities 18.9 24.7
Interest-bearing securities and fixed-term deposits 506.3 139.6
Liabilities of the acquiring business and trade payables –721.5 –715.3
Net Cash Position - Wirecard 1,889.0 1,646.6
The calculation shown in the table also contains liabilities
from M&A projects and earnout obligations reported as
liabilities.
To gain a non-current view of the net cash items, the items
non-current interest-bearing liabilities and other non-cur-
rent liabilities, as well as non-current financial and other
assets / interest bearing securities, are taken into ac-
count. This calculation also shows the solid financial situ-
ation of Wirecard as in previous years.
Net Cash Position (long term view) - Wirecard
in EUR million 31 Mar 2019 31 Dec 2018
Net Cash Position - Wirecard 1,889.0 1,646.6
Long term interest-bearing financial assets 401.9 380.6 413.6 386.6
(thereof customer deposit related) 21.3 27.0
Non-current interest-bearing liabilities –1,498.7 –1,348.7
Other non-current liabilities –174.6 –163.8
Non-current Net Cash position 596.3 520.6
Alongside the loans recognised in the statement of finan-
cial position, additional credit lines from commercial
banks amounting to EUR 291.6 million are available
(31 December 2018: EUR 278.0 million).
Free cash flow
In addition to the statement of cash flows presented,
Wirecard also uses the free cash flow to evaluate its op-
erating performance and to provide an overview of the
cash generated by the operating business. Free cash flow
is defined as cash flow from operating activities less in-
vestment in property, plant and equipment, internally-gen-
erated intangible assets and other intangible assets (soft-
ware). In particular, the free cash flow is available for stra-
tegic transactions/M&A activities and for dividend pay-
ments.

Free cash flow
in EUR million 31 Mar 2019 31 Mar 2018
Cash flow from operating activities (adjusted) 143.4 87.4
Operative CAPEX 18.8 15.7
Free cash flow 124.6 71.8
After investments in new and innovative products that will
only lead to appreciable cash flows in subsequent years,
the cash conversion rate thus stands at 117.3 percent (Q1
2018: 101.3 percent).
Cash conversion
in EUR million 31 Mar 2019 31 Mar 2018
Free cash flow 124.6 71.8
Earnings after tax 106.3 70.8
Cash conversion in percent 117.3 101.3
Wirecard - Quarterly Statement for the first quarter of 2019 17
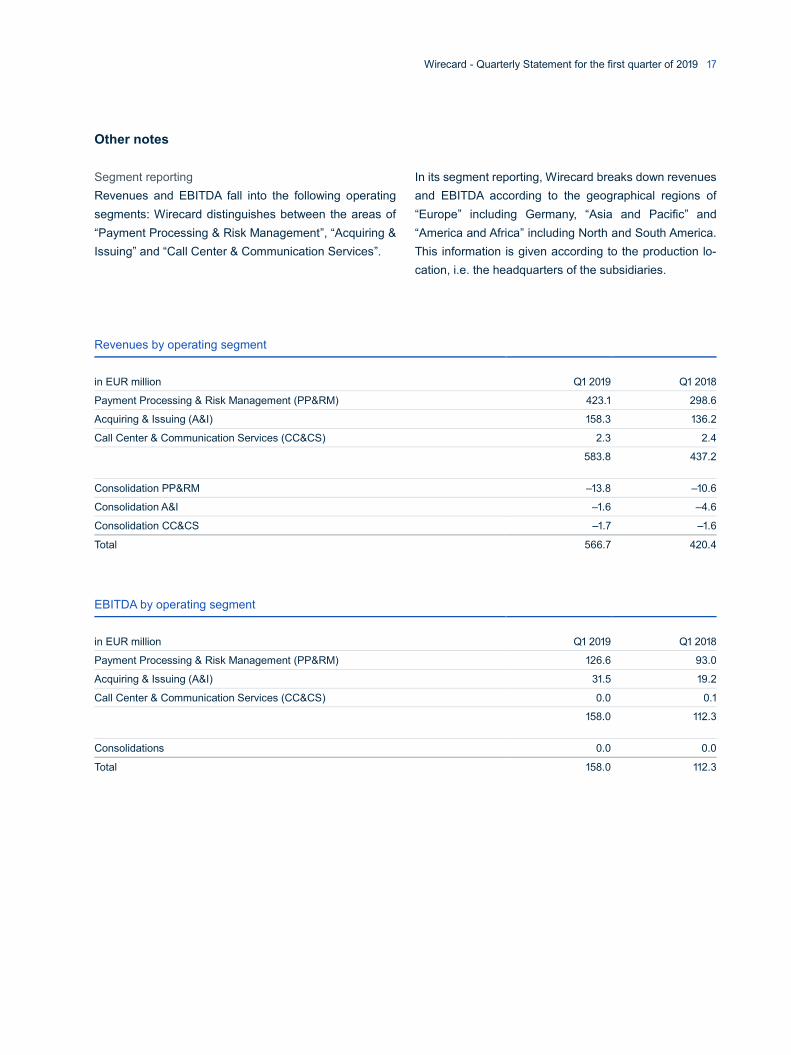
Other notes
Segment reporting
Revenues and EBITDA fall into the following operating
segments: Wirecard distinguishes between the areas of
“Payment Processing & Risk Management”, “Acquiring &
Issuing” and “Call Center & Communication Services”.
In its segment reporting, Wirecard breaks down revenues
and EBITDA according to the geographical regions of
“Europe” including Germany, “Asia and Pacific” and
“America and Africa” including North and South America.
This information is given according to the production lo-
cation, i.e. the headquarters of the subsidiaries.
Revenues by operating segment
in EUR million Q1 2019 Q1 2018
Payment Processing & Risk Management (PP&RM) 423.1 298.6
Acquiring & Issuing (A&I) 158.3 136.2
Call Center & Communication Services (CC&CS) 2.3 2.4
583.8 437.2
Consolidation PP&RM –13.8 –10.6
Consolidation A&I –1.6 –4.6
Consolidation CC&CS –1.7 –1.6
Total 566.7 420.4
EBITDA by operating segment
in EUR million Q1 2019 Q1 2018
Payment Processing & Risk Management (PP&RM) 126.6 93.0
Acquiring & Issuing (A&I) 31.5 19.2
Call Center & Communication Services (CC&CS) 0.0 0.1
158.0 112.3
Consolidations 0.0 0.0
Total 158.0 112.3

Revenue by region
in EUR million Q1 2019 Q1 2018
Europe (incl. Germany) 264.0 207.9
Asia and Pacific 291.4 193.8
America and Africa 45.6 41.8
600.9 443.5
Consolidation Europe –31.9 –20.6
Consolidation Asia and Pacific –1.5 –2.4
Consolidation America and Africa –0.8 0.0
Total 566.7 420.4
EBITDA by region
in EUR million Q1 2019 Q1 2018
Europe (incl. Germany) 67.5 53.1
Asia and Pacific 78.7 50.2
America and Africa 11.8 9.0
158.0 112.3
Consolidations 0.0 0.0
Total 158.0 112.3

Wirecard - Quarterly Statement for the first quarter of 2019 19

Consolidated statement of financial position
Assets
in EUR million 31 Mar 2019 31 Dec 2018
I. Non-current assets
1. Intangible assets
Goodwill 719.7 705.9
Customer relationships 449.2 452.1
Internally-generated intangible assets 143.5 138.2
Other intangible assets 110.2 113.3
1,422.6 1,409.5
2. Property, plant and equipment 113.2 81.5
3. Investments accounted for using the equity method 14.0 14.0
4. Financial and other assets / interest-bearing securities 401.9 413.6
5. Tax credits
Deferred tax assets 12.1 10.8
Total non-current assets 1,963.8 1,929.4
II. Current assets
1. Inventories and work in progress 8.1 10.6
2. Receivables of the acquiring business 807.6 684.9
3. Trade and other receivables 357.1 357.4
4. Tax credits
Tax refund entitlements 17.3 13.1
5. Interest-bearing securities and fixed-term deposits 506.3 139.6
6. Cash and cash equivalents 2,829.6 2,719.8
Total current assets 4,525.9 3,925.5
Total assets 6,489.7 5,854.9

Wirecard - Quarterly Statement for the first quarter of 2019 21
Equity and liabilities
in EUR million 31 Mar 2019 31 Dec 2018
I. Equity
1. Subscribed capital 123.6 123.6
2. Capital reserve 494.7 494.7
3. Retained earnings 1,482.0 1,375.7
4. Other components of equity –52.4 –71.2
Total equity 2,047.8 1,922.7
II. Liabilities
1. Non-current liabilities
Non-current interest-bearing liabilities 1,498.7 1,348.7
Other non-current liabilities 174.6 163.8
Deferred tax liabilities 80.5 80.1
Total non-current liabilities 1,753.8 1,592.6
2. Current liabilities
Liabilities of the acquiring business 652.8 651.9
Trade payables 68.7 63.4
Interest-bearing liabilities 112.3 117.4
Other provisions 19.2 18.5
Other liabilities 216.2 186.6
Customer deposits from banking operations 1,582.9 1,263.0
Tax provisions 36.1 38.9
Total current liabilities 2,688.1 2,339.6
Total liabilities 4,441.9 3,932.2
Total equity and liabilities 6,489.7 5,854.9

Consolidated statement of profit or loss
in EUR million 1 Jan 2019 – 31 Mar 2019 1 Jan 2018 – 31 Mar 2018
Revenues 566.7 420.4
Own work capitalised 9.8 8.7
Cost of materials 301.1 230.0
Gross profit 275.4 199.1
Personnel expenses 76.9 52.5
Other operating expenses 43.6 33.4
impairment losses of financial assets 1.5 3.5
Other operating income 4.6 3.1
Share of profit or loss from associates (at equity) –0.1 –0.5
EBITDA 158.0 112.3
Amortisation/depreciation 31.6 23.9
EBIT * 126.5 88.4
Financial result –2.0 –5.4
Other financial income 5.9 3.8
Financial expenses 7.9 9.2
Earnings before tax * 124.5 83.1
Income tax expense 18.2 12.2
Earnings after tax * 106.3 70.8
Earnings per share (basic and diluted) in EUR 0.86 0.57
Average shares outstanding (basic and diluted) 123,565,586 123,565,586
EBITDA 158.0 112.3
Amortisation and depreciation (M&A adjusted)** 23.2 14.5
EBIT adjusted * 134.8 97.8
Amortisation and depreciation (M&A related)* 8.4 9.3
EBIT * 126.5 88.4
* Attributable entirely to the shareholders of the parent company
** Adjusted by amortisation of assets which result from business combinations and acquired customer relationships (M&A related)
Wirecard - Quarterly Statement for the first quarter of 2019 23
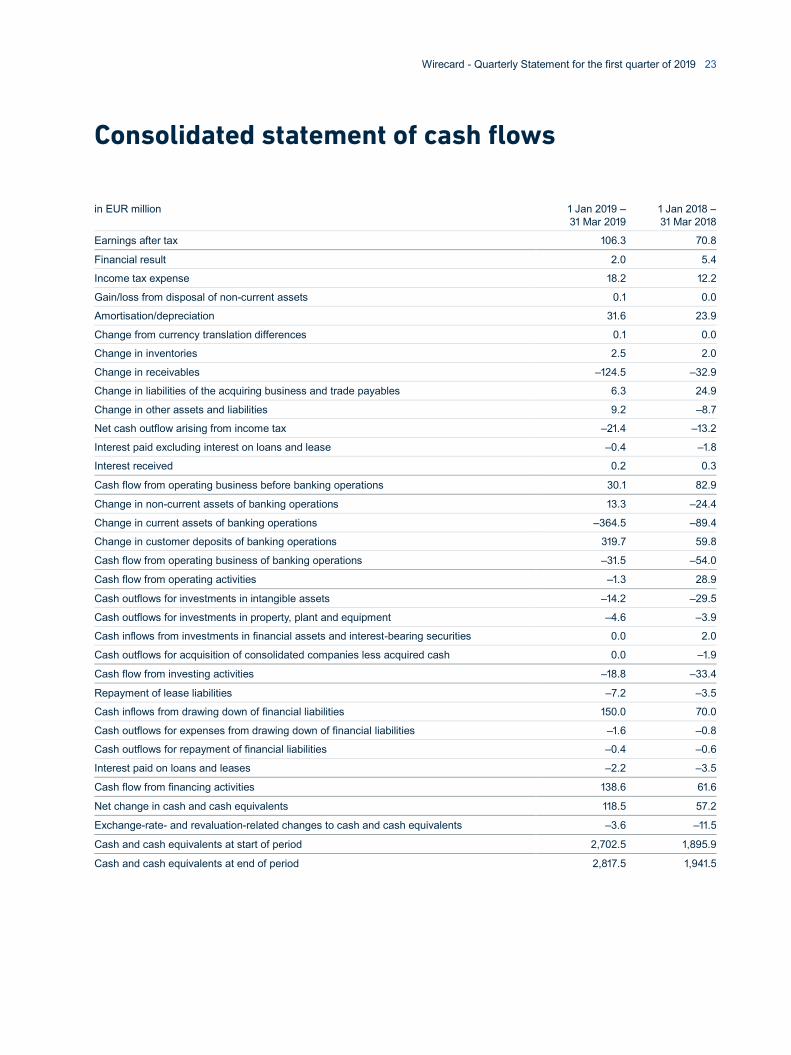
Consolidated statement of cash flows
in EUR million 1 Jan 2019 –
31 Mar 2019
1 Jan 2018 –
31 Mar 2018
Earnings after tax 106.3 70.8
Financial result 2.0 5.4
Income tax expense 18.2 12.2
Gain/loss from disposal of non-current assets 0.1 0.0
Amortisation/depreciation 31.6 23.9
Change from currency translation differences 0.1 0.0
Change in inventories 2.5 2.0
Change in receivables –124.5 –32.9
Change in liabilities of the acquiring business and trade payables 6.3 24.9
Change in other assets and liabilities 9.2 –8.7
Net cash outflow arising from income tax –21.4 –13.2
Interest paid excluding interest on loans and lease –0.4 –1.8
Interest received 0.2 0.3
Cash flow from operating business before banking operations 30.1 82.9
Change in non-current assets of banking operations 13.3 –24.4
Change in current assets of banking operations –364.5 –89.4
Change in customer deposits of banking operations 319.7 59.8
Cash flow from operating business of banking operations –31.5 –54.0
Cash flow from operating activities –1.3 28.9
Cash outflows for investments in intangible assets –14.2 –29.5
Cash outflows for investments in property, plant and equipment –4.6 –3.9
Cash inflows from investments in financial assets and interest-bearing securities 0.0 2.0
Cash outflows for acquisition of consolidated companies less acquired cash 0.0 –1.9
Cash flow from investing activities –18.8 –33.4
Repayment of lease liabilities –7.2 –3.5
Cash inflows from drawing down of financial liabilities 150.0 70.0
Cash outflows for expenses from drawing down of financial liabilities –1.6 –0.8
Cash outflows for repayment of financial liabilities –0.4 –0.6
Interest paid on loans and leases –2.2 –3.5
Cash flow from financing activities 138.6 61.6
Net change in cash and cash equivalents 118.5 57.2
Exchange-rate- and revaluation-related changes to cash and cash equivalents –3.6 –11.5
Cash and cash equivalents at start of period 2,702.5 1,895.9
Cash and cash equivalents at end of period 2,817.5 1,941.5

Consolidated cash flow from operating activities (adjusted)
in EUR million 1 Jan 2019 –
31 Mar 2019
1 Jan 2018 –
31 Mar 2018
Earnings after tax 106.3 70.8
Financial result 2.0 5.4
Income tax expense 18.2 12.2
Gain/loss from disposal of non-current assets 0.1 0.0
Amortisation/depreciation 31.6 23.9
Change from currency translation differences 0.1 0.0
Change in inventories 2.5 2.0
Change in receivables –4.5 2.3
Change in trade payables –0.5 –5.7
Change in other assets and liabilities 9.2 –8.7
Net cash outflow arising from income tax –21.4 –13.2
Interest paid excluding interest on loans and lease –0.4 –1.8
Interest received 0.2 0.3
Cash flow from operating activities (adjusted) 143.4 87.4
Receivables and liabilities of acquiring business are tran-
sitory in nature and subject to substantial fluctuations from
one reporting date to another as, inherent to the business
model, these statements of financial position items are
significantly influenced by the overall transaction volume
and the security reserves. Receivables of acquiring busi-
ness mainly comprise receivables from credit card orga-
nisations, banks and acquiring partners and liabilities to
merchants. The customer deposits from the banking
business and corresponding securities or receivables
from the banking business likewise constitute items that
can be eliminated for the cash flow (adjusted). To simplify
the identification and reporting of the cash-relevant por-
tion of the Company’s own earnings, Wirecard has de-
cided to present a further statement in addition to the
usual statement of cash flow from operating activities with
those items eliminated.