Investor Relations ir.unibanco
22
Conference Call 2Q05 | 1 Investor Relations www.ir.unibanco.com Consolidated Results 2 nd Quarter 2005 Conference Call August 12, 2005
-
Upload
karina-duran -
Category
Documents
-
view
38 -
download
2
description
Consolidated Results 2 nd Quarter 2005 Conference Call August 12, 2005. Investor Relations www.ir.unibanco.com. Unibanco in 2Q05. D 2Q05 / 2Q04. +48.5%. Net Income R$453 million Operating Income R$684 million. +70.6%. 23.0%. 21.0%. 20.1%. 8.7. 17.8%. 17.3%. 8.4. 8.1. - PowerPoint PPT Presentation
Transcript of Investor Relations ir.unibanco
Conference Call 2Q05 | 1
Investor Relations
www.ir.unibanco.com
Consolidated Results 2nd Quarter 2005
Conference Call August 12, 2005
Conference Call 2Q05 | 2
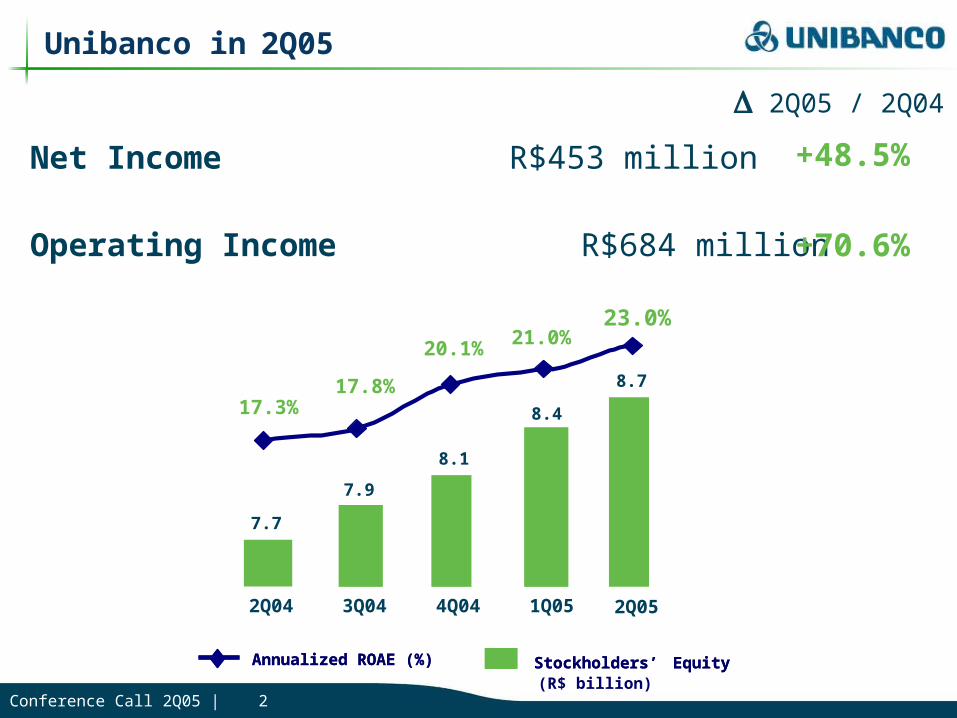
Unibanco in 2Q05
Net Income R$453 million
Operating Income R$684 million
+48.5%
+70.6%
2Q05 / 2Q04
7.7
7.9
8.1
8.4
21.0%
17.3%17.8%
20.1%
2Q04 3Q04 4Q04 1Q05
8.7
23.0%
2Q05
Annualized ROAE (%) Stockholders’ EquityAnnualized ROAE (%) Stockholders’ Equity(R$ billion)
Conference Call 2Q05 | 3
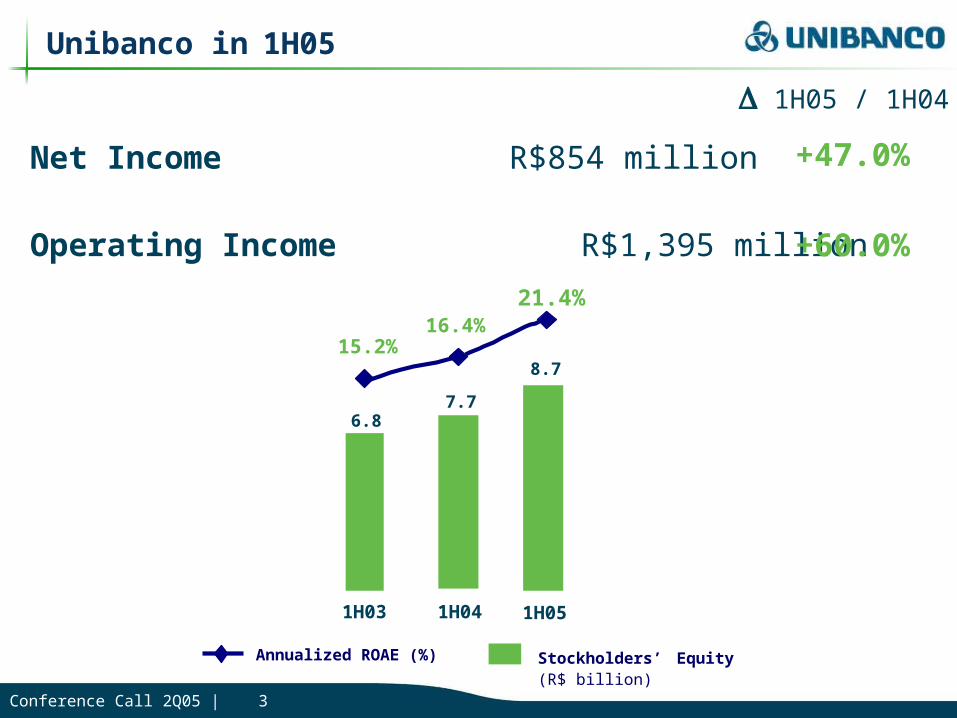
Unibanco in 1H05
Net Income R$854 million
Operating Income R$1,395 million
+47.0%
+60.0%
1H05 / 1H04
6.87.7
16.4%15.2%
1H03 1H04
8.7
21.4%
1H05
Annualized ROAE (%) Stockholders’ Equity(R$ billion)
Conference Call 2Q05 | 4
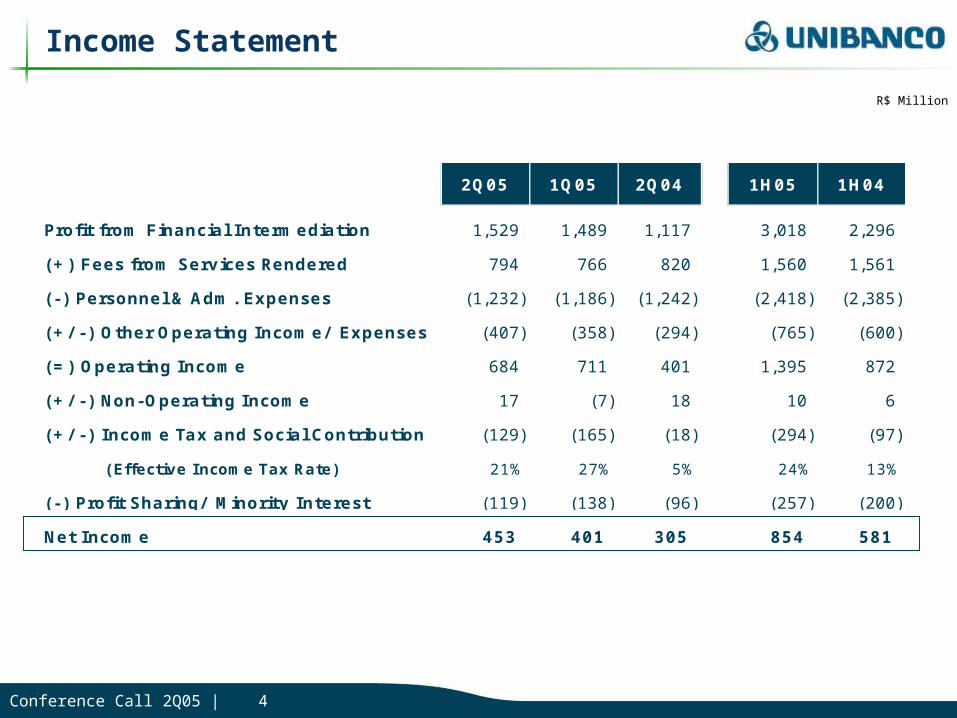
2Q05 1Q05 2Q04 1H05 1H04
Profit from Financial Intermediation 1,529 1,489 1,117 3,018 2,296
(+) Fees from Services Rendered 794 766 820 1,560 1,561
(-) Personnel & Adm. Expenses (1,232) (1,186) (1,242) (2,418) (2,385)
(+/ -) Other Operating Income/ Expenses (407) (358) (294) (765) (600)
(=) Operating Income 684 711 401 1,395 872
(+/ -) Non-Operating Income 17 (7) 18 10 6
(+/ -) Income Tax and Social Contribution (129) (165) (18) (294) (97)
(Effective Income Tax Rate) 21% 27% 5% 24% 13%
(-) Profit Sharing/ Minority Interest (119) (138) (96) (257) (200)
Net Income 453 401 305 854 581
Income Statement
R$ Million
Conference Call 2Q05 | 5
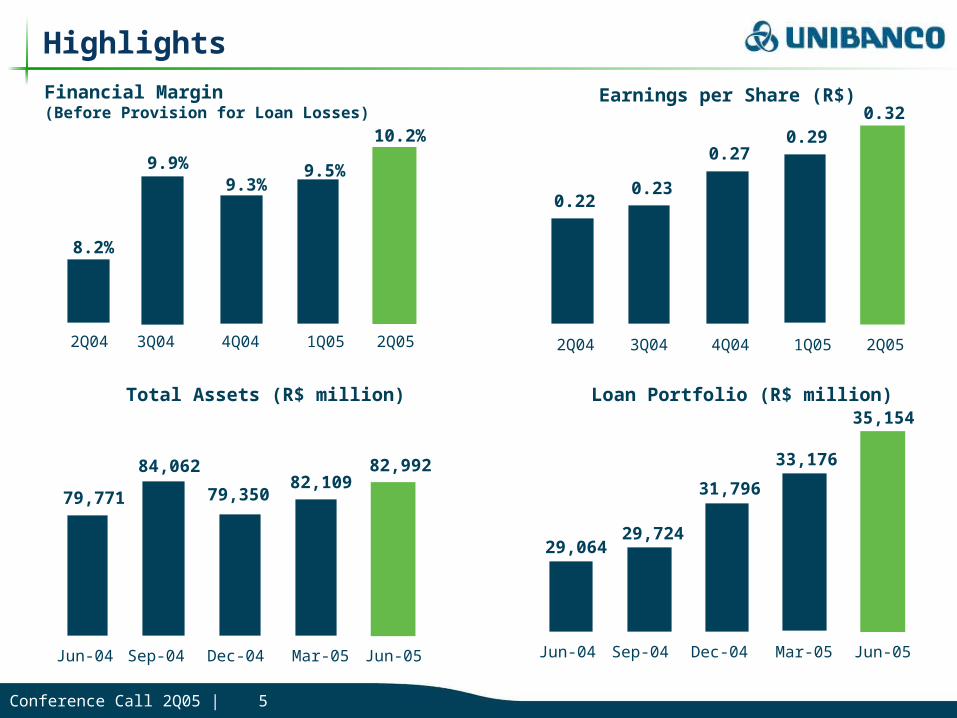
Highlights
Total Assets (R$ million) Loan Portfolio (R$ million)
Financial Margin(Before Provision for Loan Losses)
2Q04 3Q04 4Q04 1Q05 2Q05
Earnings per Share (R$)
2Q04 3Q04 4Q04 1Q05 2Q05
8.2%
9.3%9.9% 9.5%
10.2%
0.220.23
0.270.29
Jun-04 Sep-04 Dec-04 Mar-05 Jun-05
79,771
84,062
79,35082,109
82,992
Jun-04 Sep-04 Dec-04 Mar-05 Jun-05
29,06429,724
31,796
33,176
35,154
0.32
Conference Call 2Q05 | 6
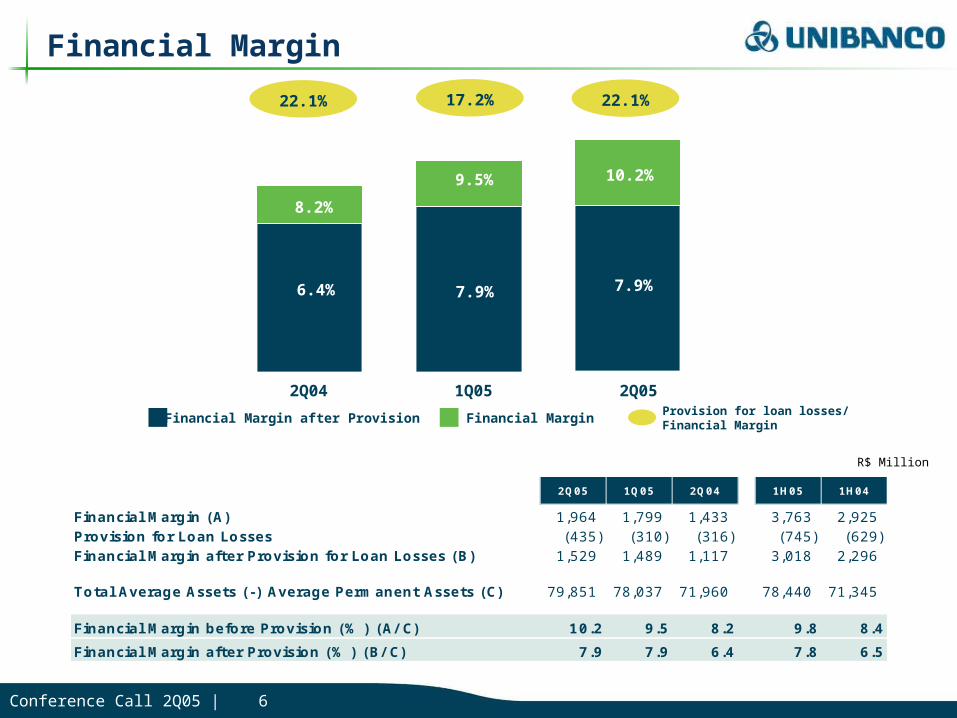
Financial MarginFinancial Margin after Provision
6.4% 7.9% 7.9%
2Q04 1Q05 2Q05
8.2%
9.5% 10.2%
R$ Million
Financial Margin
2Q05 1Q05 2Q04 1H05 1H04
Financial Margin (A) 1,964 1,799 1,433 3,763 2,925Provision for Loan Losses (435) (310) (316) (745) (629)Financial Margin after Provision for Loan Losses (B) 1,529 1,489 1,117 3,018 2,296
Total Average Assets (-) Average Permanent Assets (C) 79,851 78,037 71,960 78,440 71,345
Financial Margin before Provision (% ) (A/ C) 10.2 9.5 8.2 9.8 8.4
Financial Margin after Provision (% ) (B/ C) 7.9 7.9 6.4 7.8 6.5
22.1% 17.2% 22.1%
Provision for loan losses/Financial Margin
Conference Call 2Q05 | 7
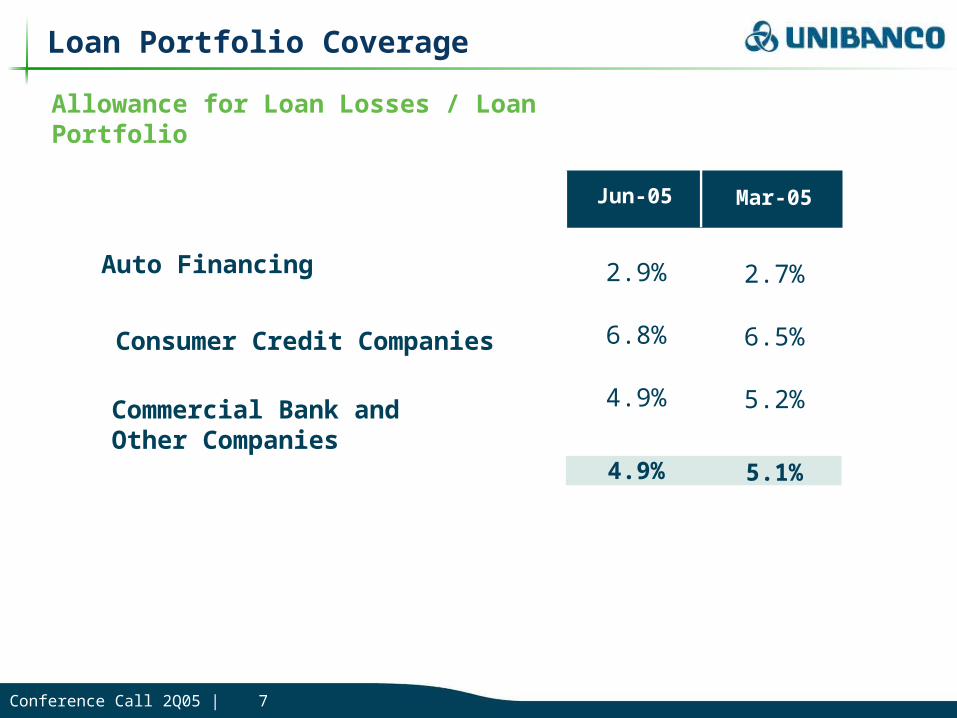
Mar-05
2.7%
6.5%
5.2%
5.1%
Jun-05
2.9%
6.8%
4.9%
4.9%
Allowance for Loan Losses / Loan Portfolio
Loan Portfolio Coverage
Auto Financing
Consumer Credit Companies
Commercial Bank and Other Companies
Conference Call 2Q05 | 8
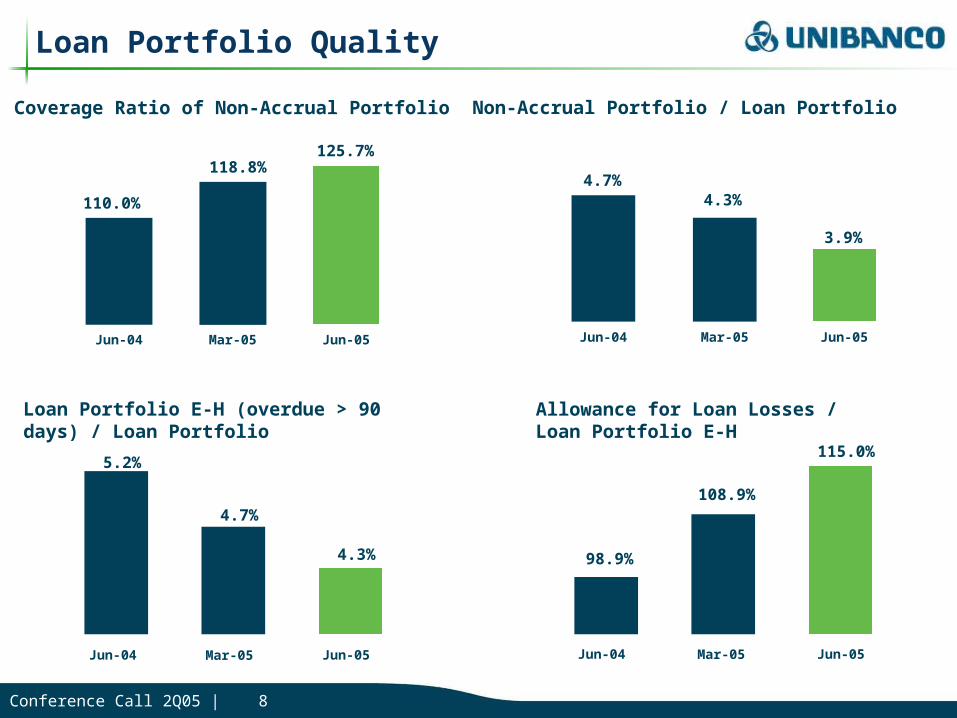
5.2%
4.3%
Jun-04 Jun-05Mar-05
4.7%108.9%
Jun-04 Jun-05Mar-05
115.0%
98.9%
Coverage Ratio of Non-Accrual Portfolio Non-Accrual Portfolio / Loan Portfolio
Jun-04 Mar-05
110.0%
118.8%
Jun-05
125.7%
4.7%4.3%
Jun-04 Mar-05
3.9%
Jun-05
Loan Portfolio Quality
Loan Portfolio E-H (overdue > 90 days) / Loan Portfolio
Allowance for Loan Losses / Loan Portfolio E-H
Conference Call 2Q05 | 9
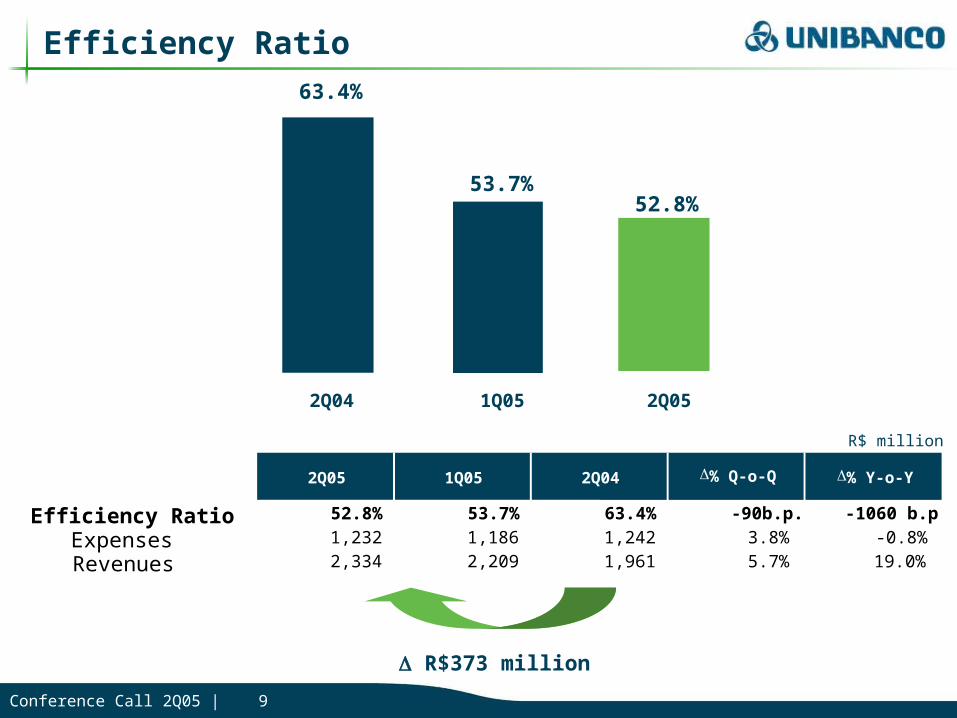
Efficiency Ratio63.4%
53.7%52.8%
2Q04 1Q05 2Q05
R$373 million
R$ million
2Q05 1Q05 2Q04 % Q-o-Q
Efficiency Ratio 52.8% 53.7% 63.4% -90b.p. -1060 b.p
Expenses 1,232 1,186 1,242 3.8% -0.8%
Revenues 2,334 2,209 1,961 5.7% 19.0%
% Y-o-Y
Conference Call 2Q05 | 10
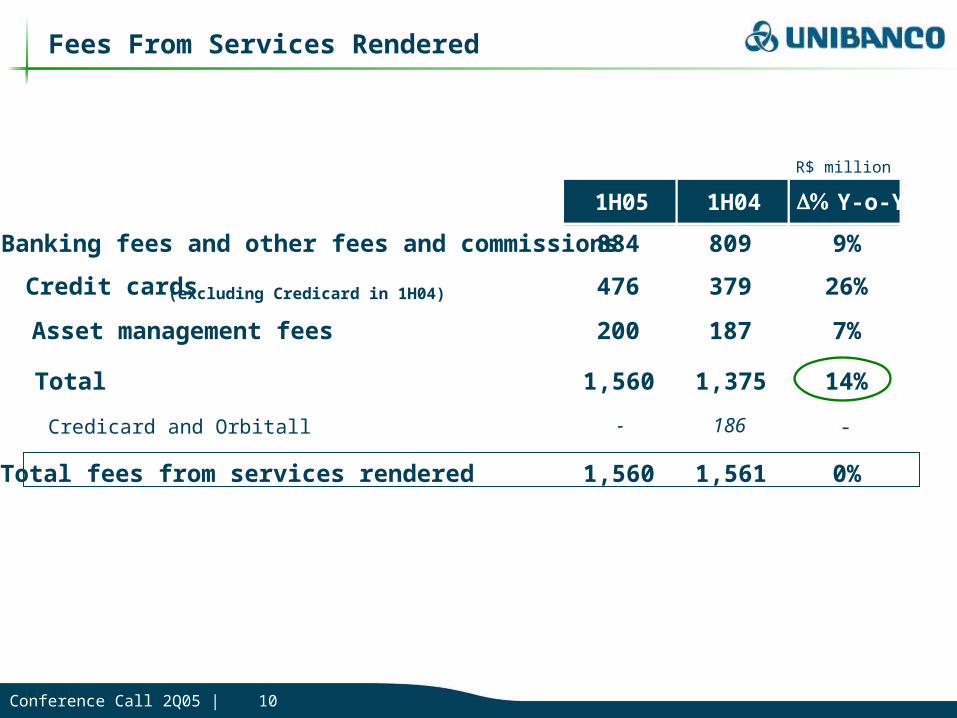
Fees From Services Rendered
R$ million
1H05 1H04 Y-o-Y
Banking fees and other fees and commissions 884 809 9%
Credit cards (excluding Credicard in 1H04) 476 379 26%
Asset management fees 200 187 7%
Total 1,560 1,375 14%
Credicard and Orbitall - 186 -
Total fees from services rendered 1,560 1,561 0%
Conference Call 2Q05 | 11
R$ million
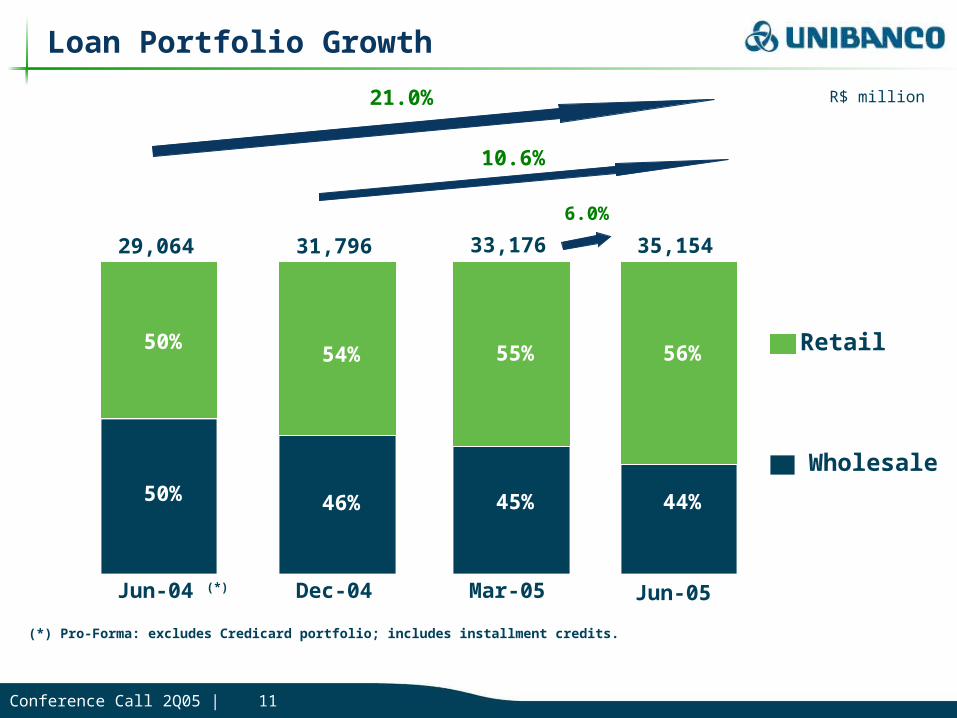
33,17631,79629,064
Wholesale
Retail
21.0%
Dec-04 Mar-05Jun-04 (*)
35,154
Jun-05
6.0%
10.6%
(*) Pro-Forma: excludes Credicard portfolio; includes installment credits.
Loan Portfolio Growth
45%
55%
46%
54%
50%
50%
44%
56%
Conference Call 2Q05 | 12
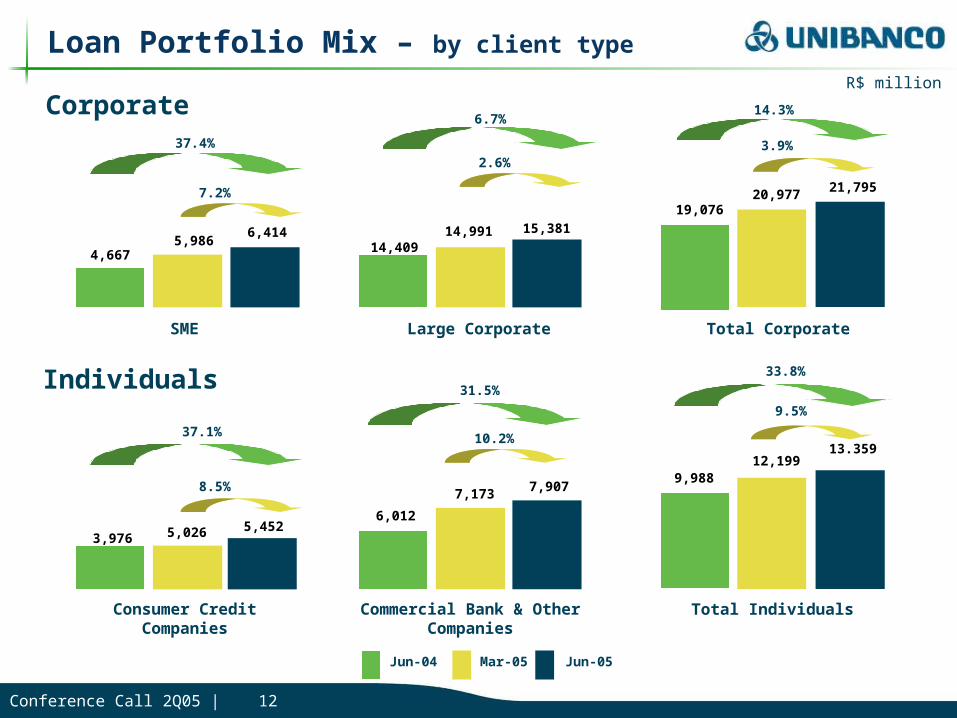
Corporate
Individuals
SME Large Corporate Total Corporate
Consumer Credit Companies
Commercial Bank & Other Companies
Total Individuals
19,076
21,79520,977
14.3%
3.9%
4,667
6,4145,986 14,409
15,38114,991
37.4%
7.2%
6.7%
2.6%
9,988
13.35912,199
33.8%
9.5%
3,9765,4525,026
6,012
7,9077,173
37.1%
8.5%
31.5%
10.2%
R$ million
Jun-04 Mar-05 Jun-05
Loan Portfolio Mix – by client type
Conference Call 2Q05 | 13
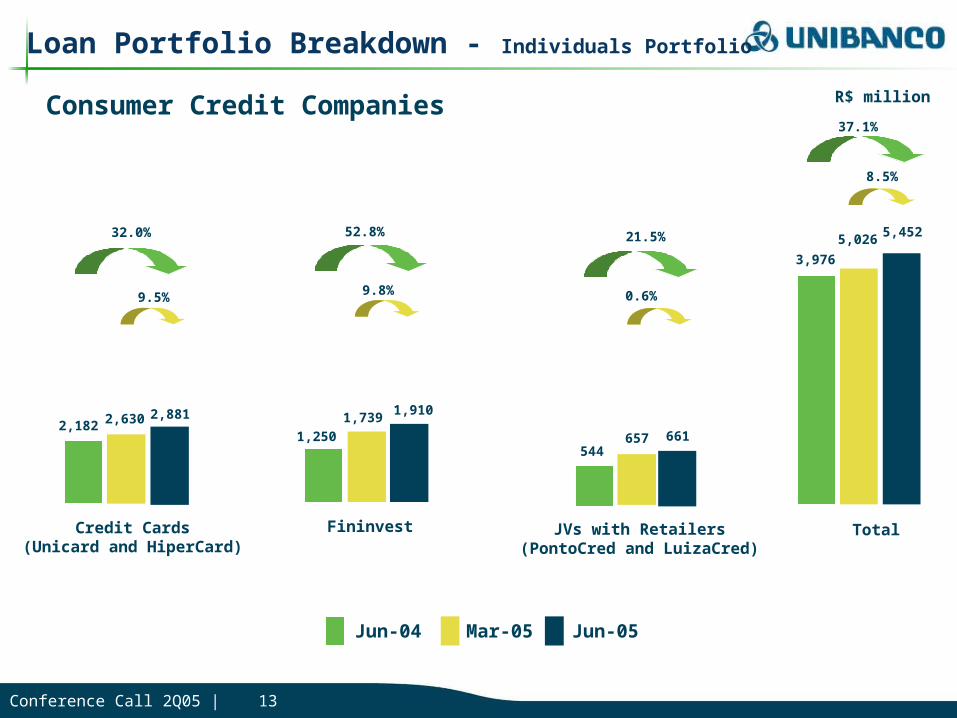
Consumer Credit Companies
3,976
5,026 5,452
Total
37.1%
8.5%
32.0%
9.5%
21.5%
0.6%
Credit Cards(Unicard and HiperCard)
JVs with Retailers(PontoCred and LuizaCred)
1,2501,739 1,910
2,182 2,630 2,881
544657 661
Fininvest
52.8%
9.8%
Jun-04 Mar-05 Jun-05
Loan Portfolio Breakdown - Individuals Portfolio
R$ million
Conference Call 2Q05 | 14
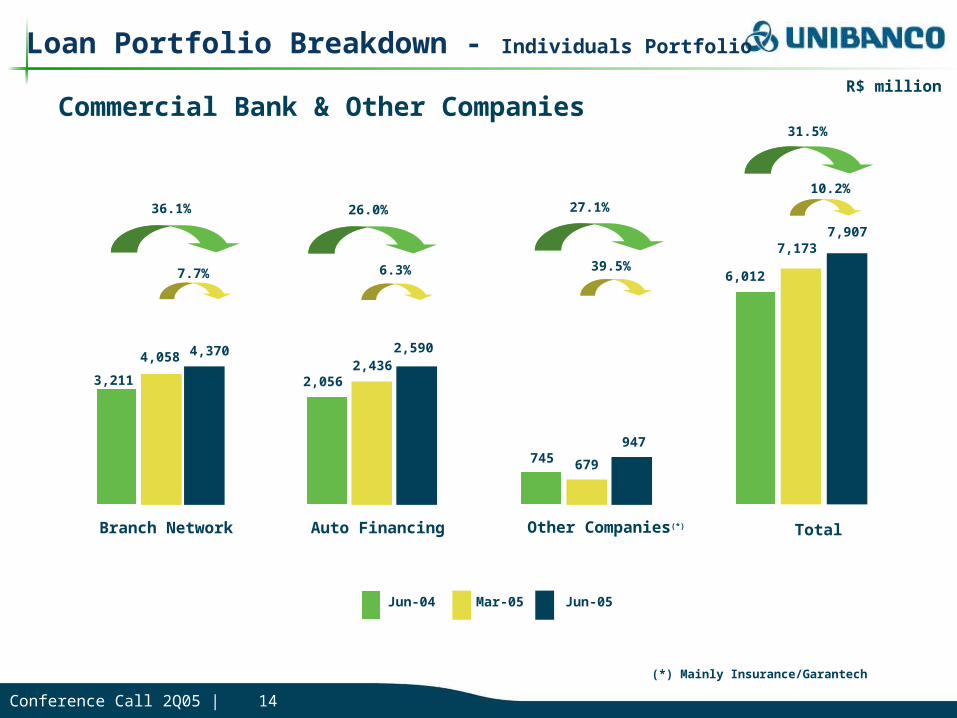
Commercial Bank & Other Companies
Loan Portfolio Breakdown - Individuals Portfolio
Branch Network TotalAuto Financing Other Companies(*)
6,012
7,1737,907
31.5%
10.2%
745 679
947
3,211
4,058 4,370
2,0562,436
2,590
36.1%
7.7%
26.0%
6.3%
27.1%
39.5%
R$ million
(*) Mainly Insurance/Garantech
Jun-04 Mar-05 Jun-05
Conference Call 2Q05 | 15
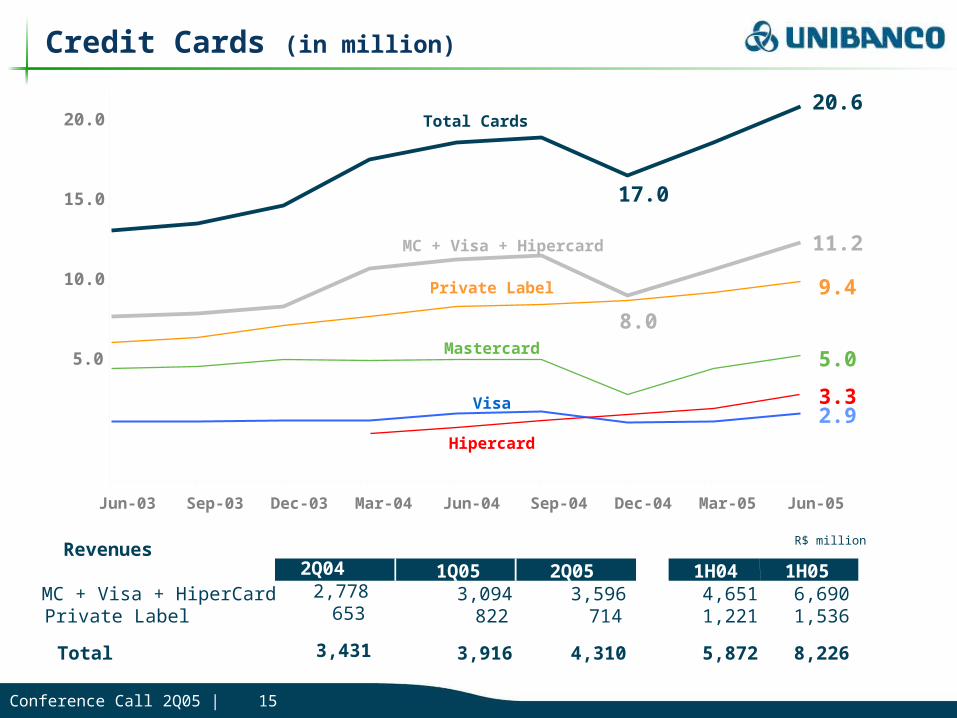
Credit Cards (in million)
5.0
10.0
15.0
20.0
Jun-03 Sep-03 Dec-03 Mar-04 Jun-04 Sep-04 Dec-04 Mar-05 Jun-05
Visa
Mastercard
Private Label
MC + Visa + Hipercard
Total Cards
Hipercard
20.6
9.4
5.0
3.32.9
11.2
17.0
2Q051Q052Q04 1H051H04MC + Visa + HiperCard 3,596 3,094 2,778 6,690 4,651 Private Label 714 822 653 1,536 1,221
Total 4,310 3,916 3,431 8,226 5,872
8.0
RevenuesR$ million
Conference Call 2Q05 | 16
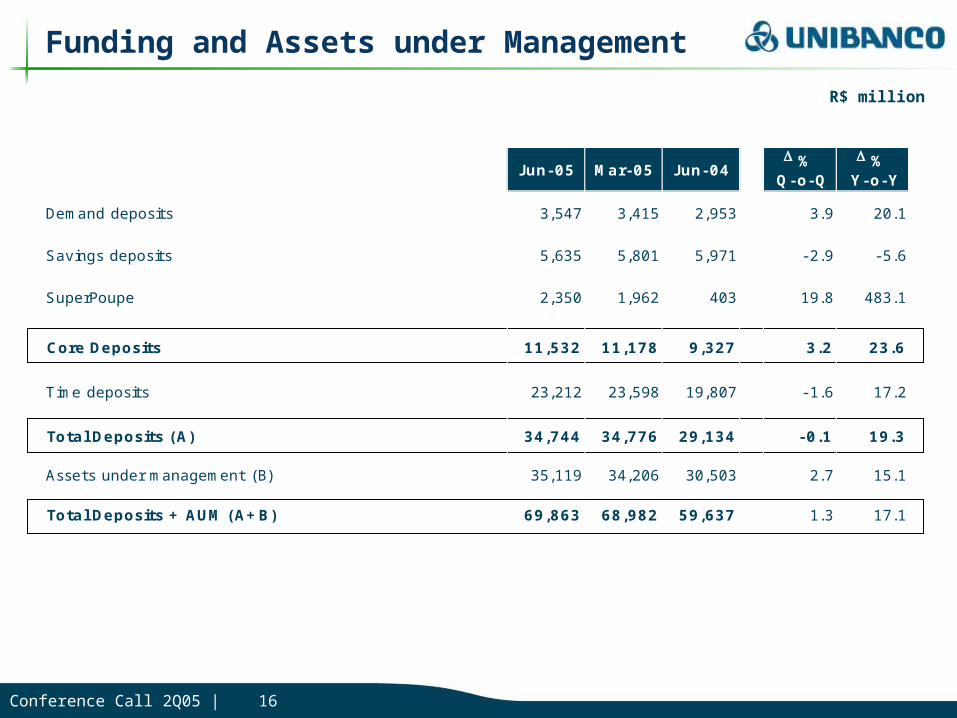
Funding and Assets under Management
J un-05 Mar-05 Jun-04 %
Q-o-Q
% Y-o-Y
Demand deposits 3,547 3,415 2,953 3.9 20.1
Savings deposits 5,635 5,801 5,971 - 2.9 - 5.6
SuperPoupe 2,350 1,962 403 19.8 483.1
Core Deposits 11,532 11,178 9,327 3.2 23.6
Time deposits 23,212 23,598 19,807 - 1.6 17.2
Total Deposits (A) 34,744 34,776 29,134 -0.1 19.3
Assets under management (B) 35,119 34,206 30,503 2.7 15.1
Total Deposits + AUM (A+B) 69,863 68,982 59,637 1.3 17.1
R$ million
Conference Call 2Q05 | 17
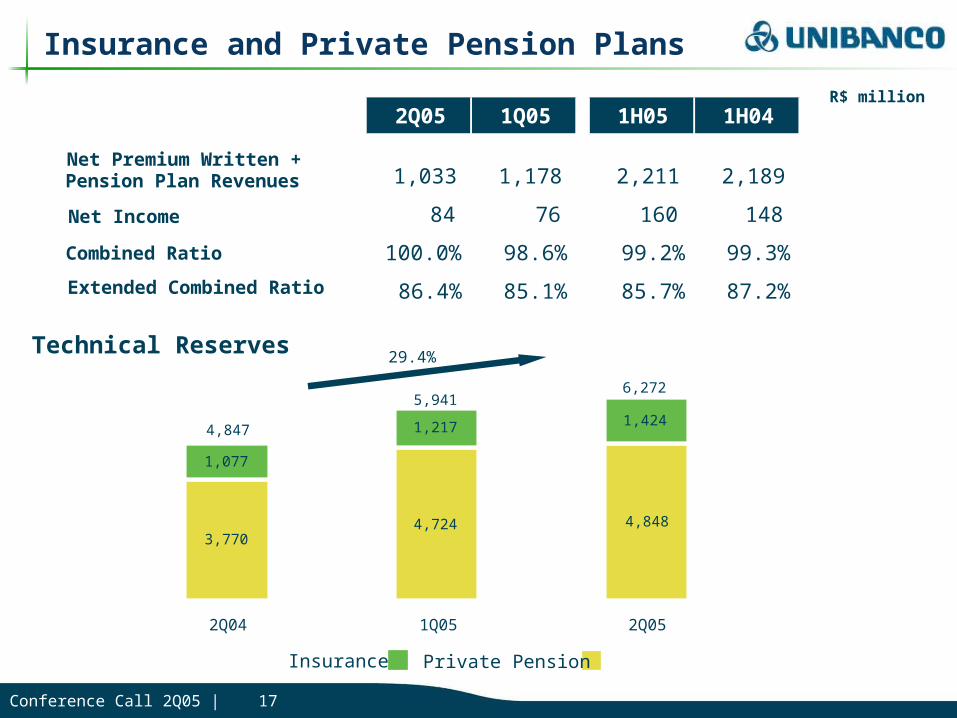
3,7704,724 4,848
1,077
1,217 1,424
2Q04 1Q05 2Q05
4,847
5,9416,272
29.4%
Insurance and Private Pension Plans
Technical Reserves
Private PensionInsurance
R$ million
Net Premium Written +Pension Plan Revenues
Net Income
Combined Ratio
Extended Combined Ratio
2Q05 1Q05 1H05 1H04
1,033 1,178 2,211 2,189
84 76 160 148
100.0% 98.6% 99.2% 99.3%
86.4% 85.1% 85.7% 87.2%
Conference Call 2Q05 | 18
Highlights
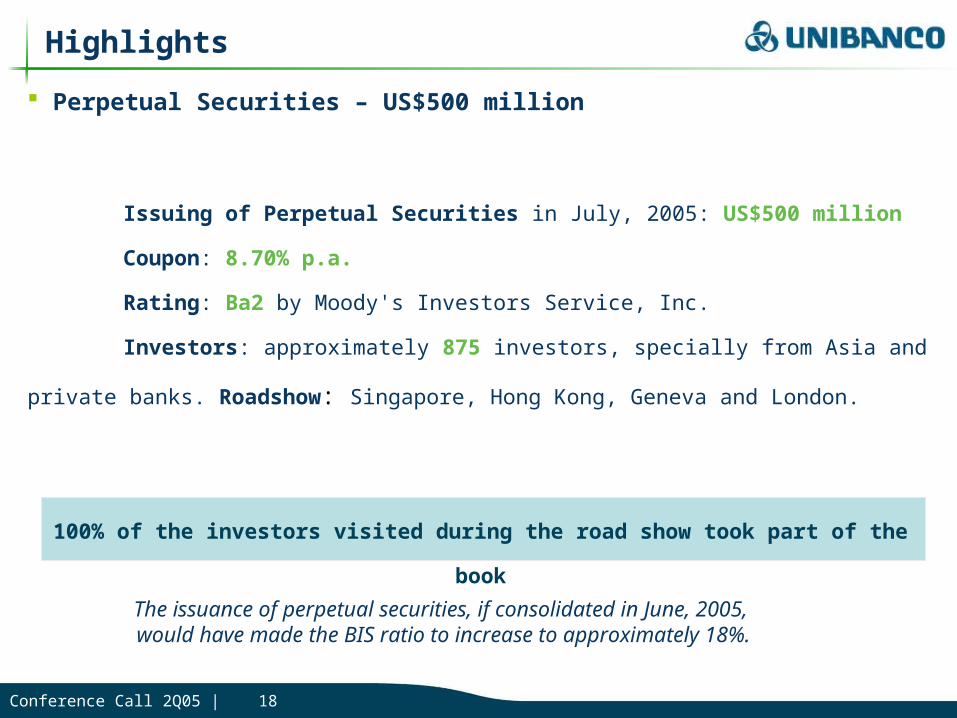
Perpetual Securities – US$500 million
Issuing of Perpetual Securities in July, 2005: US$500 million
Coupon: 8.70% p.a.
Rating: Ba2 by Moody's Investors Service, Inc.
Investors: approximately 875 investors, specially from Asia and private banks.
Roadshow: Singapore, Hong Kong, Geneva and London.
100% of the investors visited during the road show took part of the book
The issuance of perpetual securities, if consolidated in June, 2005, would have made the BIS ratio to increase to approximately 18%.
Conference Call 2Q05 | 19
Highlights
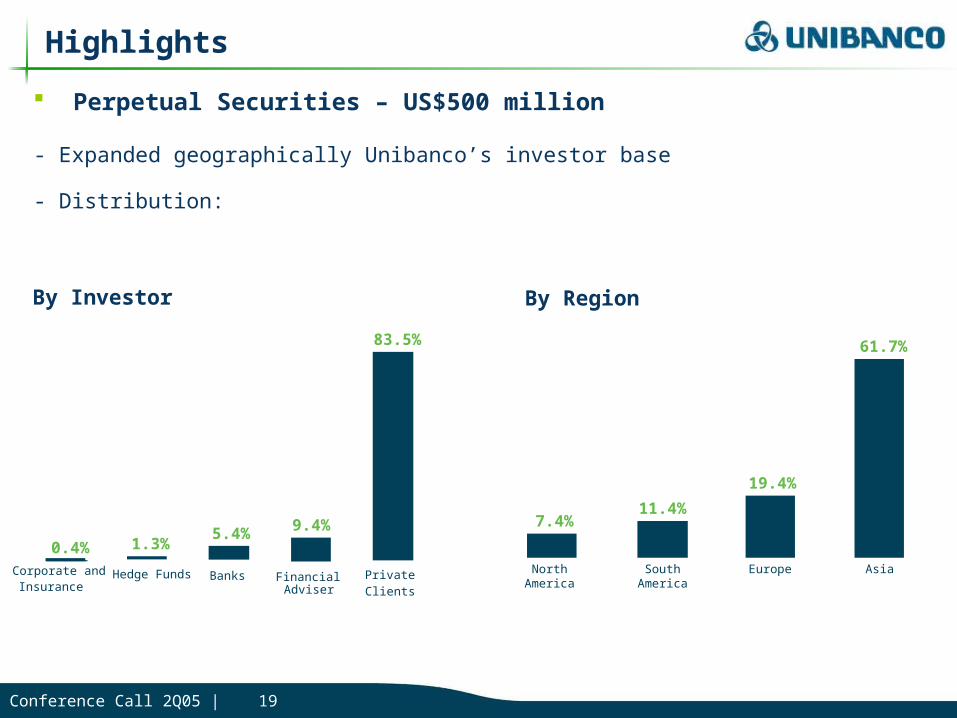
Perpetual Securities – US$500 million
- Expanded geographically Unibanco’s investor base
- Distribution:
By Investor By Region
7.4%11.4%
19.4%
61.7%
North America
South America
Europe Asia
83.5%
9.4%5.4%1.3%0.4%
ClientsPrivate
AdviserFinancialBanksHedge FundsCorporate and
Insurance
Conference Call 2Q05 | 20
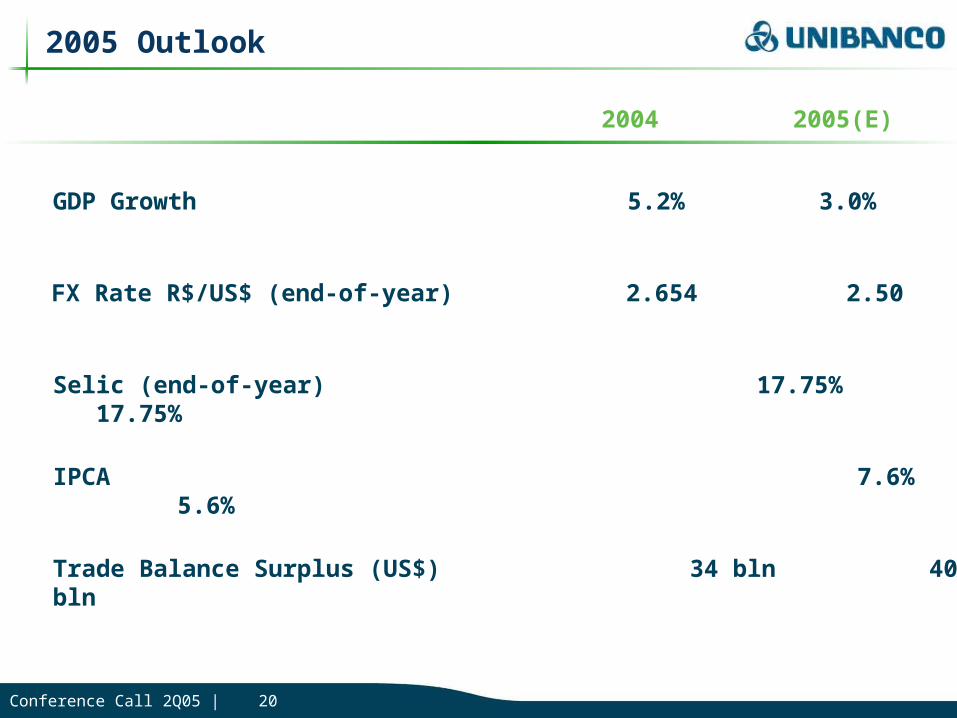
GDP Growth 5.2% 3.0%
FX Rate R$/US$ (end-of-year) 2.654 2.50
Selic (end-of-year) 17.75% 17.75%
IPCA 7.6% 5.6%
2004 2005(E)
2005 Outlook
Trade Balance Surplus (US$) 34 bln 40 bln
Conference Call 2Q05 | 21
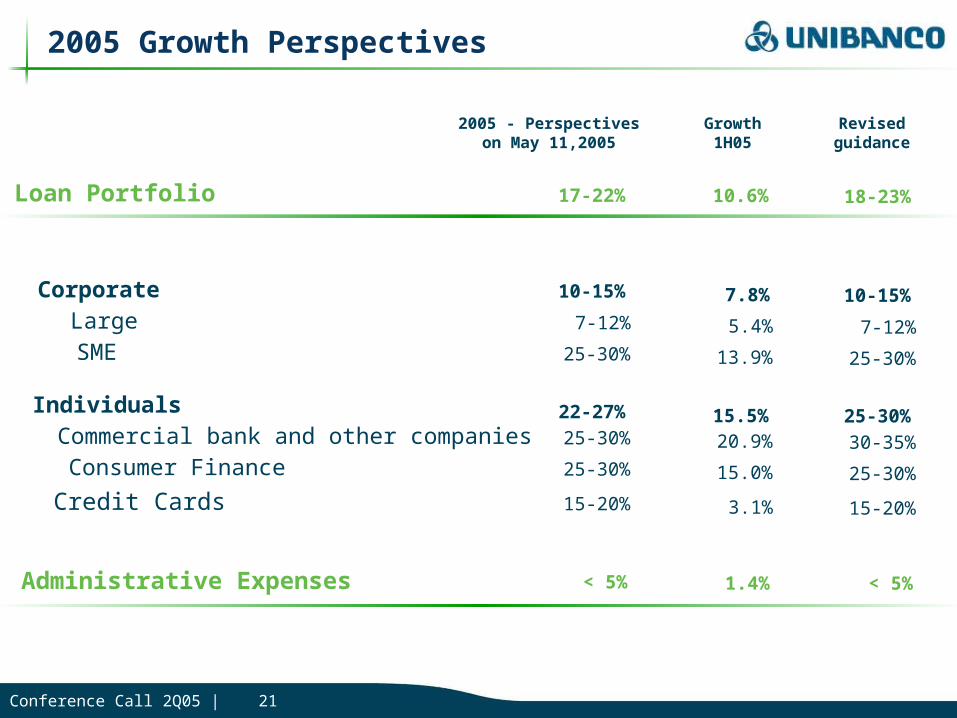
7.8%
5.4%
13.9%
15.5%20.9%
15.0%
7-12%
25-30%
30-35%
25-30%
10-15%
25-30%
7-12%
25-30%
25-30%
25-30%
10-15%
22-27%
Loan Portfolio
CorporateLargeSME
IndividualsCommercial bank and other companiesConsumer Finance
Administrative Expenses
Growth1H05
2005 - Perspectiveson May 11,2005
< 5%
17-22%
Revisedguidance
10.6%
1.4% < 5%
18-23%
2005 Growth Perspectives
Credit Cards 3.1% 15-20%15-20%

Conference Call 2Q05 | 22
For further information contact our Investor Relations Area at
phone: 5511-3097-1980fax: 5511-3813-6182
email: [email protected]: www.ir.unibanco.com
This presentation contains forward-looking statements regarding Unibanco. its subsidiaries and affiliates - anticipated synergies. growth plans. projected results and future strategies. Although these forward-looking statements reflect management’s good faith beliefs. they involve known and unknown risks and uncertainties that may cause the Company’s actual results or outcomes to be materially different from those anticipated and discussed herein. These risks and uncertainties include. but are not limited to. our ability to realize the amount of the projected synergies and the timetable projected. as well as economic. competitive. governmental and technological factors affecting Unibanco’s operations. markets. products and prices. and other factors detailed in Unibanco’s filings with the Securities and Exchange Commission which readers are urged to read carefully in assessing the forward-looking statements contained herein. Unibanco undertakes no duty to update any of the projections contained herein.