
Investor Relations Department - RI Mobileir.bmfbovespa.com.br/enu/2845/BVMF Presentation - August...
56
1 Public Public August/2016 X Investor Relations Department São Paulo, SP
Transcript of Investor Relations Department - RI Mobileir.bmfbovespa.com.br/enu/2845/BVMF Presentation - August...
1PublicPublicAugust/2016 X
Investor Relations Department
São Paulo, SP
2
ForwardLookingStatements
This presentation may contain certain statements that express the management’s expectations, beliefs and assumptions about future events or results. Such statements are not historical fact, being based on currently available competitive, financial and economic data, and on current projections about the industries BM&FBOVESPA works in.
The verbs “anticipate,” “believe,” “estimate,” “expect,” “forecast,” “plan,” “predict,” “project,” “target” and other similar verbs are intended to identify these forward-looking statements, which involve risks and uncertainties that could cause actual results to differ materially from those projected in this presentation and do not guarantee any future BM&FBOVESPA performance.
The factors that might affect performance include, but are not limited to: (i) market acceptance of BM&FBOVESPA services; (ii) volatility related to (a) the Brazilian economy and securities markets and (b) the highly-competitive industries BM&FBOVESPA operates in; (iii) changes in (a) domestic and foreign legislation and taxation and (b) government policies related to the financial and securities markets; (iv) increasing competition from new entrants to the Brazilian markets; (v) ability to keep up with rapid changes in technological environment, including the implementation of enhanced functionality demanded by BM&FBOVESPA customers; (vi) ability to maintain an ongoing process for introducing competitive new products and services, while maintaining the competitiveness of existing ones; (vii) ability to attract new customers in domestic and foreign jurisdictions; (viii) ability to expand the offer of BM&FBOVESPA products in foreign jurisdictions.
All forward-looking statements in this presentation are based on information and data available as of the date they were made, and BM&FBOVESPA undertakes no obligation to update them in light of new information or future development.
This presentation does not constitute an offer to sell or the solicitation of an offer to buy any securities, nor shall there be any sale of securities where such offer or sale would be unlawful prior to registration or qualification under the securities law. No offering shall be made except by means of a prospectus meeting the requirements of the Brazilian Securities Commission CVM Instruction 400 of 2003, as amended.
3
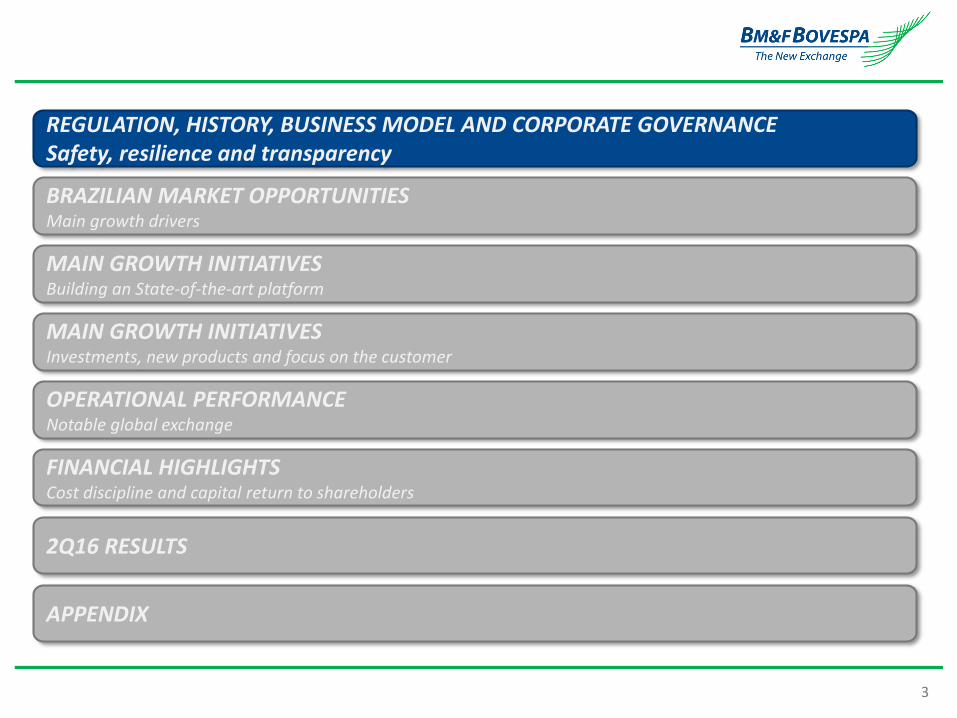
REGULATION, HISTORY, BUSINESS MODEL AND CORPORATE GOVERNANCESafety, resilience and transparency
BRAZILIAN MARKET OPPORTUNITIESMain growth drivers
MAIN GROWTH INITIATIVESBuilding an State-of-the-art platform
OPERATIONAL PERFORMANCENotable global exchange
FINANCIAL HIGHLIGHTSCost discipline and capital return to shareholders
2Q16 RESULTS
APPENDIX
MAIN GROWTH INITIATIVESInvestments, new products and focus on the customer
4
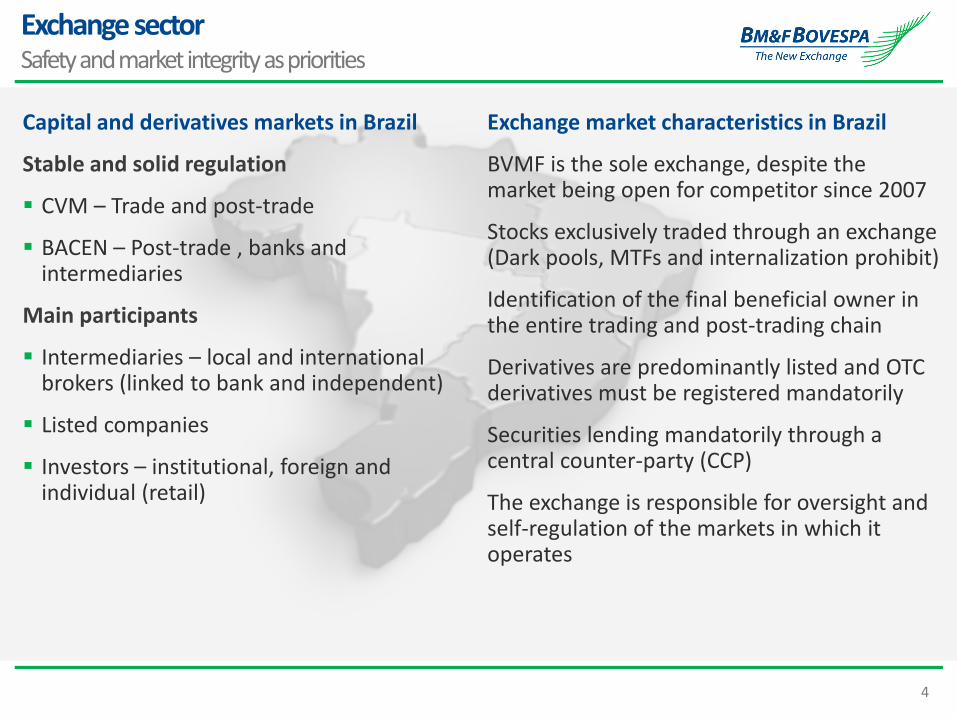
Exchange sectorSafety and market integrity as priorities
Capital and derivatives markets in Brazil
Stable and solid regulation
CVM – Trade and post-trade
BACEN – Post-trade , banks and intermediaries
Main participants
Intermediaries – local and international brokers (linked to bank and independent)
Listed companies
Investors – institutional, foreign and individual (retail)
Exchange market characteristics in Brazil
BVMF is the sole exchange, despite the market being open for competitor since 2007
Stocks exclusively traded through an exchange(Dark pools, MTFs and internalization prohibit)
Identification of the final beneficial owner in the entire trading and post-trading chain
Derivatives are predominantly listed and OTC derivatives must be registered mandatorily
Securities lending mandatorily through a central counter-party (CCP)
The exchange is responsible for oversight and self-regulation of the markets in which it operates
5
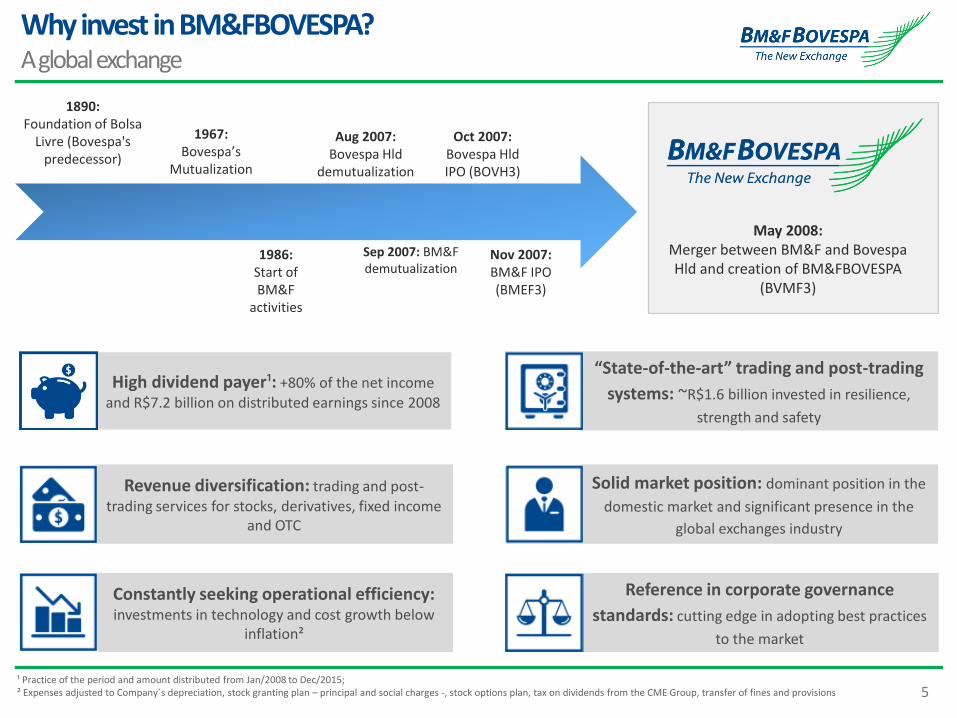
“State-of-the-art” trading and post-trading
systems: ~R$1.6 billion invested in resilience,
strength and safety
Solid market position: dominant position in the
domestic market and significant presence in the
global exchanges industry
Reference in corporate governance
standards: cutting edge in adopting best practices
to the market
High dividend payer¹: +80% of the net income and R$7.2 billion on distributed earnings since 2008
Revenue diversification: trading and post-
trading services for stocks, derivatives, fixed income and OTC
Constantly seeking operational efficiency: investments in technology and cost growth below
inflation²
Why invest in BM&FBOVESPA?A global exchange
1890:Foundation of Bolsa
Livre (Bovespa'spredecessor)
Aug 2007: Bovespa Hld
demutualization
Oct 2007: Bovespa HldIPO (BOVH3)
1967:Bovespa’s
Mutualization
1986:Start of BM&F
activities
Sep 2007: BM&F demutualization
Nov 2007: BM&F IPO(BMEF3)
May 2008: Merger between BM&F and Bovespa Hld and creation of BM&FBOVESPA
(BVMF3)
¹ Practice of the period and amount distributed from Jan/2008 to Dec/2015;² Expenses adjusted to Company´s depreciation, stock granting plan – principal and social charges -, stock options plan, tax on dividends from the CME Group, transfer of fines and provisions
6
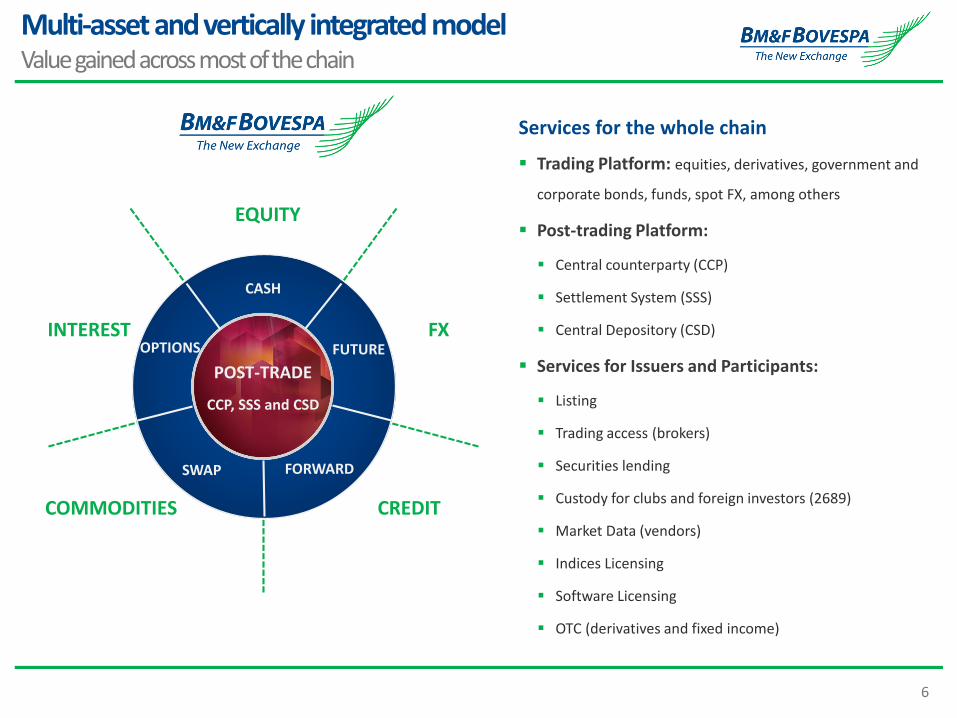
Services for the whole chain
Trading Platform: equities, derivatives, government and
corporate bonds, funds, spot FX, among others
Post-trading Platform:
Central counterparty (CCP)
Settlement System (SSS)
Central Depository (CSD)
Services for Issuers and Participants:
Listing
Trading access (brokers)
Securities lending
Custody for clubs and foreign investors (2689)
Market Data (vendors)
Indices Licensing
Software Licensing
OTC (derivatives and fixed income)
COMMODITIES
FXINTEREST
CREDIT
EQUITY
CCP, SSS and CSD
POST-TRADE
CASH
FUTUREOPTIONS
FORWARDSWAP
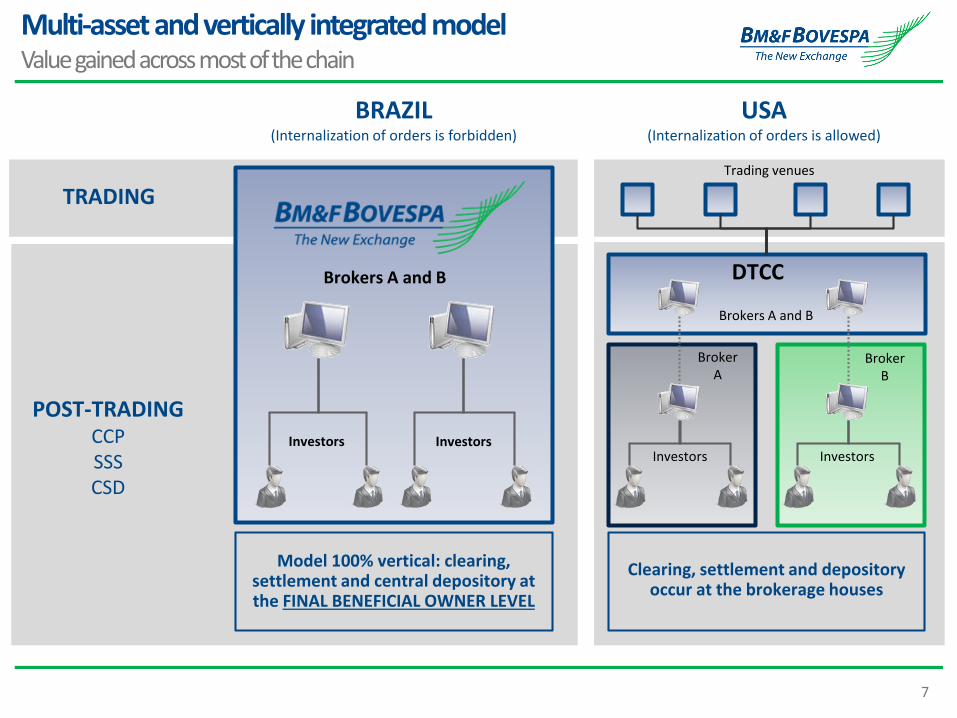
Multi-asset and vertically integrated modelValue gained across most of the chain
7
DTCC
BRAZIL(Internalization of orders is forbidden)
USA(Internalization of orders is allowed)
POST-TRADINGCCPSSSCSD
TRADING
Brokers A and B
Investors Investors
Brokers A and B
Investors Investors
BrokerA
BrokerB
Model 100% vertical: clearing, settlement and central depository at the FINAL BENEFICIAL OWNER LEVEL
Clearing, settlement and depository occur at the brokerage houses
Trading venues
Multi-asset and vertically integrated modelValue gained across most of the chain
8
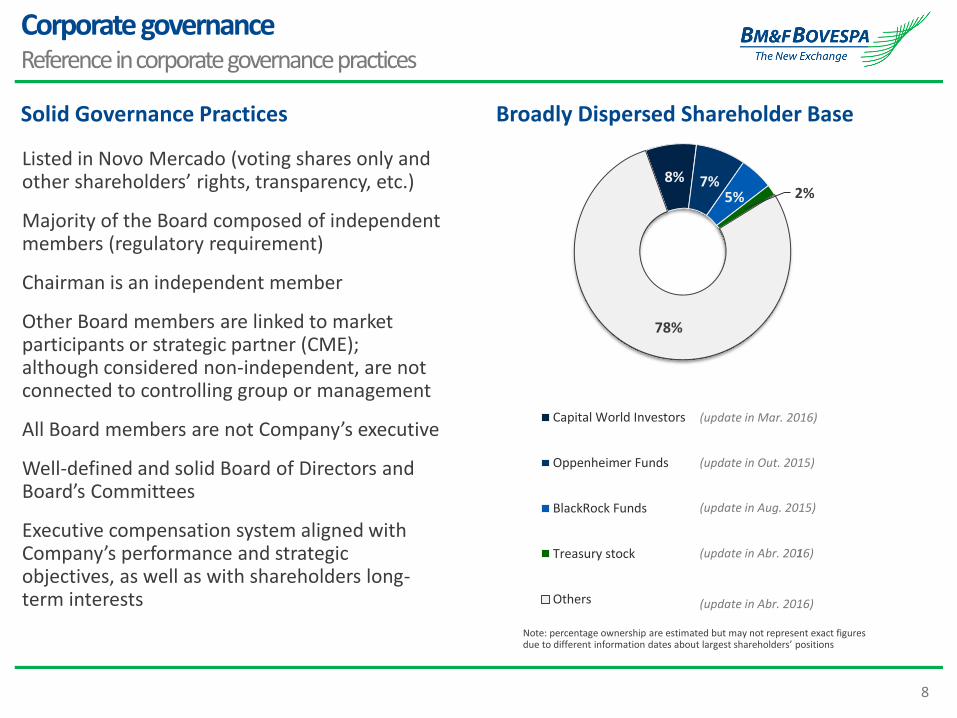
8% 7%5% 2%
78%
Capital World Investors
Oppenheimer Funds
BlackRock Funds
Treasury stock
Others
(update in Mar. 2016)
Listed in Novo Mercado (voting shares only and other shareholders’ rights, transparency, etc.)
Majority of the Board composed of independent members (regulatory requirement)
Chairman is an independent member
Other Board members are linked to market participants or strategic partner (CME); although considered non-independent, are not connected to controlling group or management
All Board members are not Company’s executive
Well-defined and solid Board of Directors and Board’s Committees
Executive compensation system aligned with Company’s performance and strategic objectives, as well as with shareholders long-term interests
Solid Governance Practices Broadly Dispersed Shareholder Base
(update in Out. 2015)
(update in Abr. 2016)
Note: percentage ownership are estimated but may not represent exact figures due to different information dates about largest shareholders’ positions
Corporate governanceReference in corporate governance practices
(update in Abr. 2016)
(update in Aug. 2015)
9
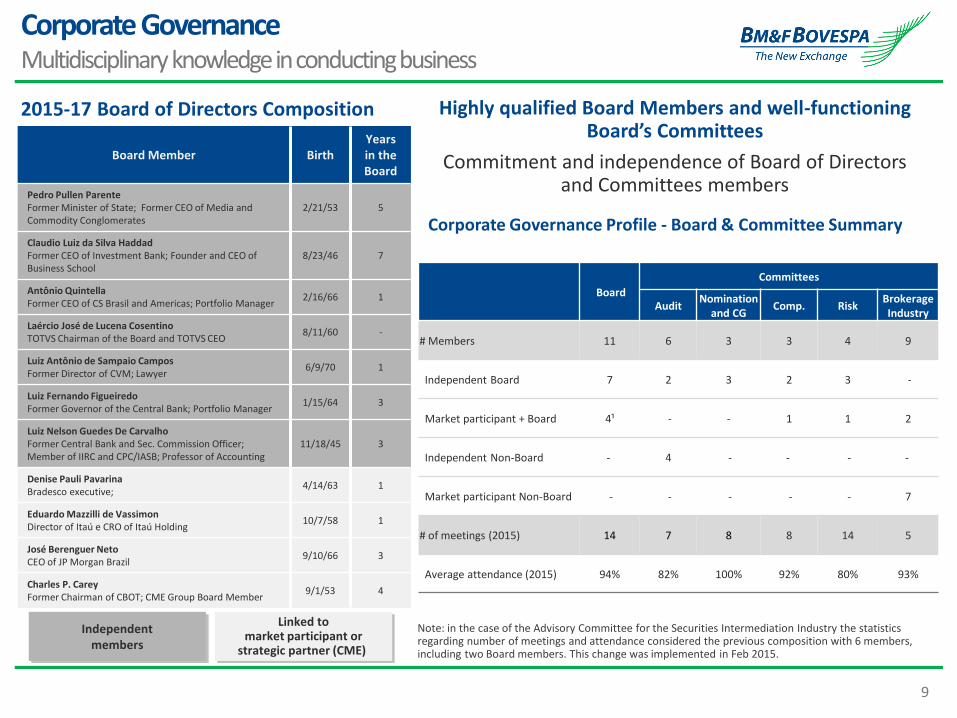
2015-17 Board of Directors Composition
Independentmembers
Linked tomarket participant or
strategic partner (CME)
Corporate Governance Profile - Board & Committee Summary
Board
Committees
AuditNomination
and CGComp. Risk
Brokerage Industry
# Members 11 6 3 3 4 9
Independent Board 7 2 3 2 3 -
Market participant + Board 4¹ - - 1 1 2
Independent Non-Board - 4 - - - -
Market participant Non-Board - - - - - 7
# of meetings (2015) 14 7 8 8 14 5
Average attendance (2015) 94% 82% 100% 92% 80% 93%
Board Member BirthYears in the Board
Pedro Pullen ParenteFormer Minister of State; Former CEO of Media and Commodity Conglomerates
2/21/53 5
Claudio Luiz da Silva HaddadFormer CEO of Investment Bank; Founder and CEO of Business School
8/23/46 7
Antônio QuintellaFormer CEO of CS Brasil and Americas; Portfolio Manager
2/16/66 1
Laércio José de Lucena CosentinoTOTVS Chairman of the Board and TOTVS CEO
8/11/60 -
Luiz Antônio de Sampaio CamposFormer Director of CVM; Lawyer
6/9/70 1
Luiz Fernando FigueiredoFormer Governor of the Central Bank; Portfolio Manager
1/15/64 3
Luiz Nelson Guedes De CarvalhoFormer Central Bank and Sec. Commission Officer; Member of IIRC and CPC/IASB; Professor of Accounting
11/18/45 3
Denise Pauli PavarinaBradesco executive;
4/14/63 1
Eduardo Mazzilli de VassimonDirector of Itaú e CRO of Itaú Holding
10/7/58 1
José Berenguer NetoCEO of JP Morgan Brazil
9/10/66 3
Charles P. CareyFormer Chairman of CBOT; CME Group Board Member
9/1/53 4
Highly qualified Board Members and well-functioning Board’s Committees
Commitment and independence of Board of Directors and Committees members
Note: in the case of the Advisory Committee for the Securities Intermediation Industry the statistics regarding number of meetings and attendance considered the previous composition with 6 members, including two Board members. This change was implemented in Feb 2015.
Corporate GovernanceMultidisciplinary knowledge in conducting business
10
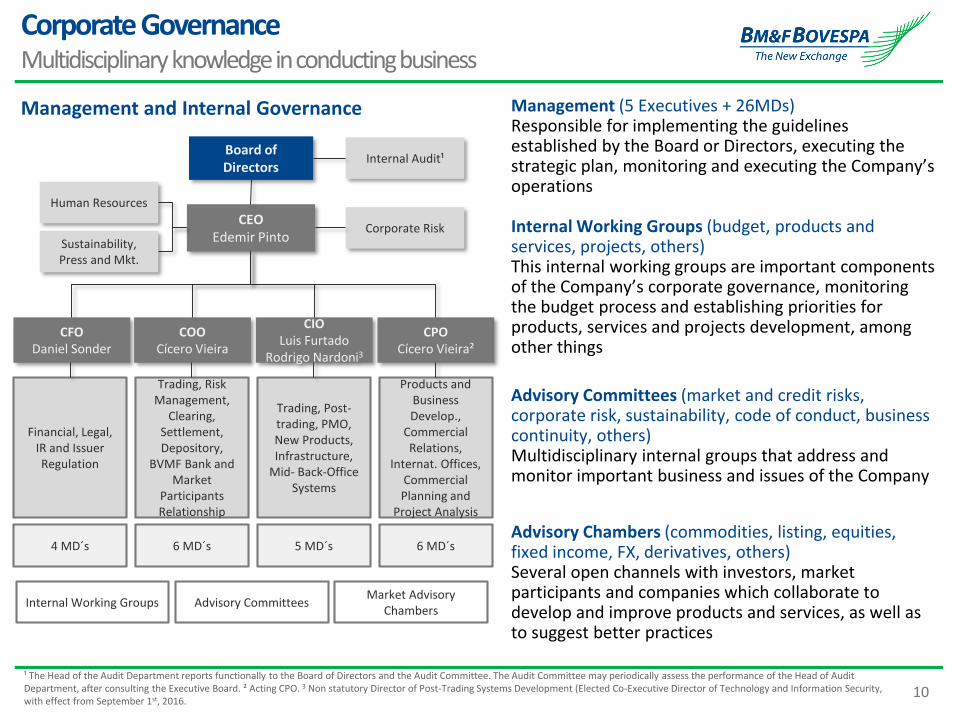
Board of Directors
CEOEdemir Pinto
CFODaniel Sonder
COOCícero Vieira
CIOLuis Furtado
Rodrigo Nardoni3
CPOCícero Vieira²
Management (5 Executives + 26MDs)Responsible for implementing the guidelines established by the Board or Directors, executing the strategic plan, monitoring and executing the Company’s operations
Internal Working Groups (budget, products and services, projects, others)This internal working groups are important components of the Company’s corporate governance, monitoring the budget process and establishing priorities for products, services and projects development, among other things
Advisory Committees (market and credit risks, corporate risk, sustainability, code of conduct, business continuity, others)Multidisciplinary internal groups that address and monitor important business and issues of the Company
Advisory Chambers (commodities, listing, equities, fixed income, FX, derivatives, others)Several open channels with investors, market participants and companies which collaborate to develop and improve products and services, as well as to suggest better practices
Human Resources
Corporate RiskSustainability, Press and Mkt.
Internal Audit¹
Management and Internal Governance
Financial, Legal, IR and Issuer Regulation
Trading, Risk Management,
Clearing, Settlement, Depository,
BVMF Bank and Market
Participants Relationship
Trading, Post-trading, PMO, New Products, Infrastructure,
Mid- Back-Office Systems
Products and Business Develop.,
Commercial Relations,
Internat. Offices, Commercial Planning and
Project Analysis
Internal Working Groups Advisory CommitteesMarket Advisory
Chambers
4 MD´s 6 MD´s 5 MD´s 6 MD´s
Corporate GovernanceMultidisciplinary knowledge in conducting business
¹ The Head of the Audit Department reports functionally to the Board of Directors and the Audit Committee. The Audit Committee may periodically assess the performance of the Head of Audit Department, after consulting the Executive Board. ² Acting CPO. 3 Non statutory Director of Post-Trading Systems Development (Elected Co-Executive Director of Technology and Information Security, with effect from September 1st, 2016.
11
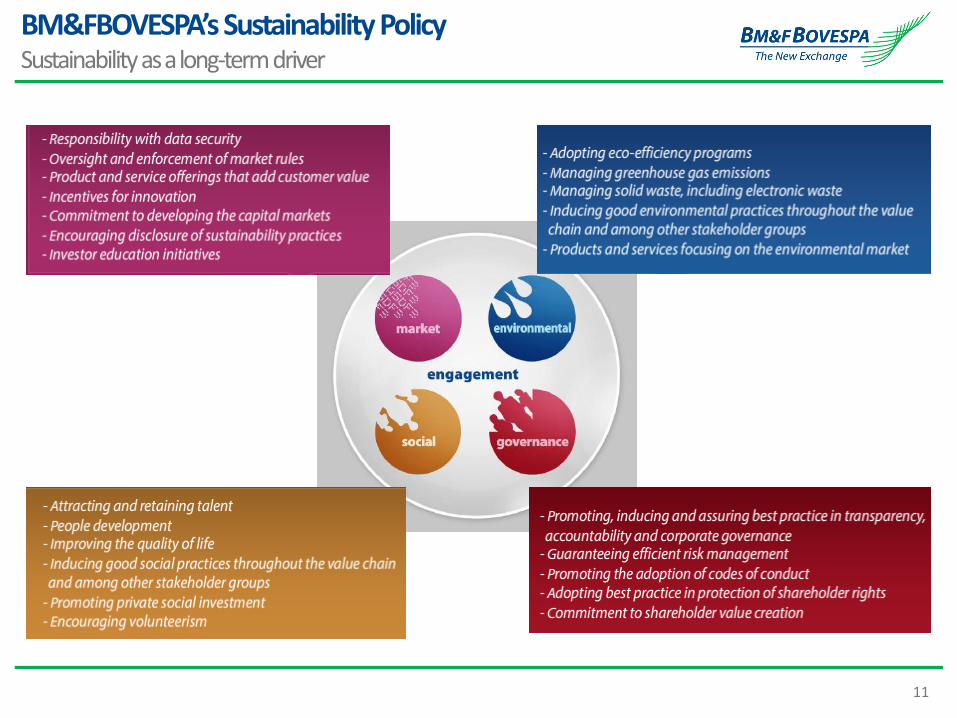
BM&FBOVESPA’s Sustainability PolicySustainability as a long-term driver
12
REGULATION, HISTORY, BUSINESS MODEL AND CORPORATE GOVERNANCESafety, resilience and transparency
BRAZILIAN MARKET OPPORTUNITIESMain growth drivers
MAIN GROWTH INITIATIVESBuilding an State-of-the-art platform
OPERATIONAL PERFORMANCENotable global exchange
FINANCIAL HIGHLIGHTSCost discipline and capital return to shareholders
2Q16 RESULTS
APPENDIX
MAIN GROWTH INITIATIVESInvestments, new products and focus on the customer
13
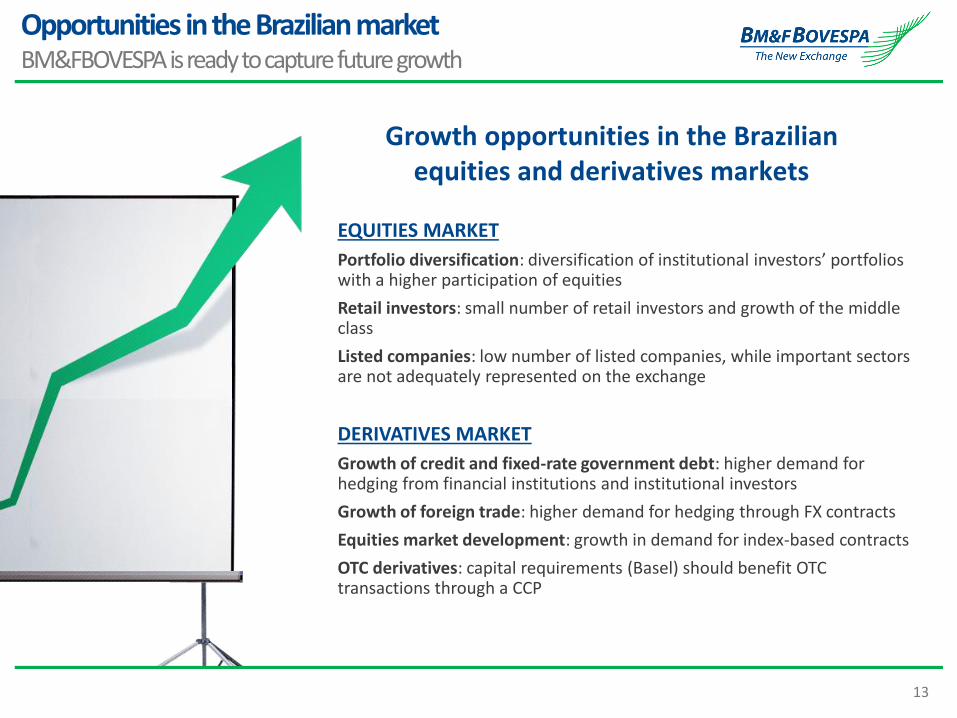
Growth opportunities in the Brazilian equities and derivatives markets
Opportunities in the Brazilian marketBM&FBOVESPA is ready to capture future growth
EQUITIES MARKET
Portfolio diversification: diversification of institutional investors’ portfolios with a higher participation of equities
Retail investors: small number of retail investors and growth of the middle class
Listed companies: low number of listed companies, while important sectors are not adequately represented on the exchange
DERIVATIVES MARKET
Growth of credit and fixed-rate government debt: higher demand for hedging from financial institutions and institutional investors
Growth of foreign trade: higher demand for hedging through FX contracts
Equities market development: growth in demand for index-based contracts
OTC derivatives: capital requirements (Basel) should benefit OTC transactions through a CCP
14
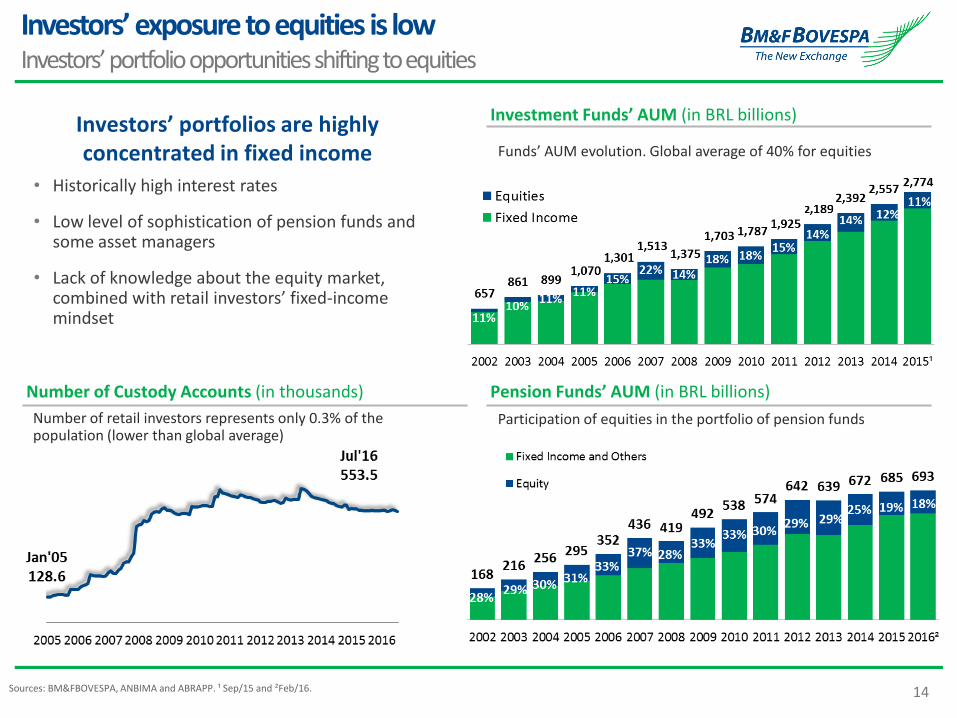
Investors’ exposure to equities is lowInvestors’ portfolio opportunities shifting to equities
Funds’ AUM evolution. Global average of 40% for equities
Investment Funds’ AUM (in BRL billions)
Number of Custody Accounts (in thousands) Pension Funds’ AUM (in BRL billions)
Number of retail investors represents only 0.3% of the population (lower than global average)
Participation of equities in the portfolio of pension funds
Investors’ portfolios are highly concentrated in fixed income
• Historically high interest rates
• Low level of sophistication of pension funds and some asset managers
• Lack of knowledge about the equity market, combined with retail investors’ fixed-income mindset
Sources: BM&FBOVESPA, ANBIMA and ABRAPP. ¹ Sep/15 and ²Feb/16.
15
REGULATION, HISTORY, BUSINESS MODEL AND CORPORATE GOVERNANCESafety, resilience and transparency
BRAZILIAN MARKET OPPORTUNITIESMain growth drivers
MAIN GROWTH INITIATIVESBuilding an State-of-the-art platform
OPERATIONAL PERFORMANCENotable global exchange
FINANCIAL HIGHLIGHTSCost discipline and capital return to shareholders
2Q16 RESULTS
APPENDIX
MAIN GROWTH INITIATIVESInvestments, new products and focus on the customer
16
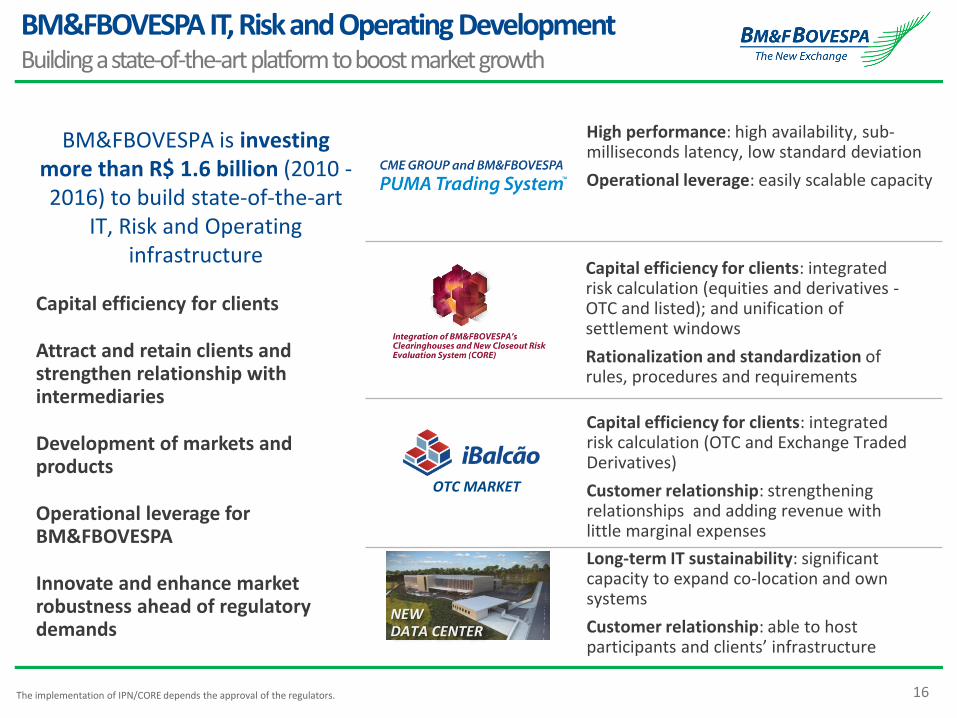
BM&FBOVESPA IT, Risk and Operating DevelopmentBuilding a state-of-the-art platform to boost market growth
BM&FBOVESPA is investing more than R$ 1.6 billion (2010 -2016) to build state-of-the-art
IT, Risk and Operating infrastructure
Capital efficiency for clients
Attract and retain clients and strengthen relationship with intermediaries
Development of markets and products
Operational leverage for BM&FBOVESPA
Innovate and enhance market robustness ahead of regulatory demands
High performance: high availability, sub-milliseconds latency, low standard deviation
Operational leverage: easily scalable capacity
OTC MARKET
Capital efficiency for clients: integrated risk calculation (OTC and Exchange Traded Derivatives)
Customer relationship: strengthening relationships and adding revenue with little marginal expenses
NEW DATA CENTER
Long-term IT sustainability: significant capacity to expand co-location and own systems
Customer relationship: able to host participants and clients’ infrastructure
Capital efficiency for clients: integrated risk calculation (equities and derivatives -OTC and listed); and unification of settlement windows
Rationalization and standardization of rules, procedures and requirements
The implementation of IPN/CORE depends the approval of the regulators.
17
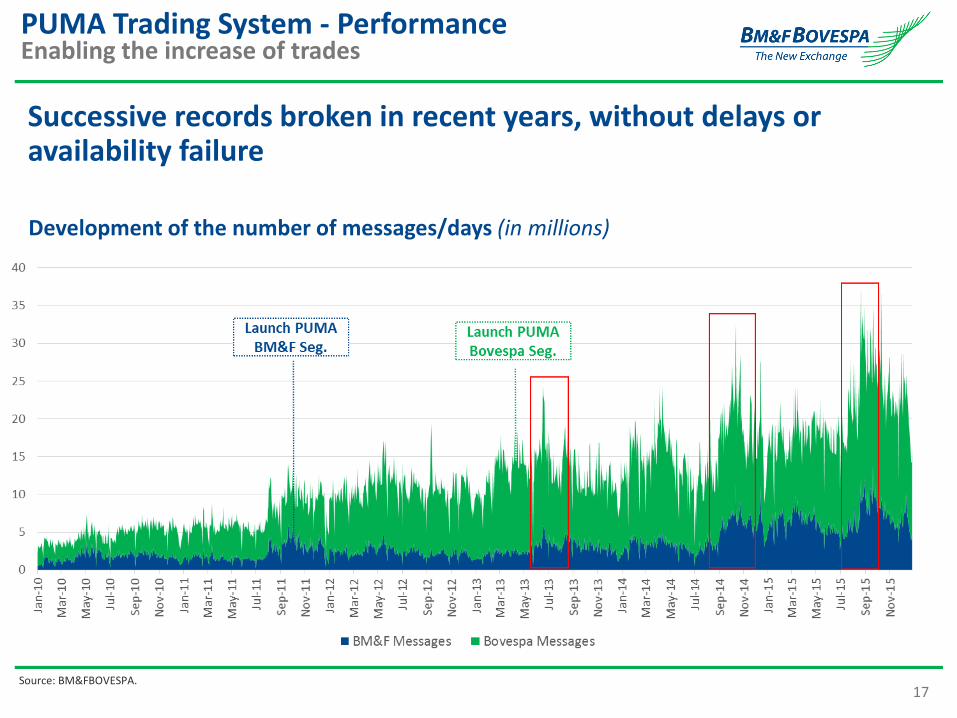
PUMA Trading System - PerformanceEnabling the increase of trades
Successive records broken in recent years, without delays or availability failure
Development of the number of messages/days (in millions)
Source: BM&FBOVESPA.
18
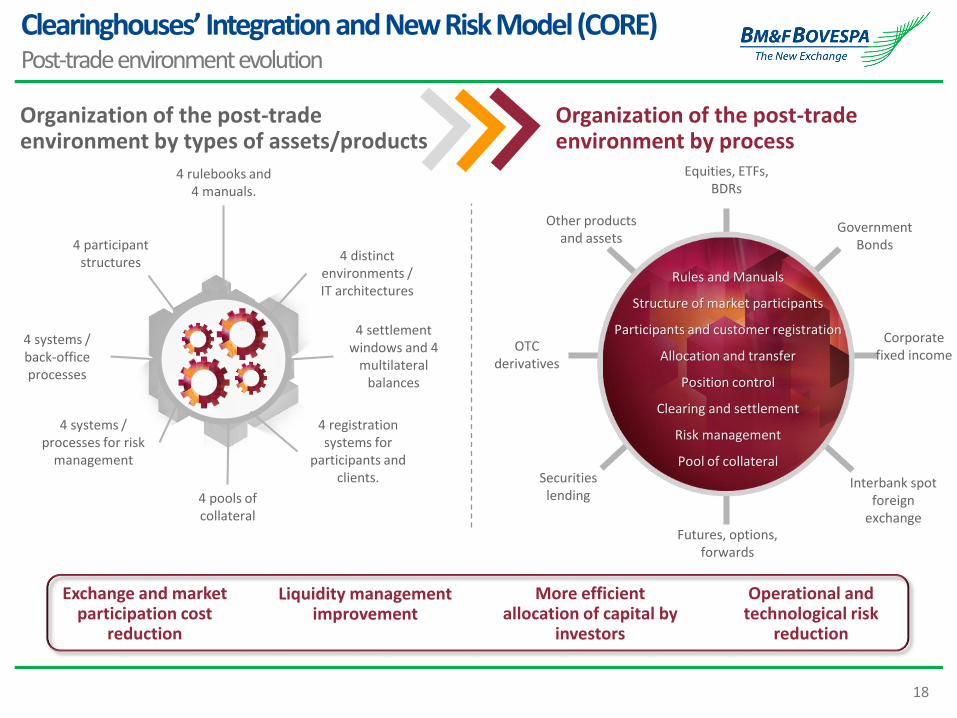
Clearinghouses’ Integration and New Risk Model (CORE)Post-trade environment evolution
Organization of the post-trade environment by types of assets/products
4 rulebooks and 4 manuals.
4 participant structures
4 systems / back-office processes
4 systems / processes for risk
management
4 pools of collateral
4 settlement windows and 4
multilateral balances
4 distinct environments / IT architectures
4 registration systems for
participants and clients.
OTC derivatives
Corporate fixed income
Interbank spot foreign
exchangeFutures, options,
forwards
Securities lending
Other products and assets
Equities, ETFs, BDRs
Rules and Manuals
Structure of market participants
Participants and customer registration
Allocation and transfer
Position control
Clearing and settlement
Risk management
Pool of collateral
Government Bonds
Organization of the post-trade environment by process
Exchange and market participation cost
reduction
Liquidity management improvement
More efficient allocation of capital by
investors
Operational and technological risk
reduction
19
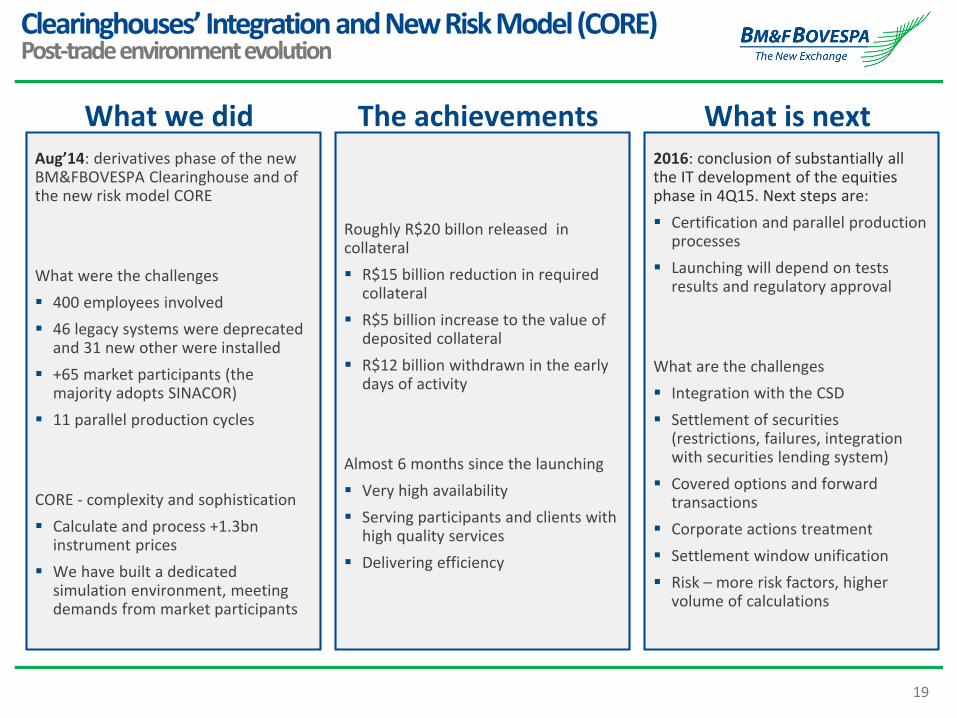
Clearinghouses’ Integration and New Risk Model (CORE)Post-trade environment evolution
What we didAug’14: derivatives phase of the new BM&FBOVESPA Clearinghouse and of the new risk model CORE
What were the challenges
400 employees involved
46 legacy systems were deprecated and 31 new other were installed
+65 market participants (the majority adopts SINACOR)
11 parallel production cycles
CORE - complexity and sophistication
Calculate and process +1.3bn instrument prices
We have built a dedicated simulation environment, meeting demands from market participants
What is next2016: conclusion of substantially all the IT development of the equities phase in 4Q15. Next steps are:
Certification and parallel production processes
Launching will depend on tests results and regulatory approval
What are the challenges
Integration with the CSD
Settlement of securities (restrictions, failures, integration with securities lending system)
Covered options and forward transactions
Corporate actions treatment
Settlement window unification
Risk – more risk factors, higher volume of calculations
The achievements
Roughly R$20 billon released in collateral
R$15 billion reduction in required collateral
R$5 billion increase to the value of deposited collateral
R$12 billion withdrawn in the early days of activity
Almost 6 months since the launching
Very high availability
Serving participants and clients with high quality services
Delivering efficiency
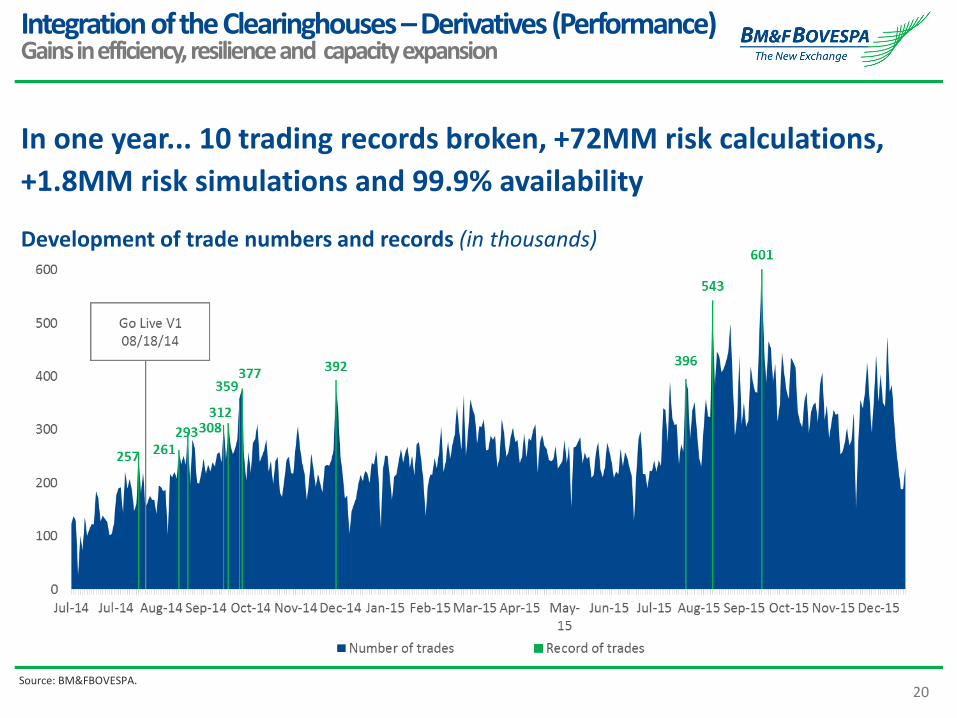
20
In one year... 10 trading records broken, +72MM risk calculations,
+1.8MM risk simulations and 99.9% availability
Integration of the Clearinghouses –Derivatives (Performance)Gains in efficiency, resilience and capacity expansion
Development of trade numbers and records (in thousands)
Source: BM&FBOVESPA.
21
REGULATION, HISTORY, BUSINESS MODEL AND CORPORATE GOVERNANCESafety, resilience and transparency
BRAZILIAN MARKET OPPORTUNITIESMain growth drivers
MAIN GROWTH INITIATIVESBuilding an State-of-the-art platform
OPERATIONAL PERFORMANCENotable global exchange
FINANCIAL HIGHLIGHTSCost discipline and capital return to shareholders
2Q16 RESULTS
APPENDIX
MAIN GROWTH INITIATIVESInvestments, new products and focus on the customer
22
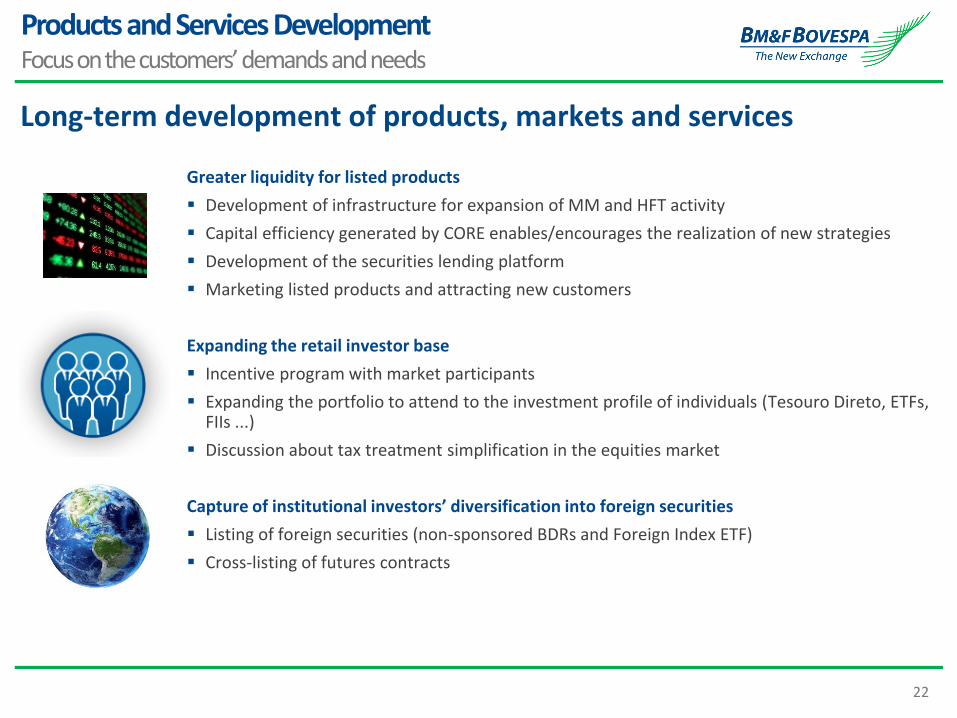
Long-term development of products, markets and services
Products and Services DevelopmentFocus on the customers’ demands and needs
Greater liquidity for listed products
Development of infrastructure for expansion of MM and HFT activity
Capital efficiency generated by CORE enables/encourages the realization of new strategies
Development of the securities lending platform
Marketing listed products and attracting new customers
Expanding the retail investor base
Incentive program with market participants
Expanding the portfolio to attend to the investment profile of individuals (Tesouro Direto, ETFs, FIIs ...)
Discussion about tax treatment simplification in the equities market
Capture of institutional investors’ diversification into foreign securities
Listing of foreign securities (non-sponsored BDRs and Foreign Index ETF)
Cross-listing of futures contracts
23
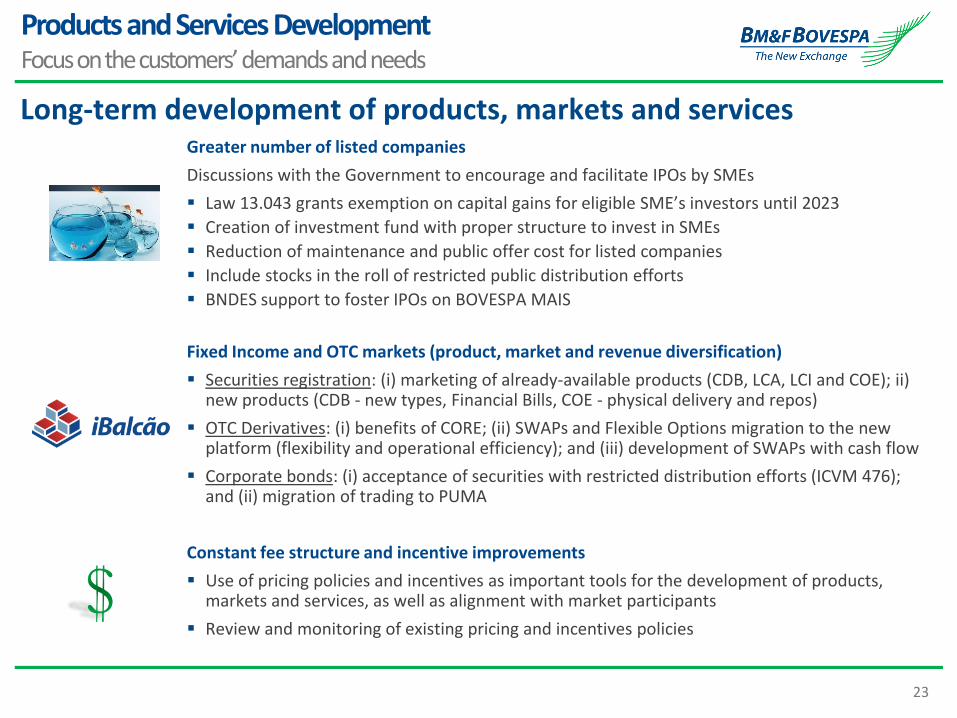
Long-term development of products, markets and services
Products and Services DevelopmentFocus on the customers’ demands and needs
Greater number of listed companies
Discussions with the Government to encourage and facilitate IPOs by SMEs
Law 13.043 grants exemption on capital gains for eligible SME’s investors until 2023
Creation of investment fund with proper structure to invest in SMEs
Reduction of maintenance and public offer cost for listed companies
Include stocks in the roll of restricted public distribution efforts
BNDES support to foster IPOs on BOVESPA MAIS
Fixed Income and OTC markets (product, market and revenue diversification)
Securities registration: (i) marketing of already-available products (CDB, LCA, LCI and COE); ii) new products (CDB - new types, Financial Bills, COE - physical delivery and repos)
OTC Derivatives: (i) benefits of CORE; (ii) SWAPs and Flexible Options migration to the new platform (flexibility and operational efficiency); and (iii) development of SWAPs with cash flow
Corporate bonds: (i) acceptance of securities with restricted distribution efforts (ICVM 476); and (ii) migration of trading to PUMA
Constant fee structure and incentive improvements
Use of pricing policies and incentives as important tools for the development of products, markets and services, as well as alignment with market participants
Review and monitoring of existing pricing and incentives policies
24
REGULATION, HISTORY, BUSINESS MODEL AND CORPORATE GOVERNANCESafety, resilience and transparency
BRAZILIAN MARKET OPPORTUNITIESMain growth drivers
MAIN GROWTH INITIATIVESBuilding an State-of-the-art platform
OPERATIONAL PERFORMANCENotable global exchange
FINANCIAL HIGHLIGHTSCost discipline and capital return to shareholders
2Q16 RESULTS
APPENDIX
MAIN GROWTH INITIATIVESInvestments, new products and focus on the customer
25
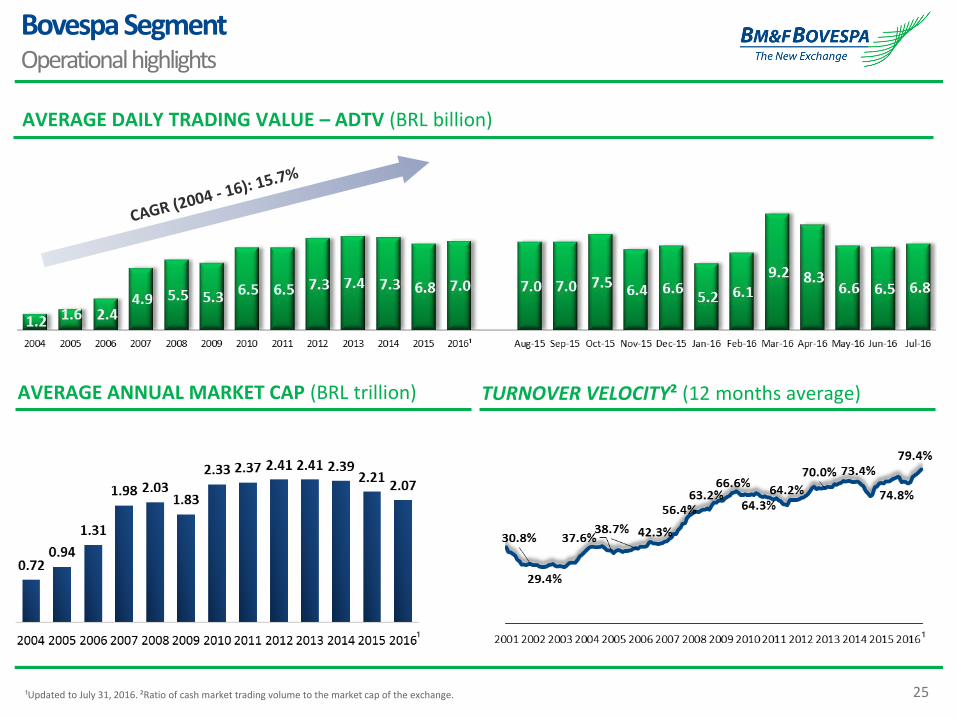
AVERAGE DAILY TRADING VALUE – ADTV (BRL billion)
AVERAGE ANNUAL MARKET CAP (BRL trillion) TURNOVER VELOCITY² (12 months average)
Bovespa SegmentOperational highlights
¹Updated to July 31, 2016. ²Ratio of cash market trading volume to the market cap of the exchange.
¹¹
26
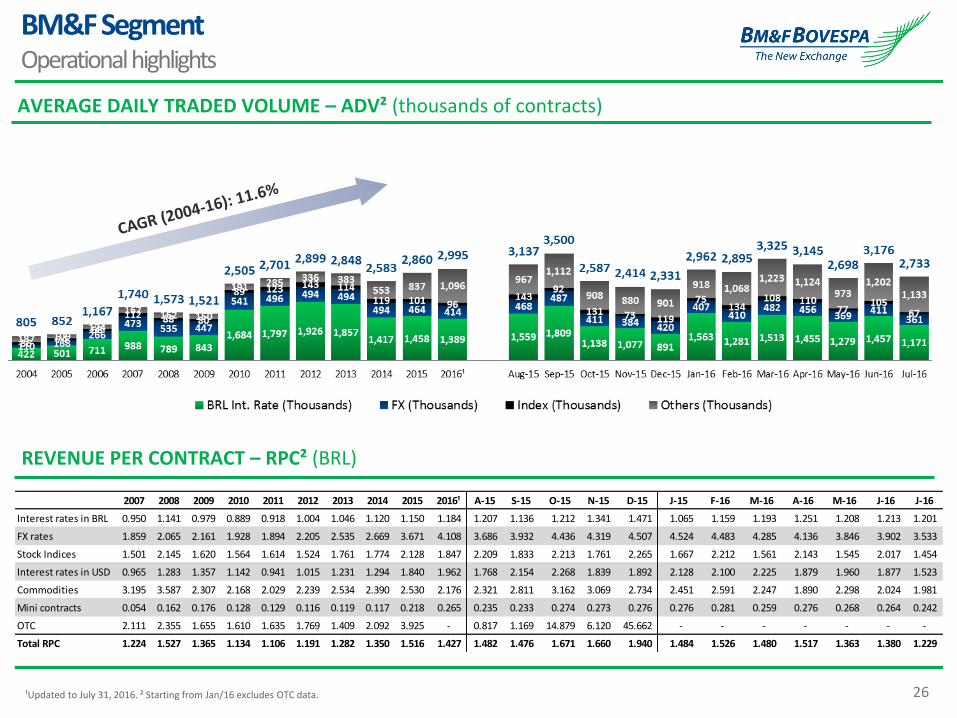
2007 2008 2009 2010 2011 2012 2013 2014 2015 2016¹ A-15 S-15 O-15 N-15 D-15 J-15 F-16 M-16 A-16 M-16 J-16 J-16
Interest rates in BRL 0.950 1.141 0.979 0.889 0.918 1.004 1.046 1.120 1.150 1.184 1.207 1.136 1.212 1.341 1.471 1.065 1.159 1.193 1.251 1.208 1.213 1.201
FX rates 1.859 2.065 2.161 1.928 1.894 2.205 2.535 2.669 3.671 4.108 3.686 3.932 4.436 4.319 4.507 4.524 4.483 4.285 4.136 3.846 3.902 3.533
Stock Indices 1.501 2.145 1.620 1.564 1.614 1.524 1.761 1.774 2.128 1.847 2.209 1.833 2.213 1.761 2.265 1.667 2.212 1.561 2.143 1.545 2.017 1.454
Interest rates in USD 0.965 1.283 1.357 1.142 0.941 1.015 1.231 1.294 1.840 1.962 1.768 2.154 2.268 1.839 1.892 2.128 2.100 2.225 1.879 1.960 1.877 1.523
Commodities 3.195 3.587 2.307 2.168 2.029 2.239 2.534 2.390 2.530 2.176 2.321 2.811 3.162 3.069 2.734 2.451 2.591 2.247 1.890 2.298 2.024 1.981
Mini contracts 0.054 0.162 0.176 0.128 0.129 0.116 0.119 0.117 0.218 0.265 0.235 0.233 0.274 0.273 0.276 0.276 0.281 0.259 0.276 0.268 0.264 0.242
OTC 2.111 2.355 1.655 1.610 1.635 1.769 1.409 2.092 3.925 - 0.817 1.169 14.879 6.120 45.662 - - - - - - -
Total RPC 1.224 1.527 1.365 1.134 1.106 1.191 1.282 1.350 1.516 1.427 1.482 1.476 1.671 1.660 1.940 1.484 1.526 1.480 1.517 1.363 1.380 1.229
BM&F Segment Operational highlights
AVERAGE DAILY TRADED VOLUME – ADV² (thousands of contracts)
REVENUE PER CONTRACT – RPC² (BRL)
¹Updated to July 31, 2016. ² Starting from Jan/16 excludes OTC data.
27
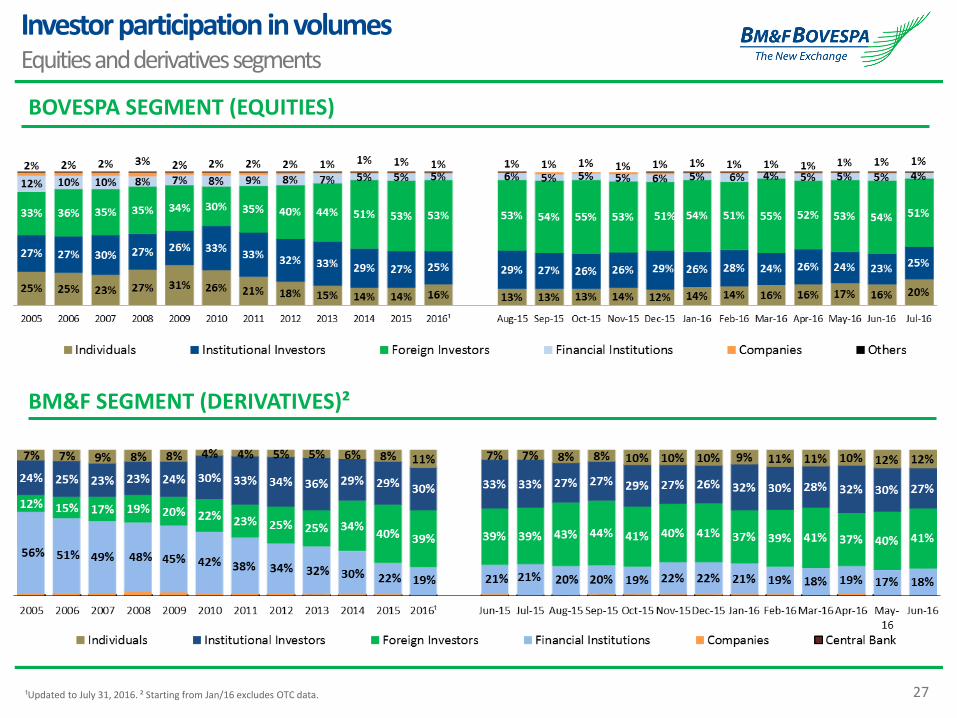
Investor participation in volumesEquities and derivatives segments
BM&F SEGMENT (DERIVATIVES)²
BOVESPA SEGMENT (EQUITIES)
¹Updated to July 31, 2016. ² Starting from Jan/16 excludes OTC data.
28
REGULATION, HISTORY, BUSINESS MODEL AND CORPORATE GOVERNANCESafety, resilience and transparency
BRAZILIAN MARKET OPPORTUNITIESMain growth drivers
MAIN GROWTH INITIATIVESBuilding an State-of-the-art platform
OPERATIONAL PERFORMANCENotable global exchange
FINANCIAL HIGHLIGHTSCost discipline and capital return to shareholders
2Q16 RESULTS
APPENDIX
MAIN GROWTH INITIATIVESInvestments, new products and focus on the customer
29
Income StatementHistory of income statement results (consolidated)
(in BRL thousand) 2009 2010 2011 2012 2013 2014 2015²
Net revenue 1,510,569 1,898,742 1,904,684 2,064,750 2,126,638 2,030,433 2,216,634
Expenses (569,832) (633,504) (816,664) (763,080) (790,814) (804,070) (850,656)
Adjusted expenses (446,677) (543,881) (584,521) (563,487) (575,763) (592,349) (614,350)
Operating income 940,737 1,265,238 1,088,020 1,301,670 1,335,824 1,226,363 1,365,978
Operating margin 62.3% 66.6% 57.1% 63.0% 62.8% 60.4% 61.6%
Equity method result - 38,238 219,461 149,270 171,365 212,160 136,245
Financial result 245,837 289,039 280,729 208,851 180,695 208,157 508,796
Income before taxation of profit 1,186,574 1,592,515 1,588,210 1,659,791 1,687,884 1,646,680 2,807,222
Income tax and social contribution (304,505) (448,029) (539,681) (585,535) (606,588) (660,959) (603,764)
Net income¹ 881,050 1,144,561 1,047,999 1,074,290 1,080,947 977,053 2,202,238
Adjusted net income 1,223,761 1,586,374 1,545,627 1,612,136 1,609,769 1,478,653 1,819,187
Adjusted EPS (BRL) 0.6104 0.7929 0.7932 0.8351 0.8389 0.8048 1.0152
¹Attributable to shareholders of BM&FBOVESPA.² Impacts of non-recurring items: (i) partial divestment in CME Group; (ii) discontinuity of the equity method of accounting; and (iii) impairment of Bovespa Holding
30
Focus on expenses control offset most of the inflationary adjustments over the past years
(in BRL million)
ADJUSTED EXPENSES BUDGET
INVESTMENTS BUDGET:
Adjusted¹ expenses and investment budgetFocus on cost control and investments phase
The CAPEX program initiated in 2010 renewed the Company's IT, operations and service platform
2015 vs. 2014: 3.72%IPCA 2015: 10.67%2
2016e vs. 2015: 6.61%4
IPCA (average) 2016e: 7.20%³
CAGR 2011-16e: 2.30%4
CAGR IPCA (average) 2011-15e: 7.19%³
Review of 2016 budget: from R$165 – 195 million to R$200 –230 million
FX exposure: 40%
Update of the timeline and budget of the Company’s main projects
(in BRL million)
¹ Expenses adjusted to Company´s depreciation, stock granting plan – principal and social charges -, stock options plan, tax on dividends from the CME Group, transfer of fines and provisions. ² IPCA for 2015 released by the Central Bank ³ IPCA for 2016 based on market expectations released by the Central Bank in Aug. 5, 2016; 4 Considers the mid point for 2016 budget
31
Expenses DisciplineDelivering efficiency through diligent expense management
1 IPCA last 12 months until Dec´15 (Source IBGE) 2 Includes personnel expenses and capitalization and excludes costs from stock grant plan – principal and payroll taxes – stock option and bonus expenses. 3 Calculated based on the annual wage increase for personnel expenditure and the accumulated IPCA for the other lines of expenses.
Adjusted expenses grew 3.7%, significantly below average inflation of 10.7%1, reflecting prioritization of activities, review of contracts and enhancement
of processesNominal Change
Real Change3
3.9% -3.8%
-1.8% -11.2%
3.2% -6.7%
-61.1%-57.0%
(in R$ millions)
-4.5%5.7%
Nominal Change
Real Change3
18.5% -11.5%
16.9% 1,8%
-20.8% -40.0%
-81.0%-75.0%
(in R$ millions)
-76.6%-69.1%
-11.5%
Tota
l P
ers
on
ne
l 2
Dat
a p
roce
ssin
gTh
ird
par
ty
serv
ices
Mar
keti
ng
Co
mm
un
icat
.
Tota
l P
ers
on
ne
l 2
Dat
a p
roce
ssin
gTh
ird
par
ty
serv
ices
Mar
keti
ng
Co
mm
un
icat
.
2015 vs. 2014 2015 vs. 2011
32
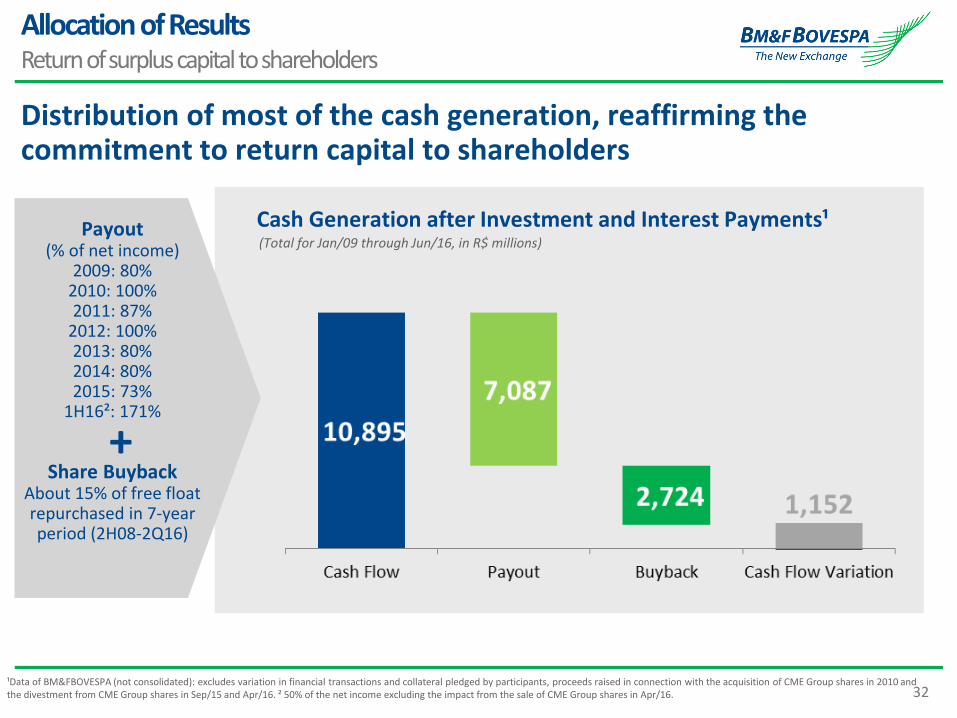
Distribution of most of the cash generation, reaffirming the commitment to return capital to shareholders
(Total for Jan/09 through Jun/16, in R$ millions)
Cash Generation after Investment and Interest Payments¹Payout(% of net income)
2009: 80%2010: 100%2011: 87%
2012: 100%2013: 80%2014: 80%2015: 73%
1H16²: 171%
Share BuybackAbout 15% of free floatrepurchased in 7-year period (2H08-2Q16)
+
Allocation of ResultsReturn of surplus capital to shareholders
¹Data of BM&FBOVESPA (not consolidated): excludes variation in financial transactions and collateral pledged by participants, proceeds raised in connection with the acquisition of CME Group shares in 2010 and the divestment from CME Group shares in Sep/15 and Apr/16. ² 50% of the net income excluding the impact from the sale of CME Group shares in Apr/16.
33
REGULATION, HISTORY, BUSINESS MODEL AND CORPORATE GOVERNANCESafety, resilience and transparency
BRAZILIAN MARKET OPPORTUNITIESMain growth drivers
MAIN GROWTH INITIATIVESBuilding an State-of-the-art platform
OPERATIONAL PERFORMANCENotable global exchange
FINANCIAL HIGHLIGHTSCost discipline and capital return to shareholders
2Q16 RESULTS
APPENDIX
MAIN GROWTH INITIATIVESInvestments, new products and focus on the customer
34
Total revenue: R$637.9 mn, +3.7%,
BM&F Seg.: R$272.3 mn, +5.5%
Bovespa Seg.: R$239.0 mn, -0.5%
Other revenues: R$126.6 mn, +8.1%
Adj. expenses1: R$146.7 mn, +3.5%
IFRS net income²: loss of R$114.4 mn
Excluding extraordinary items that impacted 2Q16, net income would have reached R$496.8 mn
Payout: R$215.6 mn (R$0.121 per share); equivalent to 50% of the 2Q16 net income excluding impacts from the divestment from CME Group shares³
Financial highlights2Q16 (vs. 2Q15)
BM&F Segment:
ADV: 3.0 mn contracts, +4.0%
RPC: R$1.420, -1.3%
Bovespa Segment:
ADTV: R$7.14 bn, +0.3%
Margin: 5.208 bps, -0.10 bps
Others high growth products:
Tesouro Direto: 87.5% increase in average assets under custody
ETFs: 32.4% increase in ADTV
Operating highlights2Q16 (vs. 2Q15)
2Q16 vs. 2Q15 highlights Bottom line impacted by extraordinary and mainly non-cash items
1 Adjusted to (i) depreciation and amortization; (ii) stock grant plan costs – principal and payroll taxes – and stock option plan; (iii) transaction cost and planning of the proposed business combination with Cetip that is still pending regulatory approval; and (iv) transfer of fines, provisions and incentive programs to market participants. ²Attributable to BM&FBOVESPA´s shareholders. ³ Excluding the impacts from the sale of CME Group share in Apr’16 (see Appendix – slide 16). 4 Depending on test results and regulatory approval.
Proposed business combination with CetipApproved by BM&FBOVESPA’s and Cetip’s shareholders in May´16
Pending regulatory approval: CVM, Central Bank and CADE (filed with CADE on June 28, 2016)
Equities phase of BM&FBOVESPA ClearinghouseIntegrated test and certification with market participants concluded
Beginning of the parallel production phase, deployment planned for 4Q164
LatAm ExchangesMinority investments: 10.4% in Chile; 9.9% in Colombia; and 4.1% in Mexico
Strategic updates
35
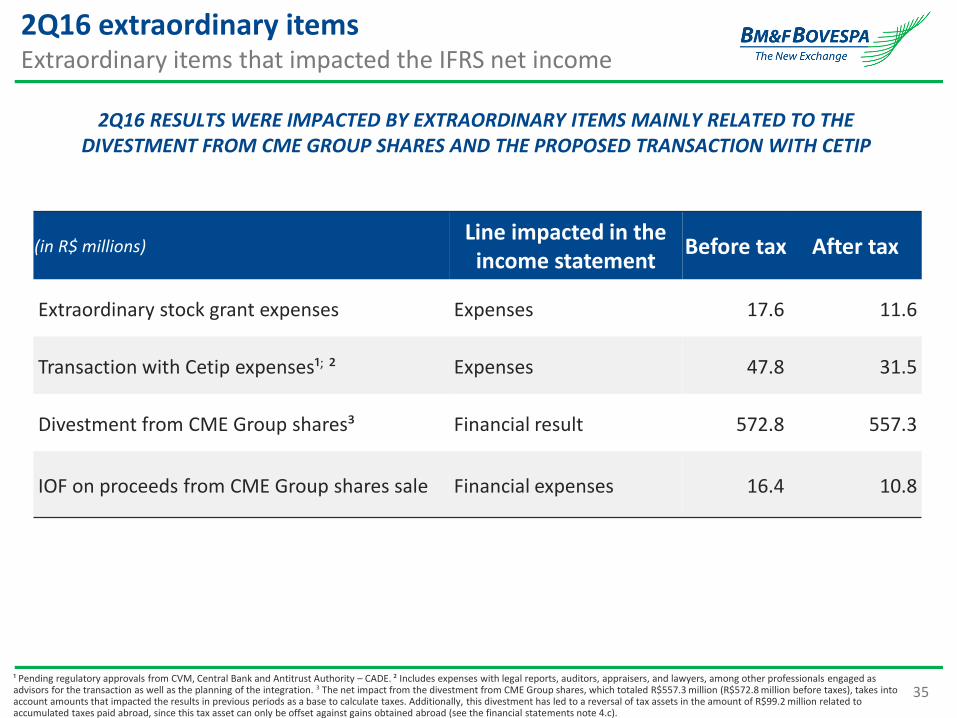
2Q16 extraordinary items Extraordinary items that impacted the IFRS net income
(in R$ millions)Line impacted in the
income statementBefore tax After tax
Extraordinary stock grant expenses Expenses 17.6 11.6
Transaction with Cetip expenses¹; ² Expenses 47.8 31.5
Divestment from CME Group shares³ Financial result 572.8 557.3
IOF on proceeds from CME Group shares sale Financial expenses 16.4 10.8
¹ Pending regulatory approvals from CVM, Central Bank and Antitrust Authority – CADE. ² Includes expenses with legal reports, auditors, appraisers, and lawyers, among other professionals engaged as advisors for the transaction as well as the planning of the integration. ³ The net impact from the divestment from CME Group shares, which totaled R$557.3 million (R$572.8 million before taxes), takes into account amounts that impacted the results in previous periods as a base to calculate taxes. Additionally, this divestment has led to a reversal of tax assets in the amount of R$99.2 million related to accumulated taxes paid abroad, since this tax asset can only be offset against gains obtained abroad (see the financial statements note 4.c).
2Q16 RESULTS WERE IMPACTED BY EXTRAORDINARY ITEMS MAINLY RELATED TO THE DIVESTMENT FROM CME GROUP SHARES AND THE PROPOSED TRANSACTION WITH CETIP
36
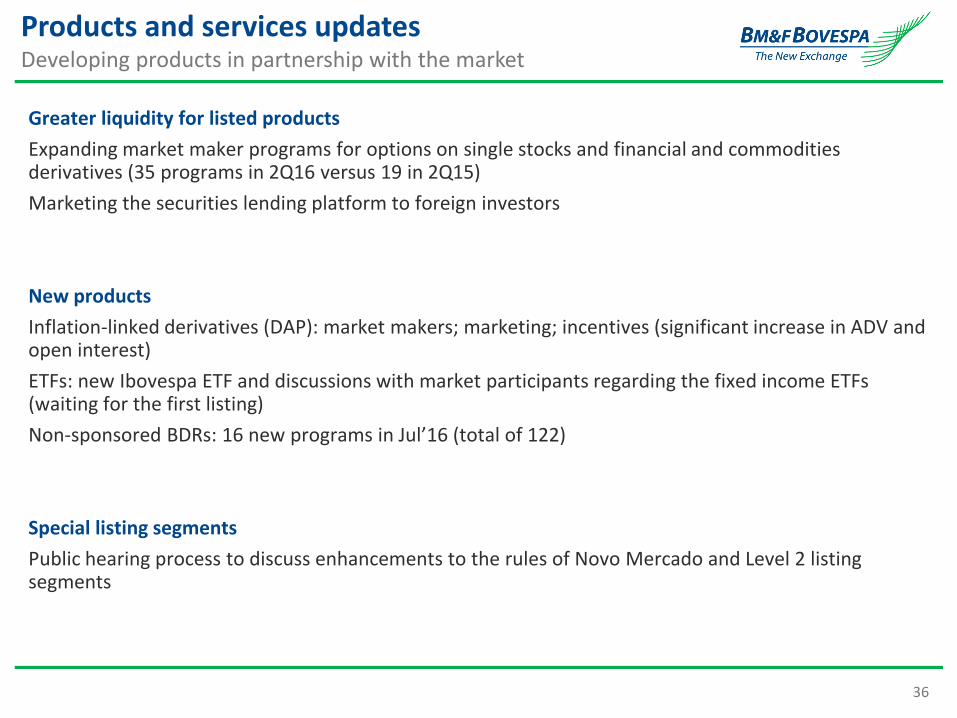
Products and services updatesDeveloping products in partnership with the market
Greater liquidity for listed products
Expanding market maker programs for options on single stocks and financial and commodities derivatives (35 programs in 2Q16 versus 19 in 2Q15)
Marketing the securities lending platform to foreign investors
New products
Inflation-linked derivatives (DAP): market makers; marketing; incentives (significant increase in ADV and open interest)
ETFs: new Ibovespa ETF and discussions with market participants regarding the fixed income ETFs (waiting for the first listing)
Non-sponsored BDRs: 16 new programs in Jul’16 (total of 122)
Special listing segments
Public hearing process to discuss enhancements to the rules of Novo Mercado and Level 2 listing segments
37
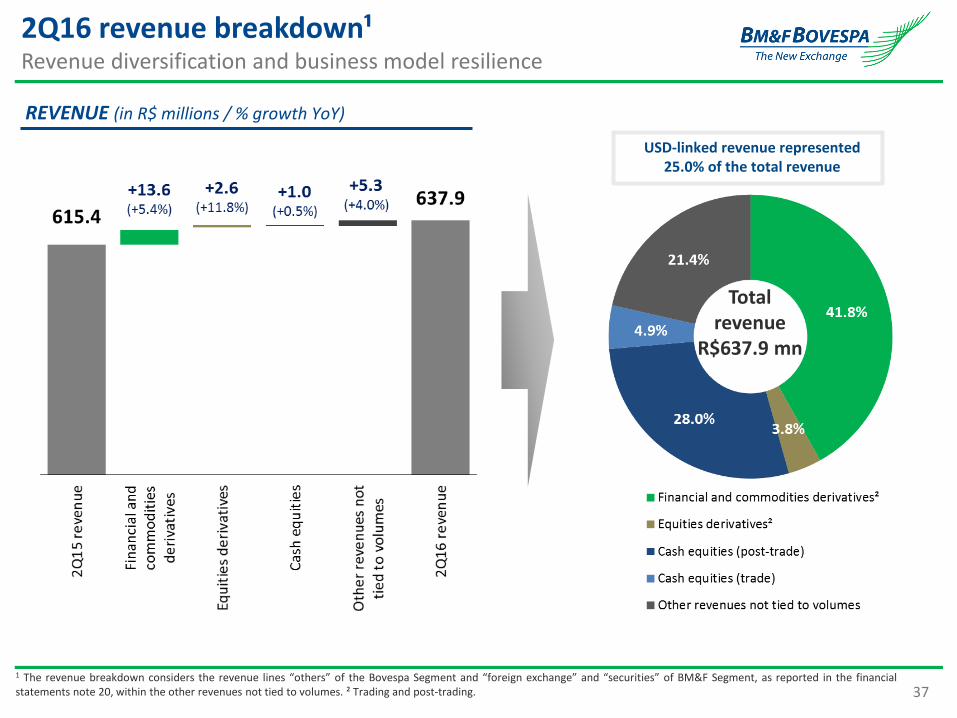
2Q16 revenue breakdown¹Revenue diversification and business model resilience
Total revenue
R$637.9 mn
1 The revenue breakdown considers the revenue lines “others” of the Bovespa Segment and “foreign exchange” and “securities” of BM&F Segment, as reported in the financialstatements note 20, within the other revenues not tied to volumes. ² Trading and post-trading.
USD-linked revenue represented 25.0% of the total revenue
REVENUE (in R$ millions / % growth YoY)
38
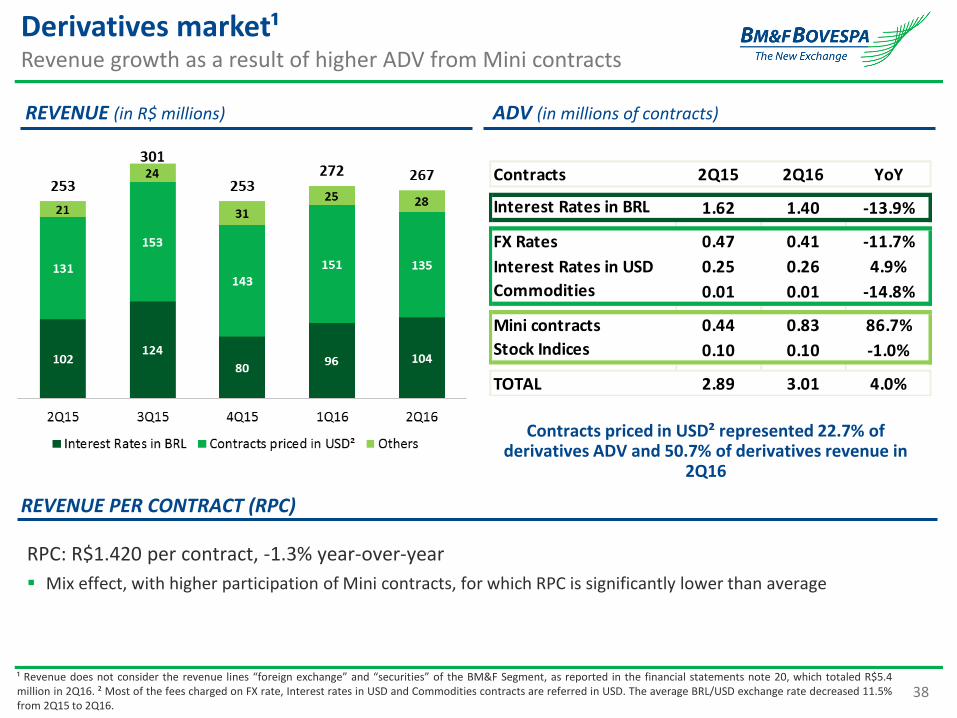
Contracts 2Q15 2Q16 YoY
Interest Rates in BRL 1.62 1.40 -13.9%
FX Rates 0.47 0.41 -11.7%
Interest Rates in USD 0.25 0.26 4.9%
Commodities 0.01 0.01 -14.8%
Mini contracts 0.44 0.83 86.7%
Stock Indices 0.10 0.10 -1.0%
TOTAL 2.89 3.01 4.0%
Derivatives market¹Revenue growth as a result of higher ADV from Mini contracts
REVENUE (in R$ millions)
Contracts priced in USD² represented 22.7% of derivatives ADV and 50.7% of derivatives revenue in
2Q16
¹ Revenue does not consider the revenue lines “foreign exchange” and “securities” of the BM&F Segment, as reported in the financial statements note 20, which totaled R$5.4million in 2Q16. ² Most of the fees charged on FX rate, Interest rates in USD and Commodities contracts are referred in USD. The average BRL/USD exchange rate decreased 11.5%from 2Q15 to 2Q16.
ADV (in millions of contracts)
RPC: R$1.420 per contract, -1.3% year-over-year
Mix effect, with higher participation of Mini contracts, for which RPC is significantly lower than average
REVENUE PER CONTRACT (RPC)
39
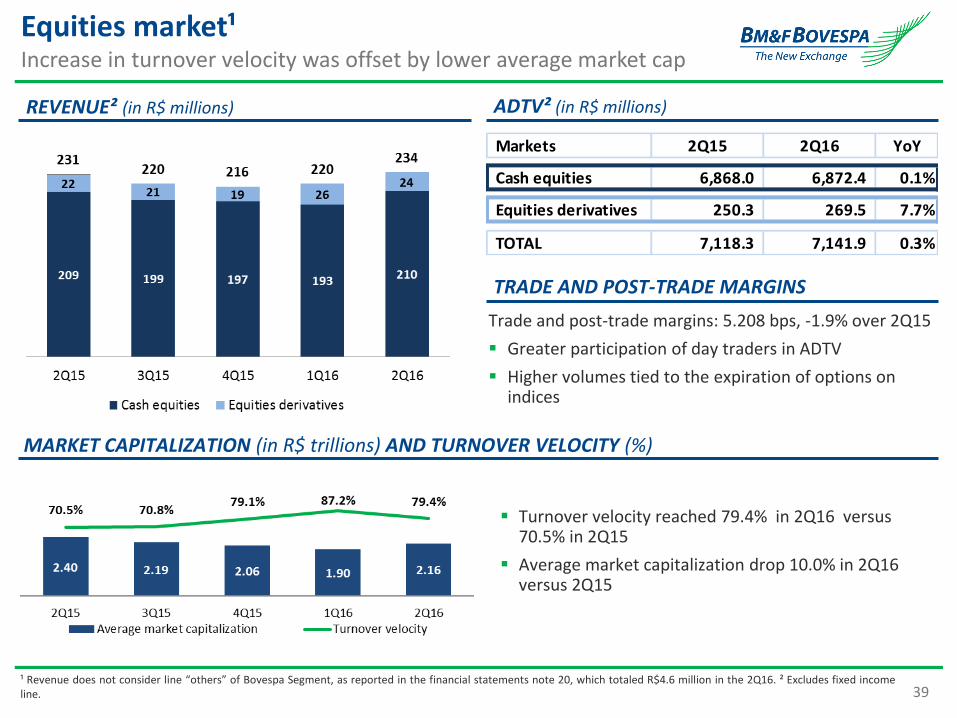
Markets 2Q15 2Q16 YoY
Cash equities 6,868.0 6,872.4 0.1%
Equities derivatives 250.3 269.5 7.7%
TOTAL 7,118.3 7,141.9 0.3%
REVENUE² (in R$ millions)
MARKET CAPITALIZATION (in R$ trillions) AND TURNOVER VELOCITY (%)
ADTV² (in R$ millions)
Turnover velocity reached 79.4% in 2Q16 versus 70.5% in 2Q15
Average market capitalization drop 10.0% in 2Q16 versus 2Q15
Trade and post-trade margins: 5.208 bps, -1.9% over 2Q15
Greater participation of day traders in ADTV
Higher volumes tied to the expiration of options on indices
Equities market¹Increase in turnover velocity was offset by lower average market cap
¹ Revenue does not consider line “others” of Bovespa Segment, as reported in the financial statements note 20, which totaled R$4.6 million in the 2Q16. ² Excludes fixed incomeline.
TRADE AND POST-TRADE MARGINS
40
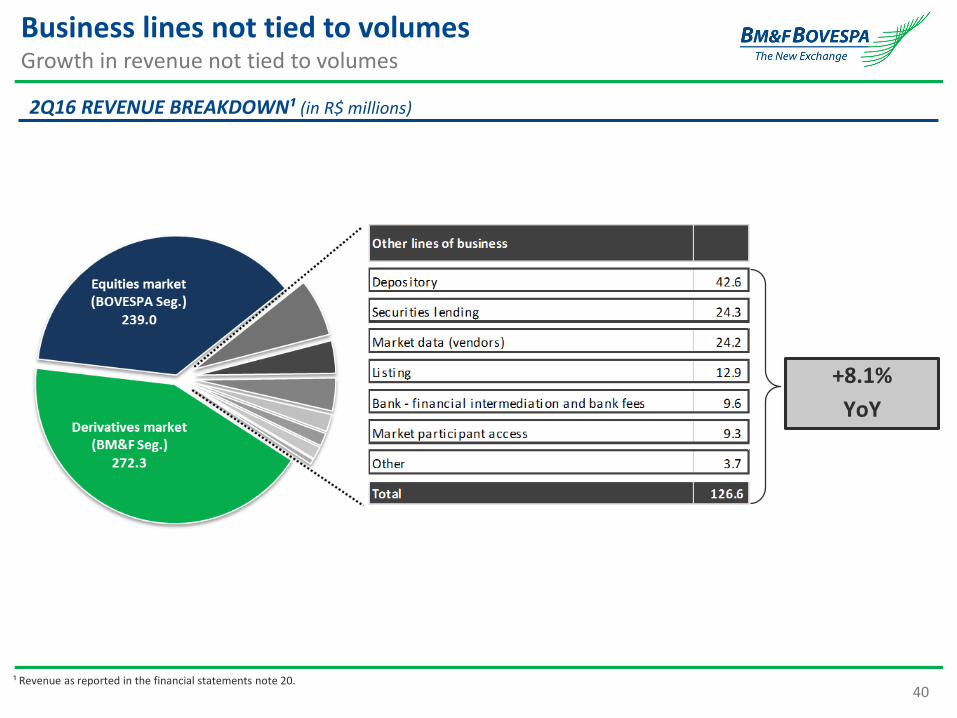
Business lines not tied to volumesGrowth in revenue not tied to volumes
2Q16 REVENUE BREAKDOWN¹ (in R$ millions)
¹ Revenue as reported in the financial statements note 20.
+8.1%
YoY
41
2Q15 81.1 (57%) 30.8 (22%) 9.9 (7%) 19.9 (14%)
2Q16 84.8 (58%) 34.3 (23%) 8.6 (6%) 19.0 (13%)
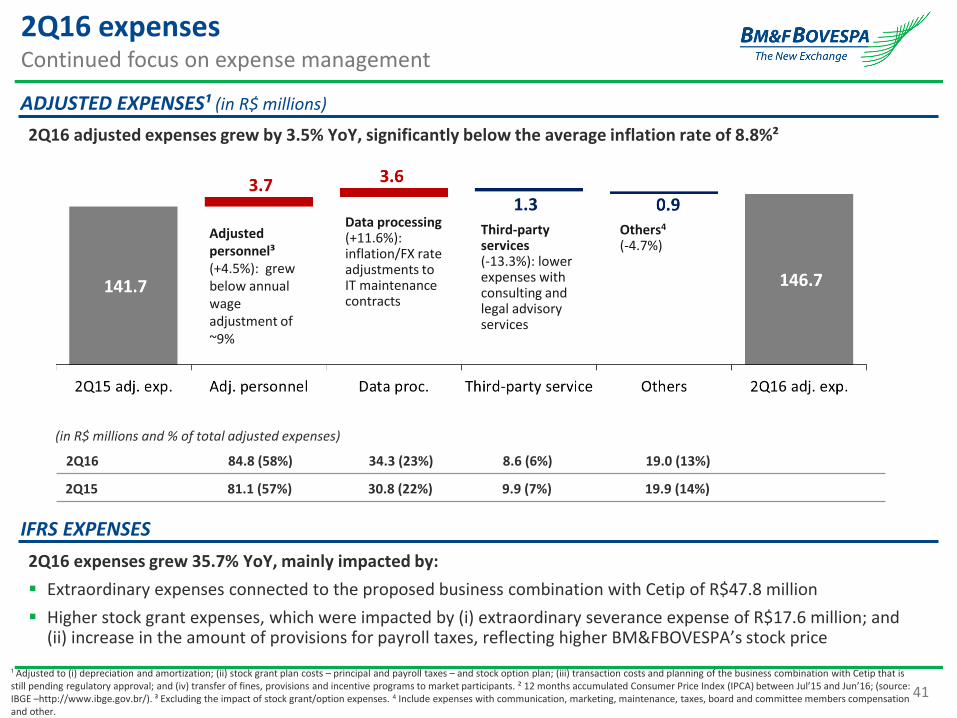
2Q16 expensesContinued focus on expense management
¹ Adjusted to (i) depreciation and amortization; (ii) stock grant plan costs – principal and payroll taxes – and stock option plan; (iii) transaction costs and planning of the business combination with Cetip that is still pending regulatory approval; and (iv) transfer of fines, provisions and incentive programs to market participants. ² 12 months accumulated Consumer Price Index (IPCA) between Jul’15 and Jun’16; (source: IBGE –http://www.ibge.gov.br/). ³ Excluding the impact of stock grant/option expenses. 4 Include expenses with communication, marketing, maintenance, taxes, board and committee members compensation and other.
Others4
(-4.7%)
(in R$ millions and % of total adjusted expenses)
Third-party services (-13.3%): lower expenses with consulting and legal advisory services
Adjusted personnel³(+4.5%): grewbelow annualwageadjustment of~9%
Data processing (+11.6%): inflation/FX rate adjustments to IT maintenance contracts
ADJUSTED EXPENSES¹ (in R$ millions)
IFRS EXPENSES
2Q16 expenses grew 35.7% YoY, mainly impacted by:
Extraordinary expenses connected to the proposed business combination with Cetip of R$47.8 million
Higher stock grant expenses, which were impacted by (i) extraordinary severance expense of R$17.6 million; and (ii) increase in the amount of provisions for payroll taxes, reflecting higher BM&FBOVESPA’s stock price
2Q16 adjusted expenses grew by 3.5% YoY, significantly below the average inflation rate of 8.8%²
42
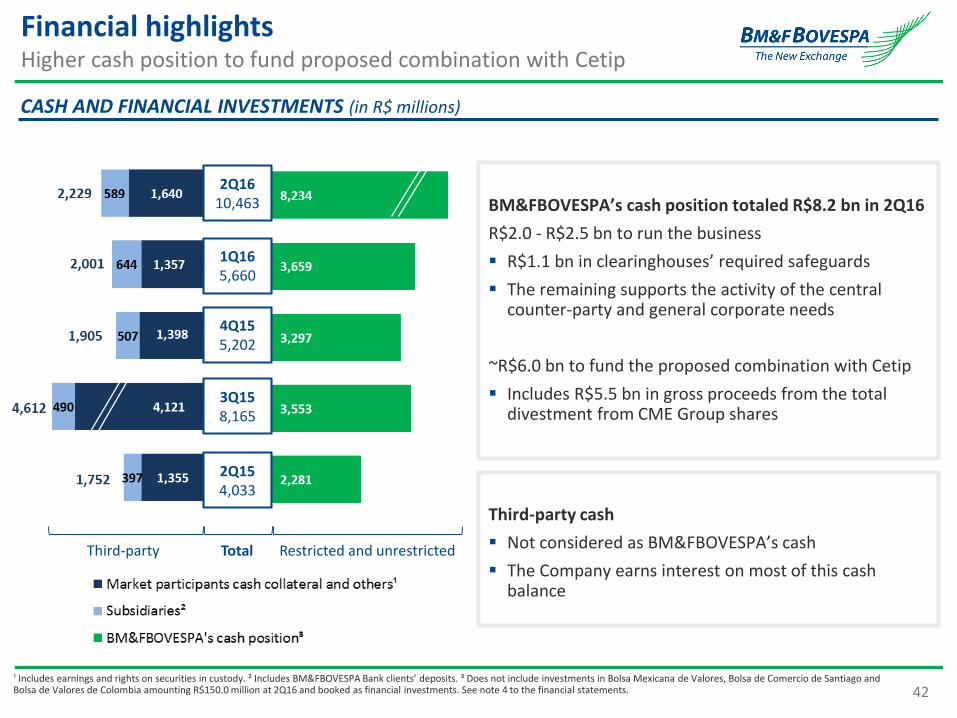
Financial highlightsHigher cash position to fund proposed combination with Cetip
3Q158,165
2Q154,033
CASH AND FINANCIAL INVESTMENTS (in R$ millions)
4Q155,202
2Q1610,463
1Q165,660
Third-party Restricted and unrestrictedTotal
¹ Includes earnings and rights on securities in custody. ² Includes BM&FBOVESPA Bank clients’ deposits. ³ Does not include investments in Bolsa Mexicana de Valores, Bolsa de Comercio de Santiago and Bolsa de Valores de Colombia amounting R$150.0 million at 2Q16 and booked as financial investments. See note 4 to the financial statements.
BM&FBOVESPA’s cash position totaled R$8.2 bn in 2Q16
R$2.0 - R$2.5 bn to run the business
R$1.1 bn in clearinghouses’ required safeguards
The remaining supports the activity of the central counter-party and general corporate needs
~R$6.0 bn to fund the proposed combination with Cetip
Includes R$5.5 bn in gross proceeds from the total divestment from CME Group shares
Third-party cash
Not considered as BM&FBOVESPA’s cash
The Company earns interest on most of this cash balance
43
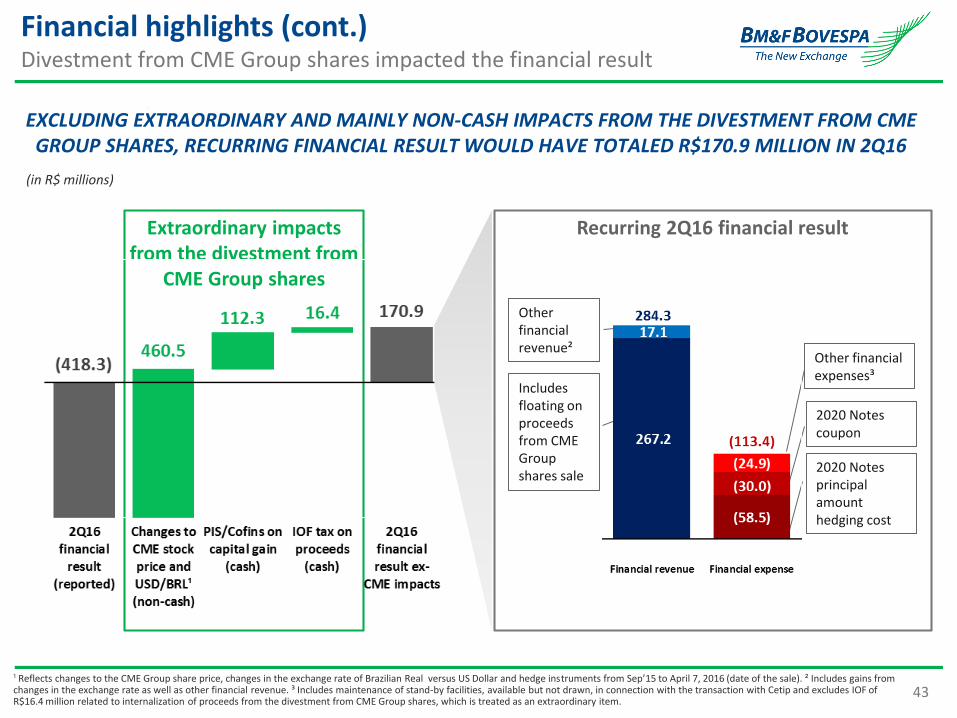
Recurring 2Q16 financial result
Financial highlights (cont.)Divestment from CME Group shares impacted the financial result
EXCLUDING EXTRAORDINARY AND MAINLY NON-CASH IMPACTS FROM THE DIVESTMENT FROM CME GROUP SHARES, RECURRING FINANCIAL RESULT WOULD HAVE TOTALED R$170.9 MILLION IN 2Q16
(in R$ millions)
¹ Reflects changes to the CME Group share price, changes in the exchange rate of Brazilian Real versus US Dollar and hedge instruments from Sep’15 to April 7, 2016 (date of the sale). ² Includes gains from changes in the exchange rate as well as other financial revenue. ³ Includes maintenance of stand-by facilities, available but not drawn, in connection with the transaction with Cetip and excludes IOF of R$16.4 million related to internalization of proceeds from the divestment from CME Group shares, which is treated as an extraordinary item.
Extraordinary impacts from the divestment from
CME Group shares
2020 Notes principal amount hedging cost
Includes floating on proceeds from CME Group shares sale
2020 Notes coupon
Other financial expenses³
Other financial revenue²
44
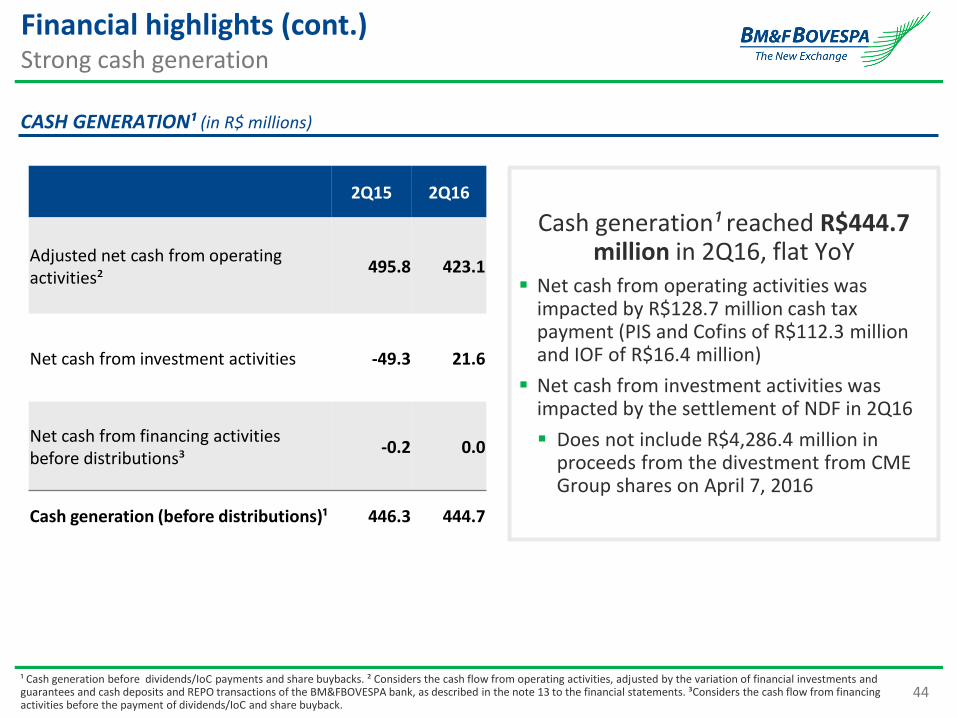
Financial highlights (cont.)Strong cash generation
CASH GENERATION¹ (in R$ millions)
2Q15 2Q16
Adjusted net cash from operating activities²
495.8 423.1
Net cash from investment activities -49.3 21.6
Net cash from financing activities before distributions³
-0.2 0.0
Cash generation (before distributions)¹ 446.3 444.7
¹ Cash generation before dividends/IoC payments and share buybacks. ² Considers the cash flow from operating activities, adjusted by the variation of financial investments and guarantees and cash deposits and REPO transactions of the BM&FBOVESPA bank, as described in the note 13 to the financial statements. ³Considers the cash flow from financing activities before the payment of dividends/IoC and share buyback.
Cash generation¹ reached R$444.7 million in 2Q16, flat YoY
Net cash from operating activities was impacted by R$128.7 million cash tax payment (PIS and Cofins of R$112.3 million and IOF of R$16.4 million)
Net cash from investment activities was impacted by the settlement of NDF in 2Q16
Does not include R$4,286.4 million in proceeds from the divestment from CME Group shares on April 7, 2016
45
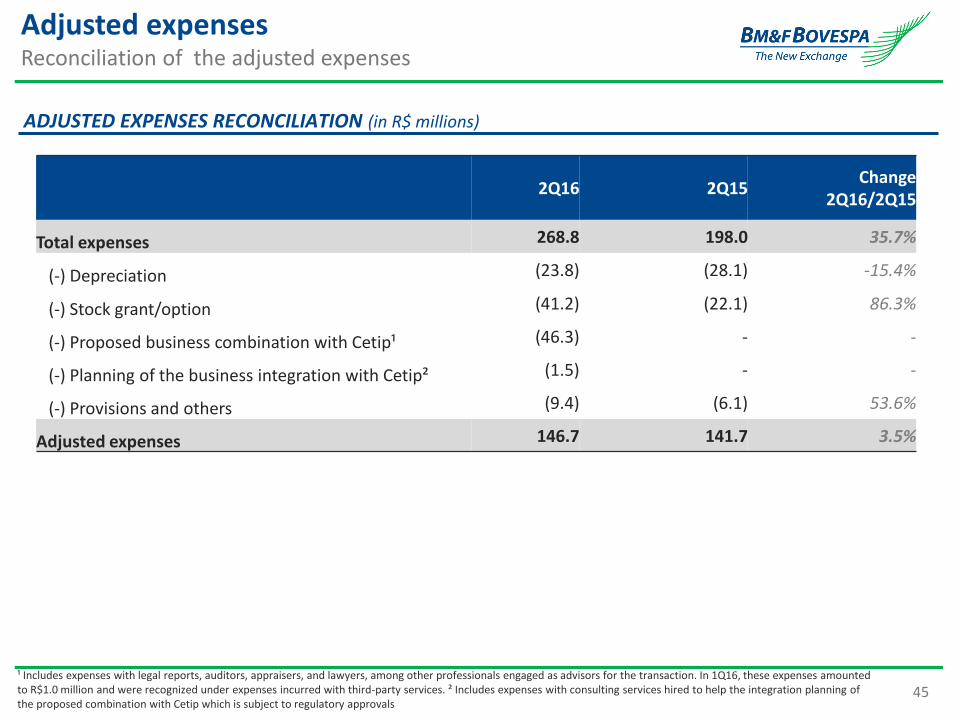
Adjusted expensesReconciliation of the adjusted expenses
ADJUSTED EXPENSES RECONCILIATION (in R$ millions)
2Q16 2Q15Change
2Q16/2Q15
Total expenses 268.8 198.0 35.7%
(-) Depreciation (23.8) (28.1) -15.4%
(-) Stock grant/option (41.2) (22.1) 86.3%
(-) Proposed business combination with Cetip¹ (46.3) - -
(-) Planning of the business integration with Cetip² (1.5) - -
(-) Provisions and others (9.4) (6.1) 53.6%
Adjusted expenses 146.7 141.7 3.5%
¹ Includes expenses with legal reports, auditors, appraisers, and lawyers, among other professionals engaged as advisors for the transaction. In 1Q16, these expenses amounted to R$1.0 million and were recognized under expenses incurred with third-party services. ² Includes expenses with consulting services hired to help the integration planning of the proposed combination with Cetip which is subject to regulatory approvals
46
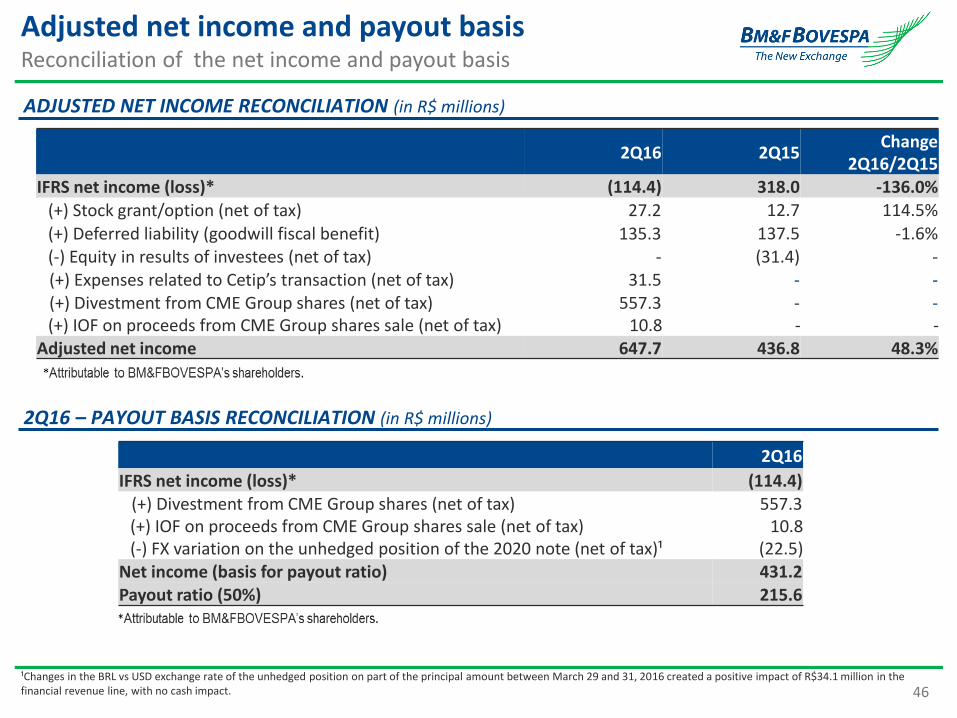
Adjusted net income and payout basisReconciliation of the net income and payout basis
ADJUSTED NET INCOME RECONCILIATION (in R$ millions)
2Q16 2Q15Change
2Q16/2Q15IFRS net income (loss)* (114.4) 318.0 -136.0%
(+) Stock grant/option (net of tax) 27.2 12.7 114.5%
(+) Deferred liability (goodwill fiscal benefit) 135.3 137.5 -1.6%(-) Equity in results of investees (net of tax) - (31.4) -(+) Expenses related to Cetip’s transaction (net of tax) 31.5 - -(+) Divestment from CME Group shares (net of tax) 557.3 - -(+) IOF on proceeds from CME Group shares sale (net of tax) 10.8 - -
Adjusted net income 647.7 436.8 48.3%
2Q16 – PAYOUT BASIS RECONCILIATION (in R$ millions)
2Q16
IFRS net income (loss)* (114.4)(+) Divestment from CME Group shares (net of tax) 557.3(+) IOF on proceeds from CME Group shares sale (net of tax) 10.8(-) FX variation on the unhedged position of the 2020 note (net of tax)¹ (22.5)
Net income (basis for payout ratio) 431.2Payout ratio (50%) 215.6
¹Changes in the BRL vs USD exchange rate of the unhedged position on part of the principal amount between March 29 and 31, 2016 created a positive impact of R$34.1 million in the financial revenue line, with no cash impact.
47
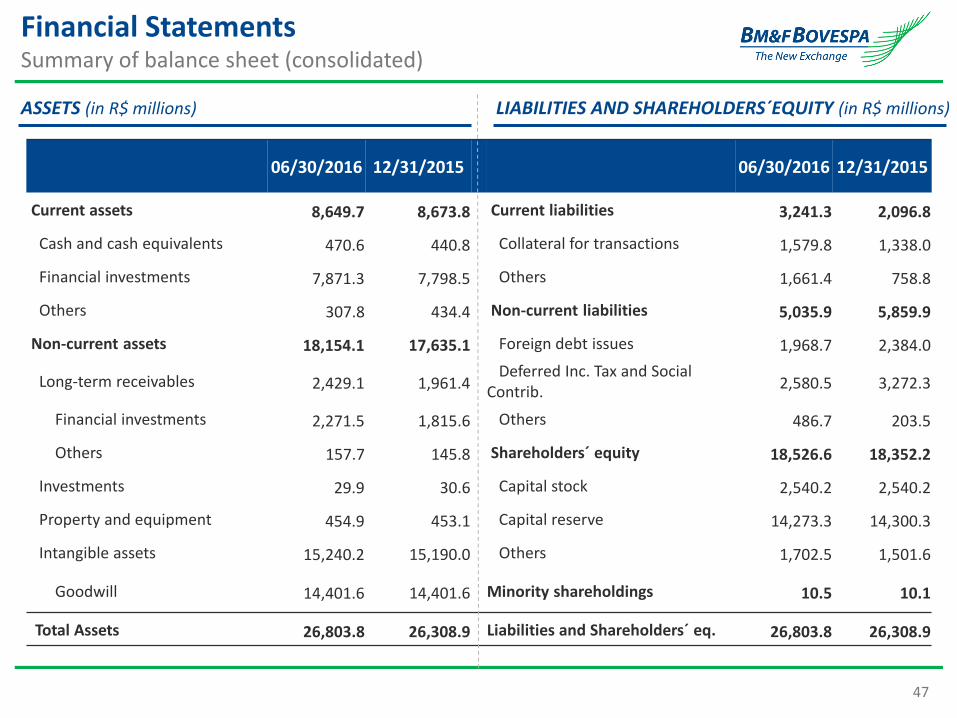
Financial Statements Summary of balance sheet (consolidated)
06/30/2016 12/31/2015 06/30/2016 12/31/2015
Current assets 8,649.7 8,673.8 Current liabilities 3,241.3 2,096.8
Cash and cash equivalents 470.6 440.8 Collateral for transactions 1,579.8 1,338.0
Financial investments 7,871.3 7,798.5 Others 1,661.4 758.8
Others 307.8 434.4 Non-current liabilities 5,035.9 5,859.9
Non-current assets 18,154.1 17,635.1 Foreign debt issues 1,968.7 2,384.0
Long-term receivables 2,429.1 1,961.4Deferred Inc. Tax and Social
Contrib. 2,580.5 3,272.3
Financial investments 2,271.5 1,815.6 Others 486.7 203.5
Others 157.7 145.8 Shareholders´ equity 18,526.6 18,352.2
Investments 29.9 30.6 Capital stock 2,540.2 2,540.2
Property and equipment 454.9 453.1 Capital reserve 14,273.3 14,300.3
Intangible assets 15,240.2 15,190.0 Others 1,702.5 1,501.6
Goodwill 14,401.6 14,401.6 Minority shareholdings 10.5 10.1
Total Assets 26,803.8 26,308.9 Liabilities and Shareholders´ eq. 26,803.8 26,308.9
LIABILITIES AND SHAREHOLDERS´EQUITY (in R$ millions)ASSETS (in R$ millions)
48
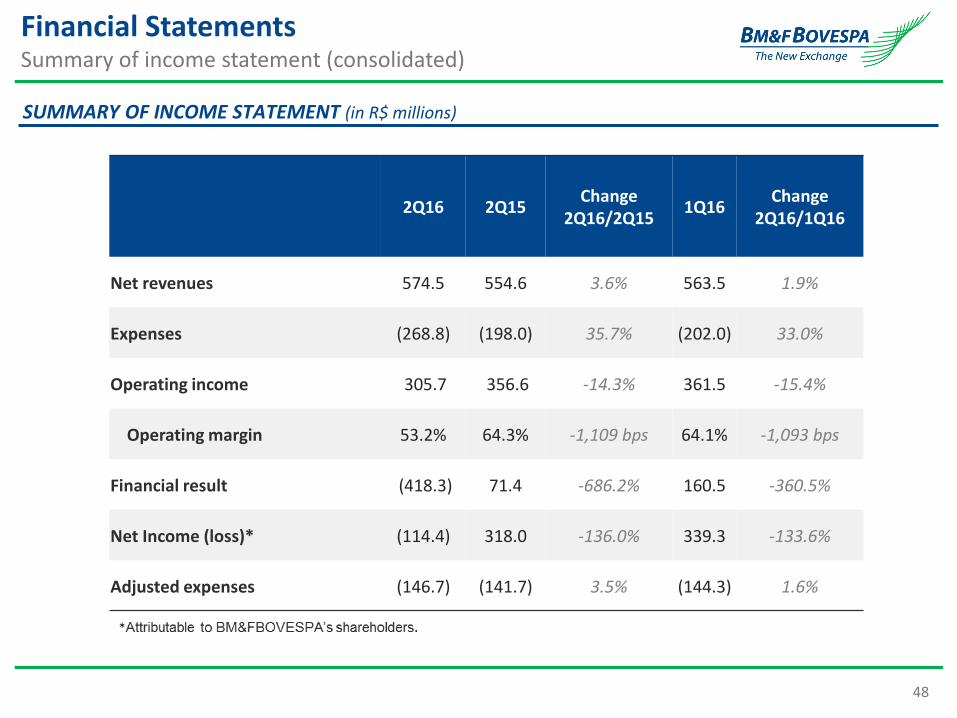
SUMMARY OF INCOME STATEMENT (in R$ millions)
Financial Statements Summary of income statement (consolidated)
2Q16 2Q15Change
2Q16/2Q151Q16
Change2Q16/1Q16
Net revenues 574.5 554.6 3.6% 563.5 1.9%
Expenses (268.8) (198.0) 35.7% (202.0) 33.0%
Operating income 305.7 356.6 -14.3% 361.5 -15.4%
Operating margin 53.2% 64.3% -1,109 bps 64.1% -1,093 bps
Financial result (418.3) 71.4 -686.2% 160.5 -360.5%
Net Income (loss)* (114.4) 318.0 -136.0% 339.3 -133.6%
Adjusted expenses (146.7) (141.7) 3.5% (144.3) 1.6%
49
REGULATION, HISTORY, BUSINESS MODEL AND CORPORATE GOVERNANCESafety, resilience and transparency
BRAZILIAN MARKET OPPORTUNITIESMain growth drivers
MAIN GROWTH INITIATIVESBuilding an State-of-the-art platform
OPERATIONAL PERFORMANCENotable global exchange
FINANCIAL HIGHLIGHTSCost discipline and capital return to shareholders
2Q16 RESULTS
APPENDIX
MAIN GROWTH INITIATIVESInvestments, new products and focus on the customer
50
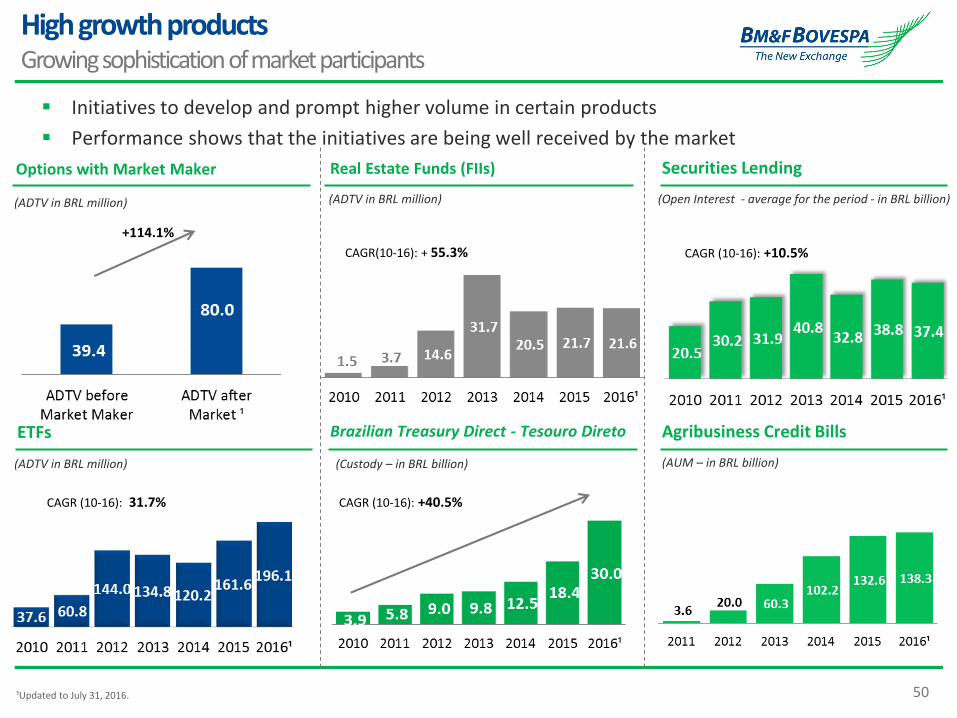
High growth productsGrowing sophistication of market participants
Securities LendingReal Estate Funds (FIIs) Options with Market Maker
(Open Interest - average for the period - in BRL billion)
Initiatives to develop and prompt higher volume in certain products
Performance shows that the initiatives are being well received by the market
ETFs Brazilian Treasury Direct - Tesouro Direto Agribusiness Credit Bills
(ADTV in BRL million)
+114.1%
(ADTV in BRL million)
(ADTV in BRL million) (Custody – in BRL billion)
CAGR(10-16): + 55.3% CAGR (10-16): +10.5%
CAGR (10-16): 31.7% CAGR (10-16): +40.5%
(AUM – in BRL billion)
¹Updated to July 31, 2016.
51
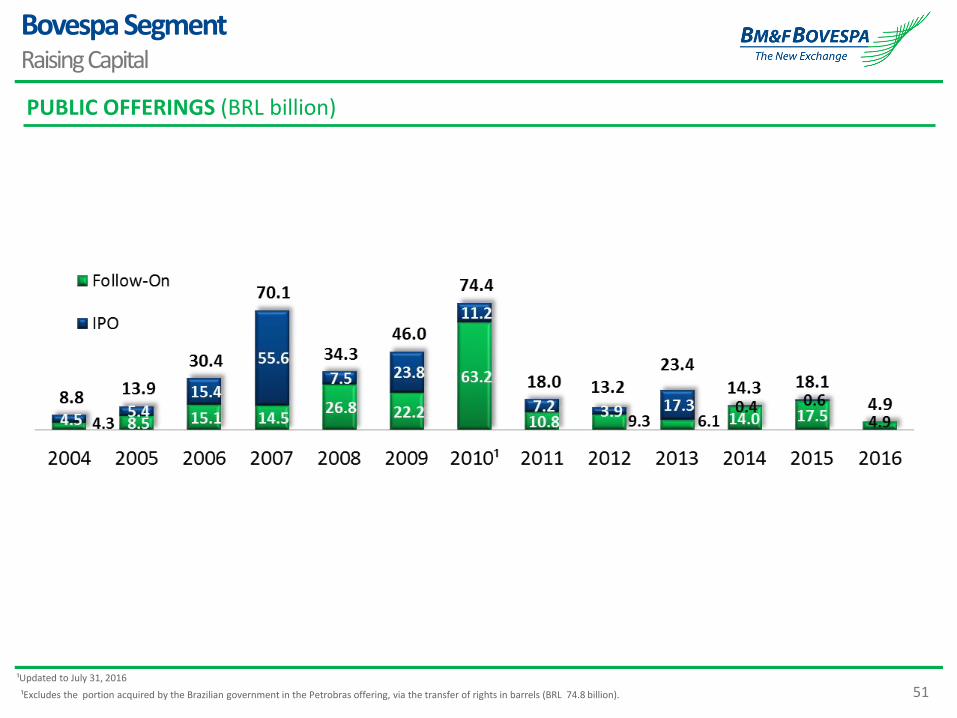
Bovespa SegmentRaising Capital
PUBLIC OFFERINGS (BRL billion)
¹Excludes the portion acquired by the Brazilian government in the Petrobras offering, via the transfer of rights in barrels (BRL 74.8 billion).
¹Updated to July 31, 2016
52
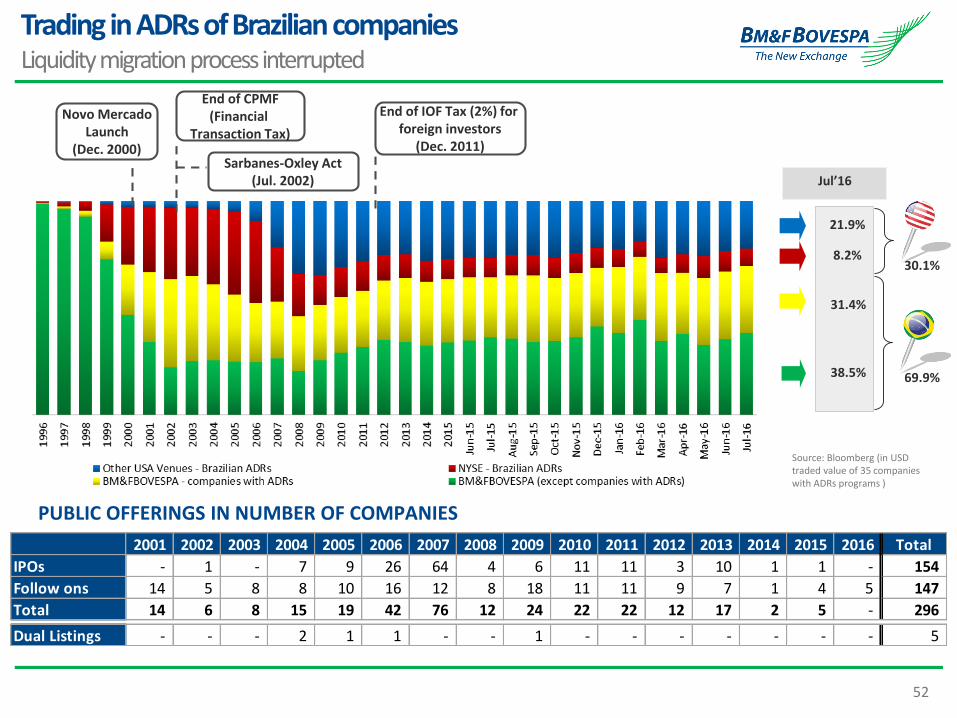
2001 2002 2003 2004 2005 2006 2007 2008 2009 2010 2011 2012 2013 2014 2015 2016 Total
IPOs - 1 - 7 9 26 64 4 6 11 11 3 10 1 1 - 154
Follow ons 14 5 8 8 10 16 12 8 18 11 11 9 7 1 4 5 147
Total 14 6 8 15 19 42 76 12 24 22 22 12 17 2 5 - 296
Dual Listings - - - 2 1 1 - - 1 - - - - - - - 5
Sarbanes-Oxley Act(Jul. 2002)
Novo MercadoLaunch
(Dec. 2000)
End of IOF Tax (2%) for foreign investors
(Dec. 2011)
End of CPMF(Financial
Transaction Tax)
Trading in ADRs of Brazilian companiesLiquidity migration process interrupted
Jul’16
Source: Bloomberg (in USD traded value of 35 companies with ADRs programs )
PUBLIC OFFERINGS IN NUMBER OF COMPANIES
38.5%
31.4%
8.2%
21.9%
30.1%
69.9%
53
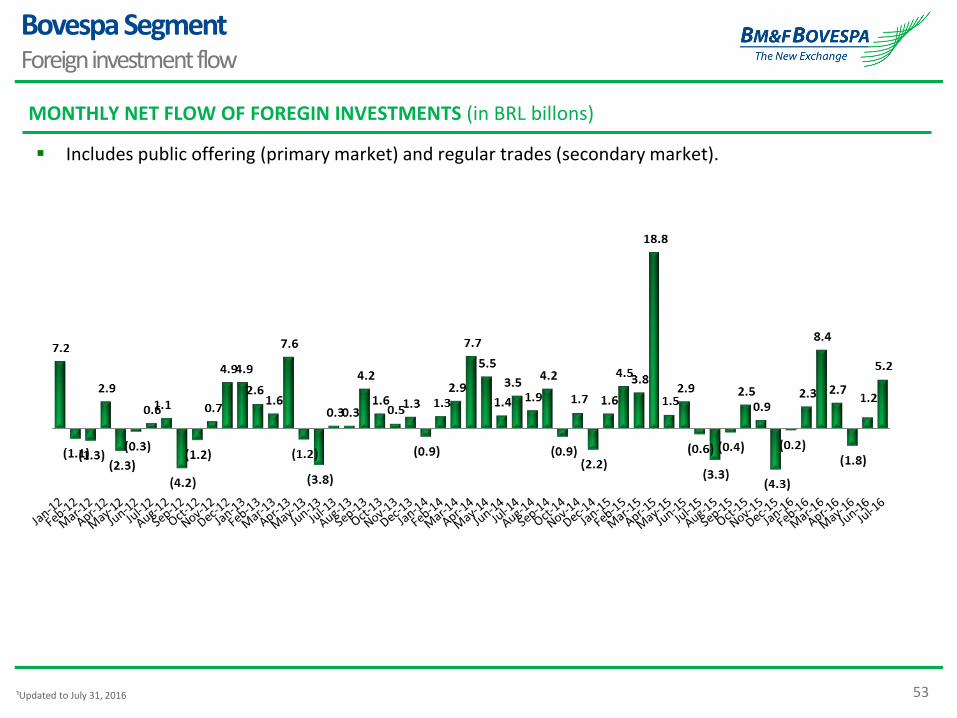
Bovespa SegmentForeign investment flow
MONTHLY NET FLOW OF FOREGIN INVESTMENTS (in BRL billons)
Includes public offering (primary market) and regular trades (secondary market).
¹Updated to July 31, 2016
54
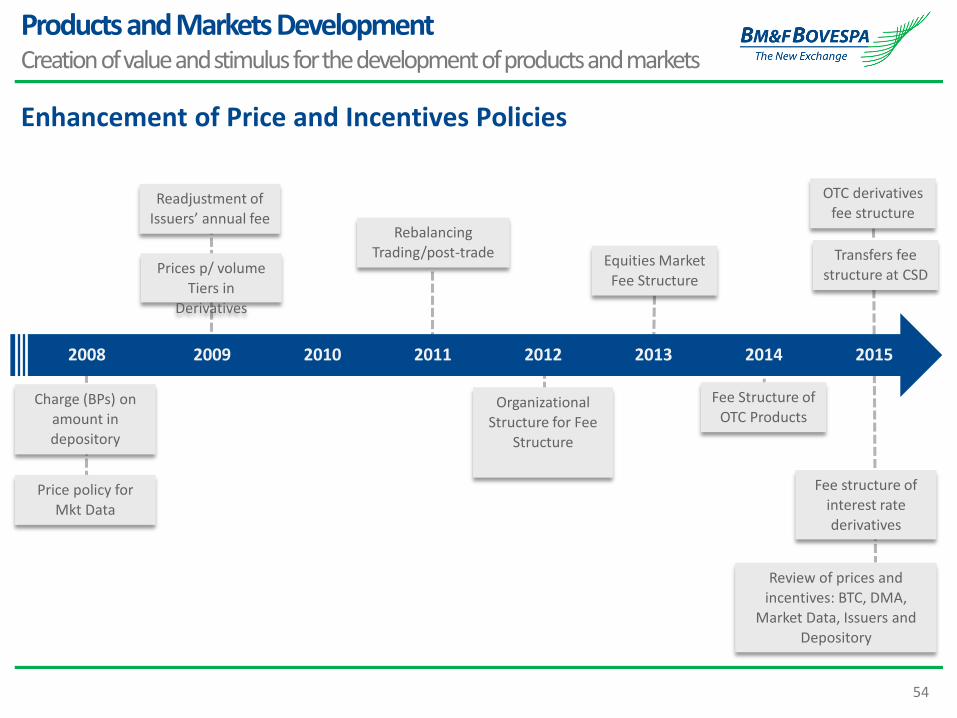
Products and Markets DevelopmentCreation of value and stimulus for the development of products and markets
Organizational Structure for Fee
Structure
Equities Market Fee Structure
Rebalancing Trading/post-trade
Fee Structure of OTC Products
Prices p/ volume
Tiers in Derivatives
Price policy for
Mkt Data
Readjustment of Issuers’ annual fee
Review of prices and
incentives: BTC, DMA, Market Data, Issuers and
Depository
Fee structure of interest rate derivatives
OTC derivatives fee structure
Transfers fee structure at CSD
2008 2009 2010 2011 2012 2013 2014 2015
Charge (BPs) onamount in depository
Enhancement of Price and Incentives Policies
55
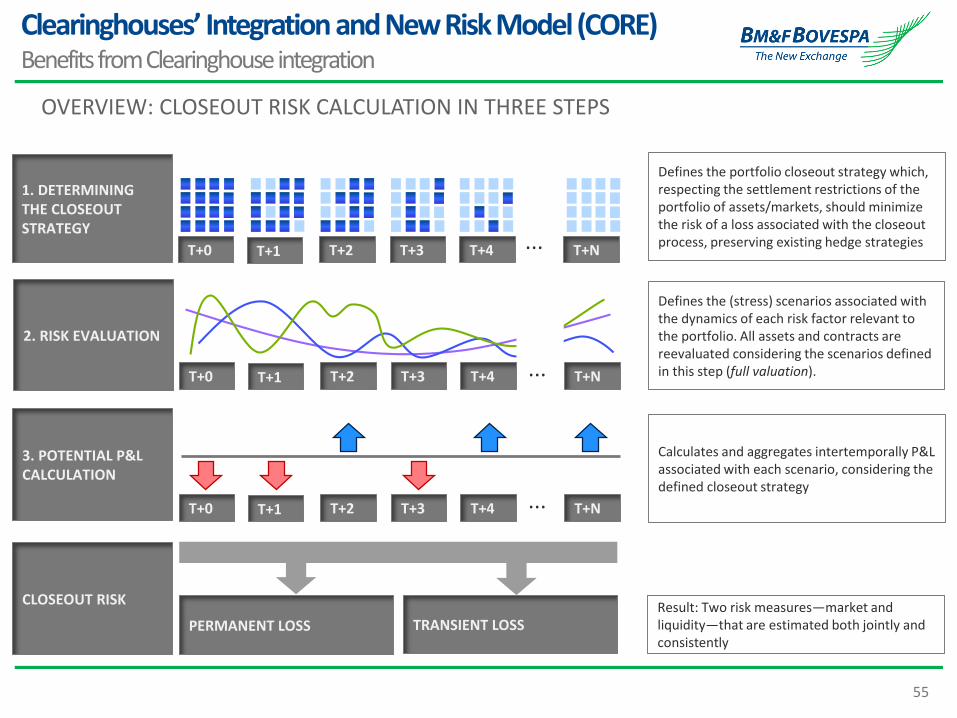
Clearinghouses’ Integration and New Risk Model (CORE)Benefits from Clearinghouse integration
1. DETERMINING THE CLOSEOUT STRATEGY
T+0 T+1 T+2 T+3 T+4 T+N...
Defines the portfolio closeout strategy which, respecting the settlement restrictions of the portfolio of assets/markets, should minimize the risk of a loss associated with the closeout process, preserving existing hedge strategies
2. RISK EVALUATION
T+0 T+1 T+2 T+3 T+4 T+N...
Defines the (stress) scenarios associated with the dynamics of each risk factor relevant to the portfolio. All assets and contracts are reevaluated considering the scenarios defined in this step (full valuation).
3. POTENTIAL P&LCALCULATION
T+0 T+1 T+2 T+3 T+4 T+N...
Calculates and aggregates intertemporally P&Lassociated with each scenario, considering the defined closeout strategy
CLOSEOUT RISKResult: Two risk measures—market and liquidity—that are estimated both jointly and consistently
PERMANENT LOSS TRANSIENT LOSS
OVERVIEW: CLOSEOUT RISK CALCULATION IN THREE STEPS