Investor Relations and Firm Value A study on the Indian ... · Investor Relations and Firm Value ....
40
Graduate School Master of Science in Finance Master Degree Project No. 2011:157 Supervisor: Jianhua Zhang Investor Relations and Firm Value A study on the Indian stock market Akshay Dev Coppa and Prithu Banerjee
Transcript of Investor Relations and Firm Value A study on the Indian ... · Investor Relations and Firm Value ....

Graduate School Master of Science in Finance
Master Degree Project No. 2011:157
Supervisor: Jianhua Zhang
Investor Relations and Firm Value A study on the Indian stock market
Akshay Dev Coppa and Prithu Banerjee

ii
Abstract
It has been widely discussed that effective investor relations activity by the companies leads
to reduction in information asymmetry which has a positive effect on firm value. In our study
we observe the effective online representation of investor relation practices by means of
evaluating current and historical share prices, shareholding patterns, corporate news,
financials and information on company's websites. We find that there exists a positive
relationship between this corporate transparency and the value of the firm, which is dependent
on the market capitalization and the sector in which the firm belongs.
The study includes all the constituent firms of the BSE 500 index of the Bombay stock
exchange and it aims to provide an understanding of the pattern of investor communications
in an emerging economy like India.
Keywords: Investor relations; Disclosure; Internet financial reporting; India; Tobin‟s Q

iii
To our families and our friends whose love and support is the reason behind our every
achievement.

iv
Acknowledgement
We are grateful to our supervisor Professor Jianhua Zhang for his continuous support and
constructive comments which have contributed considerably to our work. Without his
assistance we would not have been able to accomplish the thesis.
Special thanks to Professor Martin Holmen who first inspired the topic of this paper via his
lectures. We also want to show our gratitude to Svetlana Sabelfeld from the Financial
Accounting department for helping us with her insights during the initial part of the study.
This paper is the turnout of our two-year MSc Finance programme at the Graduate School,
School of Business, Economics and Law. We would like to thank the school administration
for their kind support.
Although we relied on many individuals to develop our thesis, we take complete
responsibility for its contents.

v
Abbreviations
BR Best Rated firms
BSE Bombay Stock Exchange
DOLLEX Bombay Stock Exchange Dollar Denominated Index
FDI Foreign Direct Investment
FII Foreign Institutional Investment
FMCG Fast Moving Consumer Goods
IIR Internet Investor Relations
IR Investor Relations
NIRI National Investor Relations Institute
NPM Net Profit Margin
SEBI Securities and Exchange Board of India
SENSEX Bombay Stock Exchange Sensitive Index
UR Unrated firms

Table of Contents
Abstract …….................................................................................................................................. ii
Acknowledgement ......................................................................................................................... iv
Abbreviations.................................................................................................................................. v
I. Introduction ............................................................................................................................... 2
II. Literature Review ...................................................................................................................... 4
III. Hypothesis, Data and Model ................................................................................................. 6
1. Hypothesis ............................................................................................................................. 6
2. Data ....................................................................................................................................... 6
Exchange Selection ................................................................................................................... 6
Company Selection ................................................................................................................... 7
IIR Scoring ................................................................................................................................ 8
Variables ................................................................................................................................. 10
3. Model ...................................................................................................................................... 11
IV. Results: ................................................................................................................................ 14
1. Summary statistics ............................................................................................................... 14
2. Analysis according to market cap ....................................................................................... 17
Interaction multiples ............................................................................................................... 17
Analysis of the results ............................................................................................................. 18
3. Analysis according to sectors .............................................................................................. 20
Interaction multiples ............................................................................................................... 20
Analysis of the results ............................................................................................................. 21
V. Conclusion .............................................................................................................................. 23
VI. References ........................................................................................................................... 24
Tables ........................................................................................................................................... 27
2
I. Introduction
Investor Relations (IR) can be explained as a set of activities a firm engages in with shareholders
and analysts. The first mention of shareholder can be traced back to as early as 13th
century‟s
Stora Kopparberg mining company in Sweden and 17th
century‟s Dutch East India Company
(Laskin, 2007). In contrast to that, the emergence of Investor Relations division surfaced in the
middle of 20th
century. The first global professional association of Investor Relations called NIRI
(National Investor Relations Institute) was founded in 1969. NIRI defines IR as “a strategic
management responsibility that integrates finance, communication, marketing and securities law
compliance to enable the most effective two-way communication between a company, the
financial community, and other constituencies, which ultimately contributes to a company's
securities achieving fair valuation” (Adopted by the NIRI Board of Directors, March 2003).
The goal of IR is to increase transparency, augment management credibility and improve
exposure to potential investors to maximize equity value (Ryan and Jacobs, 2005). Allen (2004)
explains that "companies must provide a consistent flow of good, reliable, and transparent
information so that investors can evaluate future performance with confidence".
Academic research in the field of Investor Relations has been limited. Brennan and Tamarowski
(2000) claim that the role of IR has escaped comprehensive scientific analysis primarily due to
lack of dominance of efficient markets paradigm. In spite of limited research, IR as a profession
has been able to gain recognition in most of the developed economies (Laskin, 2006). Investor
Relations as a practice gained importance after the fall of large corporations which led to
decrease in investor confidence. It also led to the introduction of regulatory principles to guide IR
policies (Allen, C., 2002). Companies use different Investor Relation channels to disseminate
information to the investor community: like online, in print and in person (Guimard, 2008).
The rise of internet in the 90s has increased usage of internet as effective modes of
communication to the investors. Deller et al., (1998) show the increase in the usage of internet as
an IR communication channel in USA, UK and Germany. Bushee and Miller (2010) and Bellotti
et al., (2010) demonstrate value relevance to effective usage of IR strategies.
Investor Relations as a profession and as a field of research is very new to Indian markets. The
substantial growth of Indian companies‟ demands openness in corporate reporting to domestic

3
and global investors. There is no research showing the effectiveness of IR strategies in the fast
growing emerging economy like India.
Our two hypotheses are based on the prediction from similar studies. We believe that the
companies with effective web based investor relations strategies should have higher market
value. Also, this relationship between higher market value of the company to effective web based
investor relations activity should vary according to the sector. We test our hypotheses on a model
constructed with variables of firm value and interaction multiples which capture the effect of the
aforesaid IR activity.
The purpose of this paper is to evaluate a relationship between effective web based IR strategies
adopted by Indian companies and its value relevance. We also try to study the differences in the
value relevance across market capitalizations and sectors as defined by the Bombay Stock
Exchange.
The empirical results presented in the paper show a pattern in the value relevance of the usage of
web based IR policies by Indian companies. Results show that some sectors could benefit greatly
by investing more into effective web based IR strategies than the others. Our results also show
that large cap and small cap firms are the most benefited by the usage of best practice web-based
IR strategies. The rest of the paper is structured as follows: Chapter II explains the theoretical
framework; Chapter III throws some light on the model, methodology used and the information
about the data set; and Chapter IV explains the results obtained and our analysis of the results
followed by conclusion.

4
II. Literature Review
The relationship of investor relations activities and corporate disclosures to firm value and
profitability has been discussed by several scholars in recent years. Several literatures both
theoretical and empirical provide significant contribution to this subject. Brennan, M. J. and
Tamarowski, C. (2000) in their study of Investor relations, liquidity and stock prices provides
evidence that corporate IR activities in form of high level of disclosures leads to a high analyst
following which leads to better liquidity of shares and an eventual increase in stock prices.
Botosan, C. (1997) explains a more direct evidence of the relation between investor relations and
stock prices. The study formulates a disclosure quality rank, a rank of 1 to 10 empirically
constructed from the firm‟s disclosure activities and uses regressions to equate cost of equity to
this rank, firm value and the beta of the company. The study finds that particularly for firms with
low analyst followings but with a high disclosure rank has significantly less cost of equity.
In a study by Bellotti et al., (2010) , the authors argue that information asymmetry for investors
is reduced by investor relations activities, which should reduce the cost of capital as reflected by
higher firm market value. They use disclosure based ranking of companies by adopting the
Investor Relations Magazine‟s best overall IR awards nominations as proxies for high ranks and
draws comparison with the firms receiving no nominations as proxies for no ranks. By using
regressions equating market value with book value of equity, net income and variables
constructed with dummies for best rated and unrated, they provide evidence that firms adopting
effective IR strategies have higher liquidity, higher stock returns, and higher market valuation.
The authors find that the results are stronger for smaller companies consistent with Botosan, C.
(1997).
Black et al., (2008) constructs an index for a cross section of firms trading on Korean Stock
Exchange based on disclosure, shareholder rights, board structure and procedure, and ownership
parity. They find that a moderate improvement in the index leads to an increase in Tobin‟s q and
company‟s book value of common equity.
Bushee and Miller (2010) find an increase in market-to-book ratio which they use as a proxy for
firm value for a sample of small and midcap companies that initiate best practice IR programs.
They show that this increase in value could be attributed to the increase in the level of disclosure,

5
analyst following and globally spread institutional ownership. Deller et al., (1998) compares the
Internet Investor Relations (IIR) practices across US, UK and the German corporations. They
find that in the US, IIR is more common and they offer more features compared to the other two
countries. By screening the websites of 50 largest listed companies from Belgium, France and
Netherlands on the Euronext Stock Exchange, Geerings (2003) shows that French and Dutch
companies use IIR more extensively than the Belgian companies. Hedlin (1999) demonstrates the
usage of internet as a tool for investor communications. The author uses surveys of the corporate
websites of Swedish companies listed on Stockholm Stock Exchange to evaluate and explain the
potential of internet as a vehicle for financial communication in Sweden.
Several similar studies has been carried out for the US and the European market, however the
Indian market has not received much attention. We have understood from the study by Sen, K.
(2008) earnings surprise strategy which generates a drift over the subsequent earnings
announcement interval, exists for the Indian market. Though it is not directly related to our study,
it signifies that annual report and interim report announcements and disclosures do have a
significant impact on this market.

6
III. Hypothesis, Data and Model
In this chapter we put forward our prediction regarding the effect of IIR activity on the investor
perception and how it affects the firm value, followed by the data and then our methodology.
1. Hypothesis
It has been widely discussed that full disclosure of private information eliminates mis-valuation
problem (Kreps, 1990, chapter 17 and 18). A method of reducing information asymmetry,
adopted by stock exchanges worldwide is by regulating the corporate reporting and information
disclosures of companies to the investors. Consistently, studies in many corporate
communications and disclosure literature (e.g., Kothari, Li and Short, 2009), observes that
reduction in information asymmetry associated with effective IR strategies are actually rewarded
by the stock market, by having a positive impact on the firm value. It is evident from Brennan
and Tamarowski (2000) that effective IIR strategies leads to increased liquidity, which leads to a
lower cost of capital and thus higher stock prices.
In sum, a firm can reduce its cost of capital and increase its stock price through more effective
investor relations activities. However, since the effectiveness of IIR is dependent on the corporate
policies of companies and its annual budget, we believe that it differs according to size of the
firm and the sector to which it belongs. Consequently, our hypotheses are
1. The companies with effective web based investor relations strategies have higher market value.
2. The relationship between higher market value of the company to effective web based investor
relations activity varies according to the sector.
2. Data
Exchange Selection
We have selected Bombay Stock Exchange for the purposes of our study as by the virtue of being
the largest stock market in India it gives a wide scope for understanding the entire market.
Bombay Stock Exchange is the oldest stock exchange in Asia and the 8th
largest stock exchange
in the world with more than 5000 listed companies with a total market capitalization of US$1,63
7
1trillion. Major indices include SENSEX (30), DOLLEX, SHARIAH 50, BSE 100, BSE 200,
BSE 500 and Sectoral Indices.
Company Selection
We have selected the constituents of Bombay stock exchange‟s BSE 500 index as it serves as the
best representation of the Indian market. The constituents consist of firms from large cap, mid
cap and small cap and are good representation of the all sectors.
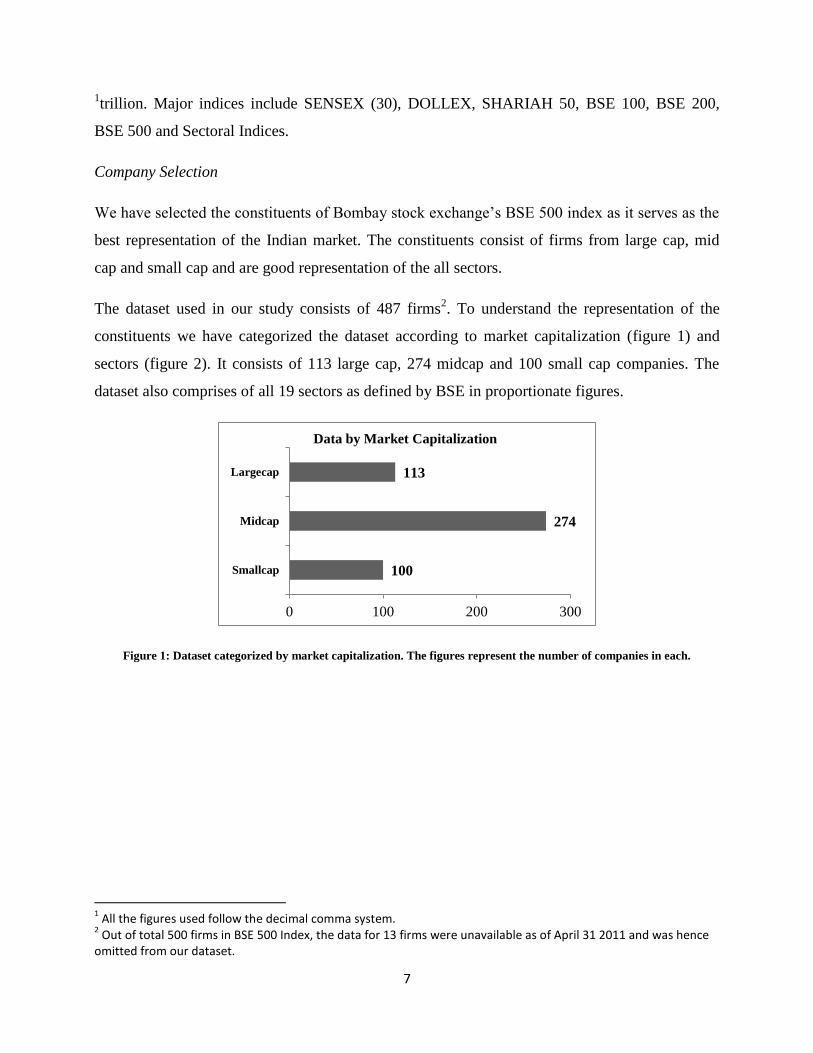
The dataset used in our study consists of 487 firms2. To understand the representation of the
constituents we have categorized the dataset according to market capitalization (figure 1) and
sectors (figure 2). It consists of 113 large cap, 274 midcap and 100 small cap companies. The
dataset also comprises of all 19 sectors as defined by BSE in proportionate figures.
Figure 1: Dataset categorized by market capitalization. The figures represent the number of companies in each.
1 All the figures used follow the decimal comma system.
2 Out of total 500 firms in BSE 500 Index, the data for 13 firms were unavailable as of April 31 2011 and was hence
omitted from our dataset.
100
274
113
0 100 200 300
Smallcap
Midcap
Largecap
Data by Market Capitalization

8
Figure 2: Dataset categorized by sectors. The figures represent the number of companies in each.
IIR Scoring
IR web pages, located within a company‟s official website, are source of all possible information
regarding the past and present performance of the company. It is a repository of both financial
information like quarterly statements, annual reports, key figures and non-financial information
like company profile, grievance contact, corporate governance which are yardsticks for investors
to decide whether or not the particular company suits their investment objective. It is also
important source for analyst to gather information about the company.
Our study requires a close understanding of the IR web pages and observing the difference
among them so as to relate them to the policies of the entire IR department of a company in
dissipation of company information to investors and analysts. Though we understand that
different companies approach to investor relations in different ways, the use of World Wide Web
in communicating to large population of investors has grown rapidly since the early 90s (Lymer
1999, Jones and Xiao 2004) and particularly in a large country like India which has millions of
domestic shareholders and an increasing amount of international investors it is of primary
importance.
19
55
15
8
15
69
33
32
52
37
17
31
20
18
11
9
5
24
17
Agriculture
Capital Goods
Chemical & Petrochemical
Consumer Durables
Diversified
Finance
FMCG
Healthcare
Housing Related
Information Technology
Media & Publishing
Metal,Metal Products & Mining
Oil & Gas
Power
Telecom
Textile
Tourism
Transport Equipments
Transport Services
Data by Sectors
9
Therefore the purpose of our study requires overview approach to the empirical material, which
necessarily means that we need to investigate the IR website, the organization of the domain and
the way by which the information is presented. This empirical knowledge can be gathered by
accessing the IR section of a corporate website, individually for all the companies and grading
them according to their adoption of investor relations activities.
To collect this data we follow the qualitative content analysis technique which is defined as “an
approach of empirical, methodological controlled analysis of texts within their context of
communication, following content analytic rules and step by step models, without rash
quantification” (Mayring, 2000, p 2).
Online investor relations activities is a young practice, which came into existence in 1990s,
however is a growing trend due to its ease of use and wide scope of reach to investors and
analysts all around the globe. To understand how the companies have adopted this idea a
thorough scan of the IR WebPages using inductive category development (Mayring 2000)
approach has been considered for our study. It will also allow a scope for future studies by
observing the pattern of developments on the same IR WebPages over a period of years and
relating them to the growth of the company in terms of the variables used in our analysis.
To determine the criterion for grading we observe the structure of the IR website and use main
categories and sub-categories of the website as our parameters. We observe whether the
particular parameters are explicitly published in the IR pages. However, we do not try to observe
the quality of the information stored therein as it is beyond the scope of our study, i.e. we do not
open each document and presentation to check the information within them. We believe that the
financial information disclosed by means of the aforesaid IR website is already reflected in the
current price of the public listed shares, which we later capture by collecting the financial ratios,
figures and trading price explained in the next section.
To grade the IR websites we compile an empirically developed checklist which is in accordance
to the best practice IR recommendations and institutional regulations. The point to be noted here
is that even though the Securities and Exchange Board of India (SEBI)3 and Bombay Stock
3 Disclosure format for shareholding under clause 35 of the listing agreement revised on February 2004 ‘A
functional website is must’ report of the Indian IR society published on March 2011

10
Exchange (BSE) are the main regulators for corporate reporting for publicly listed Indian
companies, its regulation does not include all the parameters as specific rules addressed to the
corporate reporting on their websites. Or in other words information reported by Indian
companies through their IR websites is majorly disclosed on a voluntary basis.
The grading model is explained in the table below. We draw up 10 different IIR parameters based
on the best practice investor relations practices observed by the IR society, IR services industry
and the SEBI mandates. The highest grade that can be obtained is 20 (in case of successful
implementation of all the mandates and best practices) and lowest is zero in case of complete
absence of any web based IR activity.
Empirically developed grading strategy for Web based IR services, cumulatively called IIR
Score:
S.no Parameter Satisfies Not Satisfied Additional
1 Investor Relations Page 1 0
2 Financial results 1 0 Archives (3Y) +1
3 Annual Reports 1 0 Archives (5Y) +1
4 Shareholding pattern 1 0 Graphical format +1
5 Press Releases/News 1 0 Video content +1
6 Contact details of IR executive 1 0
7 Analyst Reports and Estimates 1 0 Buy/Sell recommendation +1
8 Share price info
i BSE hyperlink* 1 0
ii Share Ticker 1 0
iii Share Chart 1 0 Interactive tool/ Best practice +1
9 Historical Share price info 1 0 Interactive/Downloadable format +1
10 Alerts for investor 1 0 * the Bombay Stock Exchange provides online IR services with a hyperlink on the BSE website. An example : http://www.bseindia.com/stockinfo/index.htm?scrip_cd=500570
Table 1: IIR scoring: a scoring from 1 to 20 constructed on basis of online IR activities
Variables
Stock price, market value of equity, and net profit margin are extracted from the DataStream
database. Tobin‟s Q is calculated with Book value of equity, Market Value of Equity and
Liabilities book value figures obtained from DowJones Factiva Database. All accounting figures
are for 2010. The Share prices are the closing price as of March 31 2010. The detailed description
about these data can be found in Table I.
11
3. Model
The scores obtained are not used as absolute figures, are rather used to separate the companies as
„best rated‟, „unrated‟ and „other rated‟. „Best rated‟ are the ones with scores above the median
score of the sample, 8. The „unrated‟ are the ones which do not follow the SEBI mandates and
does not have an IR website, contact details of investor grievance and basic share price
information in any format, and „other rated‟ are the ones which are neither „best rated‟ nor
„unrated‟. The „best rated‟ and „unrated‟ firms are represented by dummy variables in our model.
The differentiation will help us to distinguish the performance of the „best rated‟ firms, which
follow the best practice standards signifying the better dissipation of financial information and
hence the lower information asymmetry, as compared with the „other rated‟ firms which has an
average IIR activity according to the industry standards. Another comparison is between the
„other rated‟ firms to the „unrated‟ firms, which have no or very less IIR activity and hence a
higher information asymmetry between the managers of the company and the investors.
Our hypothesis as based on the prediction that the level of information asymmetry which is
affected by the IR policies adopted by a company plays a significant role in the judgment of the
company by the investors which in turn should have a significant impact on the firm value. We
test using the regression results from the model constructed with a firm value indicator Tobin‟s Q
as a function of profitability indicators as measured by Sales to Assets (S/A) and Net Profit
Margin (NPM). The dummy variables like Best Rated (BR), Unrated(UR) and their interaction
with the profitability indicators like S/A*UR, S/A*BR, NPM*UR, NPM*BR are regressed for
entire pooled sample, large, mid and small cap. Separate regression is carried out for the sectors
to observe the pattern of effect of IIR according to the sector.

12
Variables Definition
Sales/Assets Ratio of Total Sales to Total Assets of the firm : profitability indicator
Net Profit Margin Profitability indicator ratio for a firm
Tobin's Q Measure of Firm value : (Market Value of Equity + Book Value of
Debt)/(Book value of Equity + Book value of Debt)
UR 1-if firm does not follow SEBI regulations.
i.e. no IR page, no Shareholding Pattern and no contact details of IR
department
0-otherwise
BR 1-if the firm receives IIR Score greater than median of the sample
0-otherwise Table 2: Explanation of variables
The model is represented as,
⁄ ( ⁄ )
( ⁄ ) ( ) ( )
(1)
where:
= Tobin‟s Q of the firm i,
⁄ = Sales by asset ratio of the firm i,
= Net Profit Margin of the firm i,
= 1 if the firm i does not follow the mandatory regulations by the SEBI („unrated‟), 0
otherwise, and
= 1 if the IIR Score received by the firm i is greater than the median („best rated‟), 0
otherwise
We follow the approach used Bellotti et al., (2010) to understand the effects of dummy variables
in the model. By this method we find out the interaction of dummy variables (UR and BR) on
quantitative variables (S/A and NPM) used in our model. The coefficients from the regression are
then used to analyze the difference between „unrated‟ and „other rated‟ firms, and „best rated‟ and
„other rated‟ firms as

13
Sales/Assets Multiple4:
[
]
[
]
Net Profit Margin Multiple:
[
]
[
]
If any firm moves from being „other rated‟ to „best rated‟ by adopting best practice IR tools and
top of the line investor communication strategies, the shift in the sales/assets ratio can be
observed by the term, and shift in the net profit margin can be
observed by the term. Similarly, if a firm moves from being
„unrated‟, i.e. having no or minimal IIR activity to being „other rated‟, i.e. adopting some or
average IIR activity, the shift in the sales/assets ratio can be observed by the
term, and shift in the net profit margin can be observed by the
term. These multiples provide a clear idea to analyze of how
effective IIR5 affects firm value.
4 We use ANCOVA regression models as followed by Bellotti et al., (2010) to measure effect of interaction
multiples. 5 Effective IIR indicates improvement in Internet based Investor Relations. i.e. moving from ‘unrated’ to average
(or) moving from average to ‘best rated’.

14
IV. Results:
This chapter explains the characteristics of the pool of firms in our sample. In addition we will
discuss the tests on our hypotheses dealt in chapter 3.
1. Summary statistics
A detailed depiction of our IIR scoring is graphically represented in the figure 3 below. It
illustrates the pattern of contents of the companies‟ IR websites. It demonstrates the differentiated
level of usage of IR websites by small cap, mid cap and large cap companies. We can see that the
majority of the companies in our sample satisfy the mandatory disclosure regulations like IR
contact, compulsory IR page and financials and reports as well. On the other hand voluntary
disclosure items like share chart, ticker, alerts for shareholders are more popular only with large
cap companies which could very well be explained by the extra costs involved in these voluntary
disclosures.
Figure 3: IIR Score-descriptive statistics
0% 20% 40% 60% 80% 100%
IR Page
Financials
Annual Reports
Press Releases
IR contact
Shareholding Pattern
BSE hyperlink
Share Ticker
Historical Share price Info
Share Chart
Events
Analyst Recommendations
Alerts
% Smallcap Midcap Largecap All

15
Figure 4 below shows the differences in the mean IIR Score categorized by market
capitalizations. Our firm dataset of 487 companies has a mean IIR score of 8,52. As expected, the
small cap companies have the lowest mean IIR Score and mid cap companies are below the
average score of the entire pooled sample. Large cap firms have the highest mean IIR score
(9,84) and this supports our earlier argument of increased voluntary disclosures by such firms.
Figure 4: IIR Score – By Market Capitalization: (y axis - mean IIR score)
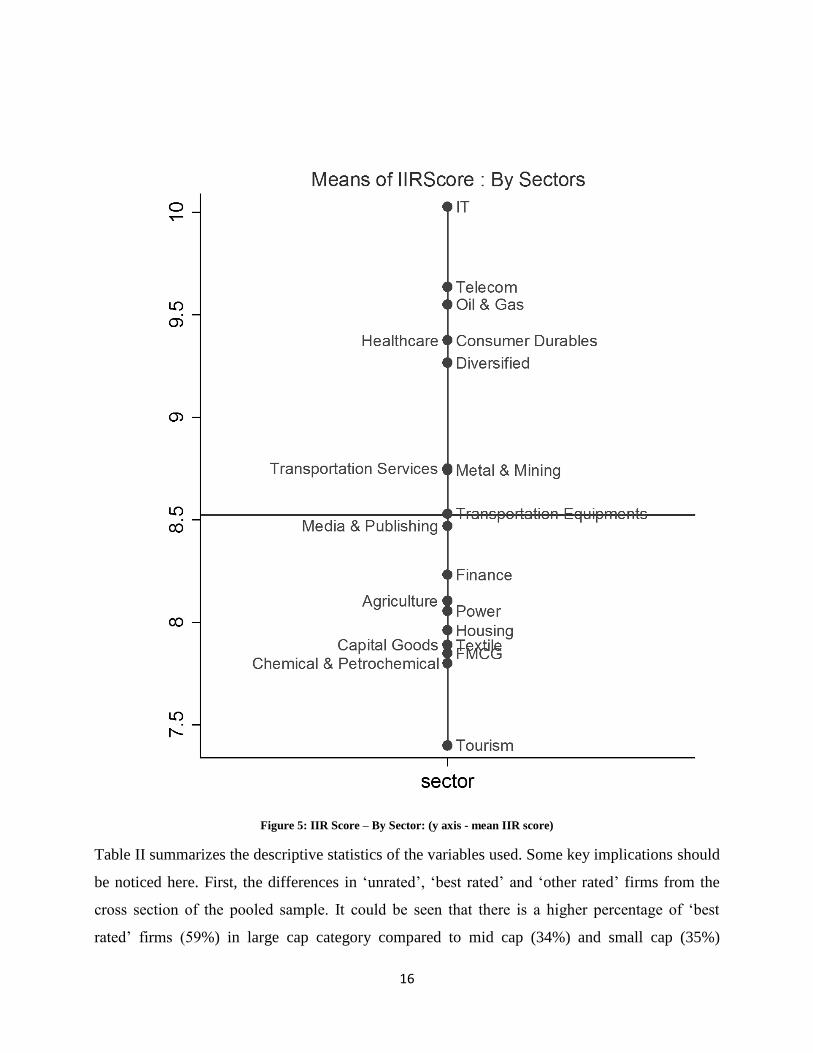
Another interesting observation is obtained by classifying the firms into sectoral groups. Such an
approach will be helpful to isolate sectors of the Indian market which disclose financial
information to the investor community in a better way. As we go further into the study of
effective IIR contributing to the firm value, these sectoral analyses will be more useful. The
figure 5 below classifies mean IIR score by sectors (or) industry. Clearly sectors like Information
Technology, Telecom, and Oil & Gas have the best average IIR Scores, while Tourism stands
last.
16
Figure 5: IIR Score – By Sector: (y axis - mean IIR score)
Table II summarizes the descriptive statistics of the variables used. Some key implications should
be noticed here. First, the differences in „unrated‟, „best rated‟ and „other rated‟ firms from the
cross section of the pooled sample. It could be seen that there is a higher percentage of „best
rated‟ firms (59%) in large cap category compared to mid cap (34%) and small cap (35%)

17
respectively. Likewise the large cap category contains only 9% of „unrated‟ firms, whereas the
mid cap panel contains almost three times (26%) more „unrated‟ firms and small cap has two
times (17%) more firms classified as „unrated‟. Second, it can be seen that the average market
capitalization and net profit margin is consistently higher for „best rated‟ firms than the „unrated‟
firms. However only in the case of large cap firms the mean net profit margin is higher for
„unrated‟ firms compared to „best rated‟. Table V shows the correlation matrix of the dependent
and the independent variables.
2. Analysis according to market cap
Table III shows the regression results for the equation (1) classified according to market
capitalizations (large cap, mid cap, small cap companies) and also for the entire pooled sample.
Interaction multiples
We observe the difference between „unrated‟ and „other rated‟ firms, and „best rated‟ and „other
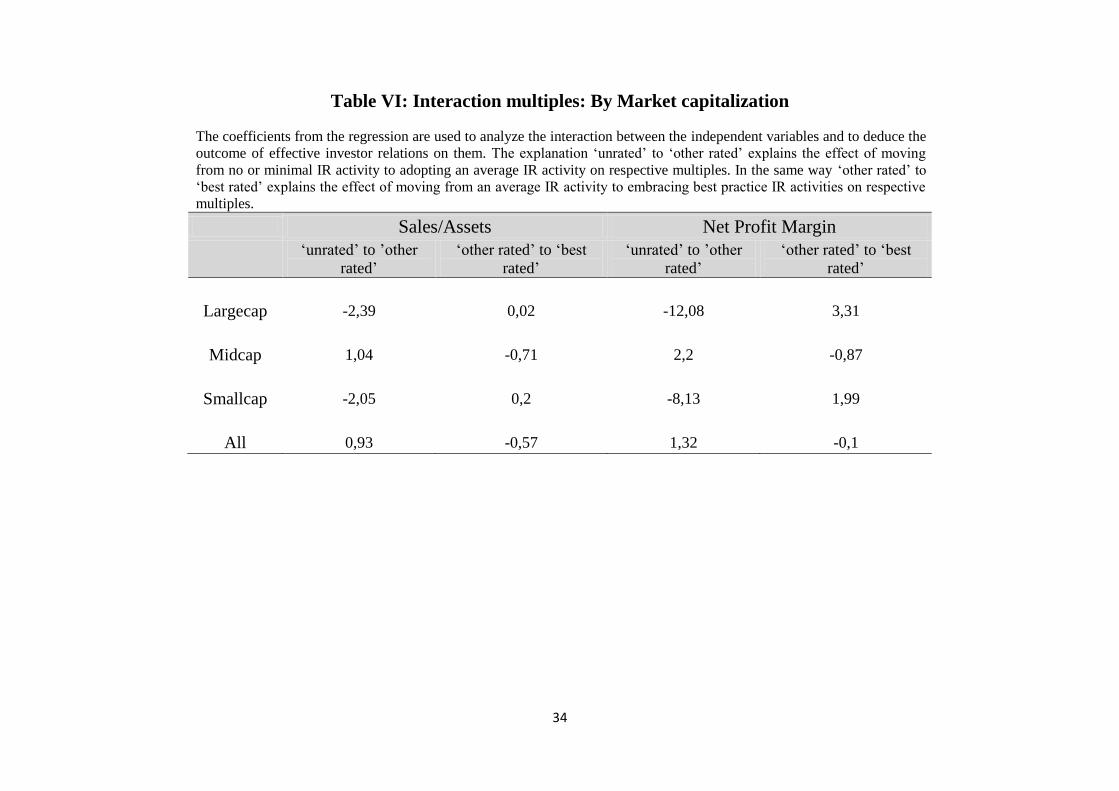
rated‟ firms. Table VI shows that the „unrated-other rated‟ shift of 0,93 in Sales-Asset which
necessarily means that if any firm moves for being „unrated‟ (no or minimal IIR activity) to
„other rated‟ (some or average IIR activity) there is a positive correlation with Sales-Asset ratio.
Similarly a value of 1,32 for the NPM multiple means that firms with some or average IIR
activities have 1,32 times higher net profit margin as compared to those which have no or
minimal IIR activities.
If any firm moves from „other rated‟ to „best rated‟ by adopting best practice IR tools and top of
the line investor communication strategies, the result does not show any significant improvement
for the entire pooled sample. However the large cap companies exhibit a statistically significant
shift of 3,31 times in NPM and by a factor of 0,02 in S/A multiples respectively. This implies that
there exists a positive correlation, suggesting that it is beneficial for large cap companies to adopt
best practice IR services. For the firms belonging to the small cap sector the figures are 0,20 for
Sales-Asset and 1,99 for NPM multiples. Therefore the results are consistently similar in small
cap sector as well.
18
The results however are different for the firms belonging to the mid cap sector. They show a
positive correlation when the shift is from „unrated‟ to being „other rated‟, the interaction
multiples being 1,04 for Sales-Asset and 2,20 for NPM. The results do not suggest any
improvement when the mid cap companies takes it to the next level by using best practice IR
tools. Therefore according to the results it is more beneficial for mid cap companies to adopt an
average IIR services, rather than the best practice IIR or nothing at all.
The interaction multiples are negative in case of large and small cap firms when we observe a
shift from unrated to other rated. A similar trend is also observed for midcap companies when we
observe the shift from other rated to best rated. The point to noted here is that the interaction
multiples alone does not influence positive (or negative) effect on the firm value. It is a
cumulative effect of the firms‟ financials, the figures representing performance of the firm along
with effective IIR activity which leads a better performance in terms of firm value. However if
the financials of the firm itself shows a negative trend it is beyond the scope of an effective IIR
activity alone to generate positive influence on the firm value. Similar views are expressed in
Peasnell et al (2011). So verifying the utility of IIR activity should use subjective interpretation
which we have observed in our analysis of interaction multiples both across sectors and
capitalizations.
Analysis of the results
The observation is best explained for small companies as a higher investment in IIR essentially
leads to better propagation and highlighting of their company information to the prospective
investors and analysts. As observed by Botosan (1997) that IR activities considerably reduces the
cost of information gathering for the analysts, which consequently leads to a greater analyst
following, more agreement among analysts, and greater accuracy of analyst forecasts. This in
turn has a significant positive impact associated with the price of firm‟s shares. This is consistent
with the fact that for small cap firms it is relatively more difficult to find financial and corporate
information compared to the firms in large cap, therefore for a small cap firm which invests more
in IIR depicts more transparency and makes it easier for investors and analysts to find relevant
information which leads to higher liquidity and hence a higher firm value compared to the small
cap firms which follows no or insignificant IIR practices thereby remaining unreachable or
invisible to the investors and analysts. For such firms though they might have thriving operating

19
business a considerable amount of investors might get turned away due to lack of available
information.
The observation of the regression results which predominantly states that for small cap firm there
is a significant positive shift in sales to assets and NPM as the firm adopts best practice IR
policies is consistent with the chain of causation as explained by Brennan and Tamarowski
(2000), that a firm can reduce its cost of capital and increase its stock price through more
effective investor relations activities, which reduce the cost of information to the market thereby
leading to a higher liquidity and better analyst coverage and hence a better price.
For large cap firm the effect can be understood as a part of their corporate strategy itself since for
a large cap company higher investment in IIR can be considered as a standard company policy. It
should be noted that it is usual for large cap companies to already have considerable analyst
following and interested investors with or without maintaining a proper IR website. Their
operating business is their key driver which keeps the analysts and investor interested in finding
information regarding the company for multiple sources if they are not available on the corporate
webpage. Therefore an average IIR activity, denoted by some information, some annual reports
and basic share price information is not really of much interest for the users. However if the large
cap companies adopt best practice IIR services denoted by proper archiving of all its reports,
regular update and analysis of its share trading, analyst following, historical trends and future
announcements it is more likely to propagate a positive message across to its shareholders and
interested investors which might consequently be effective in liquidation of its block of shares,
higher price and better firm value compared to a similar firm with no or less IIR activity. Thus
our observation from the regression results which denotes a positive shift in the sales to asset and
NPM figures as it shifts from being „other rated‟ to „best rated‟ consistently denotes that large cap
companies are better off when they plan to choose best practice IIR activities.
For midcap firms however the results from the regression shows a positive shift in sales to assets
and NPM as the firms adopt an average IIR activity, suggesting that an average investment in IIR
activity particularly for the firms in midcap bracket should be considered enough. A large
investment in IIR may lead to reduction in funding their operating business which is the primary
drivers of their market value. This observation is consistent with the fact that an above average
investment in IIR alone does not lead to above average returns (Peasnell et al., 2011). An

20
average investment in IIR can therefore be deemed to be fine for companies in this category;
however a very low investment may not be a good idea as well since it will increase the gap
between the company and the analyst or investors as we have discussed before.
3. Analysis according to sectors
Appendix Table IV shows the regression results for the equation (1) classified according to the
sectors defined by the Bombay Stock Exchange.
Interaction multiples
The interaction multiples are significantly different across the sectors. This indicates a variation
of the effect of IIR on the profitability indicators of firms according to sectors.
For firms belonging to the diversified sector we see that the multiples of Sales to assets and NPM
are consistently higher, 4,01 and 7,72 respectively when the firms shift from being „unrated‟ to
„other rated‟. This necessarily means that if firms belonging to the diversified sector moves from
being „unrated‟ to „other rated‟, the profitability indicators are likely to be positively affected
keeping other factors constant. Consistently the results are similar in textile sector as well, the
multiples being 2,08 and 4,98 for Sales to Assets and NPM respectively. A total of 9 sectors
exhibits similar results, though the multiples are smaller than the diversified and textile,
suggesting that the trend is consistent although the effect is less. The sectors which has a positive
shift as the firms move from being „unrated‟ to „other rated‟ are-
Finance, Housing, IT, Media and Publishing, Transport Equipments
The „other rated‟ to „best rated‟ shift is observed with positive multiples of Sales to Assets (4,24)
and NPM (0,17) in only one sector – Oil and Gas, signifying that the firms belonging to this
sector which adopt best practice IIR services are more likely to have a higher firm value than the
ones which has an average or relatively low IIR activity keeping other factors constant.
The Healthcare sector alone exhibits positive multiples for both Sales to Asset and NPM in both
the scenarios, shift from „unrated‟ to „other rated‟ (16,02 and 2,99 respectively) and „other rated‟
to „best rated‟ (2,71 and 4,54 respectively). The observation suggests that Healthcare firms
adopting any IIR activity, whether average or high (i.e. effective IIR strategies) can be considered
21
to be beneficial for the companies, as they exhibit significantly higher sales to asset ratio and
NPM compared to the ones adopting minimal or no IIR activity at all.
Analysis of the results
Looking at the figures in the previous section we find that the results can be broadly divided in
four categories-
1. Sectors in which firms adopting an average IIR activity have higher impact on the
profitability indicators compared to the ones adopting best practice or minimal IIR
activity. This pattern of the interactive multiples is consistent for most of the sectors and
the overall sample, which indicates that for a majority of the Indian firms adopting an
average IIR activity is linked to a higher profitability estimates compared to best IIR
practices or none at all.
2. Sector in which firms adopting best practice IIR activities have higher impact on the
profitability indicators compared to the ones adopting average, minimal or no IIR activity.
This pattern is observed only in the Oil and Gas sector, the dataset of which is dominated
by large cap firms, subsidiary of large cap firms and Government of India owned
subsidiaries. Consequently their pattern is similar to that exhibited by the large cap firms
which already has a large proportion of interested investors and analysts and requires best
IIR practices to highlight.
3. Sector in which firms adopting any IR activity, both average and best practice are
rewarded by a higher impact on the profitability indicators compared to the ones which no
IIR activity at all. This pattern is observed only in the Healthcare sector, which is one of
the strongest competitors6 for foreign direct investments (FDIs), foreign institutional
investments (FIIs) and a hot favorite among domestic investors alike. Hence it is very
likely for firms belonging to the healthcare sector to invest accordingly in their IIR
services, consequently attracting more investors and analysts which can be linked to a
better profitability of the companies adopting such policies in the current market scenario.
4. Sectors in which firms adopting any IIR activity does not show a statistically significant
effect on the firm value. This pattern is observed in the four sectors, in which the
6 The Ministry of Commerce and Confederation of Indian Industry (CII) reports focus Healthcare sector as the ‘next
big thing’ after IT in India. Links to online reports can be found in References section.

22
interactive multiples fail to offer any result due to cogent presence of collinearity among
the variables of the model regressed. The variables and sector are stated in table 2 and
Table VII respectively.

23
V. Conclusion
This paper examines the value relevance of the effective investor relations demonstrated on
corporate websites. Our study focuses in particular on the Indian market. In this paper we use a
large sample of 487 firms; constituents of BSE500 index from the Bombay Stock Exchange, to
test our hypothesis. Tobin‟s Q is used as the proxy for the measure of firm value. We perform IIR
scoring for all 487 firms by screening the investor relations page of their corporate websites.
With these scores as dummy variables, we test our hypothesis by introducing them into a model
constructed to determine the impact of IR activity on firm value on levels of Net Profit Margin
and Sales to Assets ratios (independent variables).
Our statistically significant results show that adopting best practice IR services on the internet is
much beneficial for large cap and small cap companies. For these companies it is better to invest
more on IIR to have a higher firm value on the levels of the profitability indicator variables used
in our study. In the case of mid cap companies, our results show that it is advantageous for them
to have an average IIR activity. Our study also investigates the impact across the 19 sectors as
defined by the Bombay Stock Exchange. In 9 out of 19 sectors, our results show that it is
beneficial to have average IR services on the internet, some of them are Finance, IT, Housing,
Media & Publishing and Transport Equipments. The results also show that sectors like Oil & Gas
and Healthcare are the most to be benefited on firm value with best practice IR services on their
websites.
In summary we show that there is significant value relevance to the IIR practices followed by the
firms listed on the Indian market. Our results certainly show that the impacts of this value
relevance are distributed across market capitalizations and sectors. To establish a stronger
research with a definitive pattern it may be interesting to look at the same study for a longer
period of time, which could be our suggestion for future research.

24
VI. References
Allen, D. (2004). Fundamentals of investor relations. In B.F. Cole (Ed.), The new investor
relations: Experts perspective on the state of the art (pp. 3-21). Princeton, NJ: Bloomberg Press.
Bellotti, Xijuan Angel, Agarwal, Vineet, Nash, Elly and Taffler, Richard J., (2010) Does Investor
Relations Add Value? Available at SSRN: http://ssrn.com/abstract=1695934.
Black, Bernard S., Kim, Woochan, Jang, Hasung and Park, Kyung Suh, (2008) How Corporate
Governance Affects Firm Value: Evidence on Channels from Korea. Available at SSRN:
http://ssrn.com/abstract=844744.
Brennan, M. J. and Tamarowski, C. (2000), Investor Relations, Liquidity, And Stock prices.
Journal of Applied Corporate Finance, 12: 26–37.
Bollen, Laury H., Hassink, Harold F., Lange, Rindert K. de and Buijl, Saskia D., (2008), Best
practices in managing investor relations websites: directions for future research, Open Access
publications from Maastricht University, Maastricht University.
Botosan, C. A. (2000), Evidence that greater disclosure lowers the cost of equity capital. Journal
of Applied Corporate Finance, 12: 60–69.
Claire Marston, Michelle Straker, (2001) "Investor relations: a European survey", Corporate
Communications: An International Journal, Vol. 6 Iss: 2, 82 – 93.
Christopher E. Allen, (2002) "Building mountains in a flat landscape: investor relations in the
post-Enron era", Corporate Communications: An International Journal, Vol. 7 Iss: 4, 206 – 211.
Damodaran, Aswath (2002). Investment Valuation. (John Wiley & Sons, Hoboken, NJ). ISBN 0-
471-41488-3.
Dariusz A. Niedziolka, (2007) Investor relations in Poland: An evaluation of the state of affairs
from empirical studies, Public Relations Review, Volume 33, Issue 4, 433 – 436.
Deller, Dominic, Stubenrath, Michael and Weber, Cristoph (1998) „Investor relations and the
Internet – background, potential applications and evidence from the USA, UK and Germany‟,
European Accounting Association‟s 21st Annaul Meet in Antwerp, Belgium.
25
Geerings, J., Bollen, L. H. H. and Hassink, H. F. D.(2003) 'Investor relations on the Internet: a
survey of the Euronext zone', European Accounting Review, 12: 3, 567 – 579.
Guimard Anne, (2008). Investor relations: principles and international best practices of financial
communications (Palgrave Macmillan, Hampshire).
Gujarati N. Damodar (2004). Basic Econometrics, 4th edition. (The McGraw-Hill Companies).
ISBN 0071123431.
Healy, P. and Palepu, K. (2000), Information Asymmetry, Corporate Disclosure and the Capital
Markets: A Review of the Empirical Disclosure Literature. Available at SSRN:
http://ssrn.com/abstract=258514.
Hedlin, Pontus(1999) 'The Internet as a vehicle for investor relations: the Swedish case',
European Accounting Review, 8: 2, 373 – 381.
Inagami, T. (2001) „From Industrial Relations to Investor Relations? Persistence and Change in
Japanese Corporate Governance, Employment Practices and Industrial Relations‟, Social Science
Japan Journal 4(2): 225 – 41.
India Brand Equity Foundation report (March 2011) and presentation (November 2010) on
Healthcare sector, available at: http://www.ibef.org/industry/healthcare.aspx.
IR Society India publication: Buy Side and Sell Side (March 2011), Volume 1 issue 9, Page 9,
available at: http://www.irindia.com/March%202011%20final.pdf.
Kothari, S.P., Li X., and Short, J. (2009), The Effect of Disclosures by Management, Analysts,
and Business Press on Cost of Capital, Return Volatility, and Analyst Forecasts: A Study using
Content Analysis.
Kreps, David M. (1990), Game theory and economic modeling, (Oxford University Press, USA).
ISBN 0198283571.
Laskin, A.V. (2006). Investor relations practices at Fortune 500 companies: An exploratory
study. Public Relations Review, 32, 69–70.

26
Laskin, A.V. (2006). The Value of Investor Relations: A Delphi Panel Investigation. Institute for
Public Relations. www.instituteforpr.org.
Lodhia, S. K., Allam, A. and Lymer, A. (2004), Corporate Reporting on the Internet in Australia:
An Exploratory Study. Australian Accounting Review, 14: 64 – 71.
Lymer, A. (1999), "Internet and the future of reporting in Europe." European Accounting Review
page 289-301.
Mayring, P. (2000), Qualitative Content Analysis [28 paragraphs]. Forum Qualitative
Sozialforschung / Forum: Qualitative Social Research, 1(2), Art. 20, http://nbnresolving.
de/urn:nbn:de:0114-fqs0002204.
National Investor Relations Institute (2004). Board Meeting. Vienna, VA: NIRI.
Peasnell, Kenneth, Talib, Sayjda and Young, Steven (2011) 'The fragile returns to investor
relations:evidence from a period of declining market confidence', Accounting and Business
Research, 41: 1, 69 – 90.
Ryan, Thomas M., and Jacobs, Chad A., (2005). Using Investor Relations to Maximize Equity
Valuation (John Wiley & Sons, Inc., Hoboken, NJ).
Sen, Kaustav, Earnings Surprise and Sophisticated Investor Preferences in India (December 20,
2008). Journal of Contemporary Accounting and Economics, Forthcoming. Available at SSRN:
http://ssrn.com/abstract=1318705.
Xiao, J., Jones, M. and Lymer, A.(2004), A Conceptual Framework for Investigating the Impact
of the Internet on Corporate Financial Reporting. The International Journal of Digital
Accounting Research Vol. 5, N. 10, 2005, 131–169 ISSN: 1577-8517.
Zhang, Y. and Wildemuth, B. (2008), Qualitative Analysis of Content available at:
http://www.ils.unc.edu/~yanz/Content_analysis.pdf.

27
Table I: Variables and Sources of Data
This table explains the variables names and the source of the variables. Our data sample focuses on companies listed on Bombay stock exchange‟s
BSE 500 index. Some data were not available for 13 companies in the BSE 500 index reducing our sample to 487. The data used for the analysis
include 487 companies across 3 Market Capitalization and 19 sectors as defined by BSE.
Variables Description Sources
Common Shares Ownership of equity (with voting rights) - on March 31, 2010 Dowjones Factiva Database
Preferred shares Ownership of equity (without voting rights) - on March 31, 2010 Dowjones Factiva Database
Share Price Stock price of the company on March 31, 2010 Datastream
Total Equity Book value of total Share capital and Reserves, in billions of INR (on March 31, 2010) Dowjones Factiva Database
Total Assets Book value of total assets of the firm, in billions of INR (on March 31, 2010) Dowjones Factiva Database
Total Debt Book value total debt of the firm, in billions of INR (on March 31, 2010) Dowjones Factiva Database
Sales Total sales of the firm, in billions of INR (on March 31, 2010) Dowjones Factiva Database
Net Profit Margin Published Net Profit Margin of the firm as on March 31, 2010 Datastream
* All data collected were local currency, Indian Rupee (INR)
All the figures used follow the decimal comma system.

28
Table II: Descriptive Statistics
The data sample covers 487 firms from the Bombay Stock Exchange listed under BSE500 index. Book value data, Stock prices are
collected in local currency Indian Rupees (INR bn). All the required data are obtained from Datastream and DoweJones Factiva database.
Financial ratios are computed upon the raw financial data collected. This table divides the sample into three subgroups based on Market
Capitalization and also the entire pooled sample.
Number of Firms
Market
Capitalization (bn
INR)
Tobin's Q Sales/Assets Net Profit margin
mean median mean median mean median mean median
A. Largecap Firms
Unrated 10 722,21 157,00 4,96 1,23 0,47 0,28 23,81 19,89
Other rated 36 361,50 215,27 3,87 2,01 0,72 0,60 17,75 15,47
Best Rated 67 753,23 275,20 3,68 2,09 0,73 0,63 17,68 15,03
Total 113 625,69 233,65 3,85 2,03 0,71 0,60 18,24 16,26
B. Midcap Firms
Unrated 70 44,11 28,70 2,63 1,73 0,78 0,59 9,76 8,95
Other rated 112 61,72 33,09 3,11 1,58 0,74 0,52 13,34 11,48
Best Rated 92 52,01 36,80 3,20 1,56 0,77 0,70 13,67 9,24
Total 274 53,96 33,26 2,68 1,60 0,76 0,63 12,54 9,72
C. Smallcap Firms
Unrated 17 13,65 10,95 2,85 1,31 0,79 0,60 9,49 6,79
Other rated 48 13,30 8,87 1,54 1,29 0,69 0,64 7,59 8,35
Best Rated 35 14,02 10,70 1,69 1,32 0,72 0,64 9,60 10,77
Total 100 13,61 9,90 1,82 1,31 0,72 0,64 8,62 9,28
D. All Firms
Unrated 97 108,68 27,62 2,91 1,56 0,75 0,56 11,16 9,41
Other rated 196 104,92 32,02 2,87 1,49 0,73 0,59 12,74 11,63
Best Rated 194 287,33 50,05 2,62 1,62 0,75 0,66 14,32 11,59
Total 487 178,34 37,34 2,78 1,54 0,74 0,62 13,06 11,38

29
Table III: Value relevance of Effective IR activity: By Market Capitalization
The data sample contains 487 firms listed on Bombay Stock Exchange – BSE India. They are constituents of the BSE500 index and are differentiated as
Largecap, Midcap and Smallcap based on their Market Capitalizations. The following regression model is estimated:
⁄ ( ⁄
) ( ⁄ ) ( ) ( )
where the dependent variable is Firm Value, as measured by Tobin‟s Qi of the firm i at 31st March 2010, S/Ai is the ratio of Sales to Assets of the firm i at 31
st
March 2010 and NPMi represents the Net Profit Margin of the firm i as on 31st of March 2010. Based on the empirical IR Scoring of the investor relations
home pages of firms, we have divided firms as Unrated („UR’), Best Rated („BR’) and other rated. URi is 1 if the firm i do not follow the mandatory
regulations for Online Investor communication set by Securities and Exchange Board India (SEBI) – „Unrated‟, 0 otherwise. BRi is 1 if the firm i receives an
IR Score greater than the median score of the entire pooled sample – „Best Rated‟, 0 otherwise. „N‟ refers to the total firms categorized according to Market
Capitalization by BSE. The t-statistics are given in the brackets. All variables used are significant at least to 10% significance level.
α βS/A βNPM βUR βBR βS/A*UR βS/A*BR βNPM*UR βNPM*BR R
2 N
(1) (2) (3) (4) (5) (6) (7) (8) (9)
Largecap 1,55 2,56 0,03 -8,70 -1,74 6,12 0,04 0,31 0,08
0,22 113 (0,53) (1,73) (0,22) (1,92) (0,53) (2,05) (0,02) (2,00) (0,70)
Midcap -0,07 3,62 0,04 3,26 1,40 -3,78 -2,57 -0,08 -0,03
0,30 274 (0,15) (9,99) (2,31) (4,79) (1,85) (7,49) (4,03) (3,44) (1,47)
Smallcap 0,99 0,72 0,01 -0,51 -0,15 1,48 0,15 0,06 0,01
0,15 100 (1,75) (1,05) (0,32) (0,45) (0,15) (1,39) (0,14) (1,13) (0,37)
All 0,06 3,21 0,04 2,82 1,03 -2,98 -1,82 -0,05 0,00
0,17 487 (0,13) (8,97) (2,40) (4,22) (1,54) (5,75) (3,14) (2,06) (0,18)

30
Table IV: Value relevance of Effective IR activity: By Sectors
The data sample contains 487 firms listed on Bombay Stock Exchange – BSE India. They are constituents of the BSE500 index and are categorized into 19
sectors by the BSE. The following regression model is estimated:
⁄ ( ⁄
) ( ⁄ ) ( ) ( )
where the dependent variable is Firm Value, as measured by Tobin‟s Qi of the firm i at 31st March 2010, S/Ai is the ratio of Sales to Assets of the firm i at 31
st
March 2010 and NPMi represents the Net Profit Margin of the firm i as on 31st of March 2010. Based on the empirical IR Scoring of the investor relations
home pages of firms, we have divided firms as Unrated („UR’), Best Rated („BR’) and other rated. URi is 1 if the firm i do not follow the mandatory
regulations for Online Investor communication set by Securities and Exchange Board India (SEBI) – „Unrated‟, 0 otherwise. BRi is 1 if the firm i receives an
IR Score greater than the median score of the entire pooled sample – „Best Rated‟, 0 otherwise. „N‟ refers to the total firms categorized according to Sectoral
classifications by BSE. The t-statistics are given in the brackets. All variables used are significant at least to 10% significance level.
α βS/A βNPM βUR βBR βS/A*UR βS/A*BR βNPM*UR βNPM*BR R
2 N
(1) (2) (3) (4) (5) (6) (7) (8) (9)
Agriculture -2,18 0,35 0,93 4,10 1,85 -0,76 2,19 -0,97 -1,07
0,43 19 (0,62) (0,11) (2,37) (0,16) (0,21) (0,06) (0,19) (0,60) (0,70)
Capital Goods 1,75 0,70 -0,01 -1,03 -2,99 0,47 2,20 0,00 0,13
0,24 55 (2,87) (1,05) (0,35) (0,91) (2,25) (0,39) (1,87) (0,05) (2,49)
Chemical & Petrochem. -18,67 8,05 1,56 11,08 18,93 2,94 -4,51 -2,34 -1,63
0,76 15 (2,08) (1,29) (3,99) (0,54) (0,38) (0,14) (0,40) (1,22) (0,54)
Diversified 1,64 -0,39 -0,01 - -0,65 1,55 1,16 0,08 0,01
0,97 15 (3,34) (0,91) (0,27) (1,16) (5,03) (2,18) (2,47) (0,24)

31
Table IV: Value relevance of Effective IR activity: By Sectors (Contd.)
α βS/A βNPM βUR βBR βS/A*UR βS/A*BR βNPM*UR βNPM*BR R
2 N
(1) (2) (3) (4) (5) (6) (7) (8) (9)
Finance 0,71 3,25 0,01 1,63 0,00 -3,50 1,56 -0,02 -0,01
0,21 69 (1,30) (1,30) (0,98) (1,77) (0,00) (1,35) (0,54) (0,78) (0,81)
FMCG -5,41 5,48 0,26 6,70 4,44 -5,69 -3,01 0,11 0,13
0,88 33 (3,40) (10,05) (2,72) (3,16) (1,80) (8,58) (1,68) (0,68) (0,74)
Healthcare 1,31 0,71 0,08 13,17 -5,27 -11,39 1,92 -0,25 0,38
0,62 32 (0,52) (0,33) (0,72) (1,44) (0,99) (1,01) (0,34) (1,77) (2,12)
Housing 0,75 0,69 0,02 1,06 0,44 -0,31 0,85 -0,02 -0,02
0,11 52 (1,11) (0,75) (1,15) (1,20) (0,38) (0,26) (0,53) (0,74) (0,51)
IT 4,78 -1,31 -0,08 -3,19 -3,73 2,16 2,42 0,08 0,16
0,19 37 (1,56) (0,83) (0,64) (0,87) (1,15) (0,64) (1,42) (0,45) (1,13)
Media & Pub 4,79 -2,61 0,10 -4,15 -3,89 4,57 4,56 -0,10 -0,07
0,88 17 (3,40) (0,98) (5,52) (2,44) (2,44) (1,40) (1,62) (3,24) (2,84)

32
Table IV: Value relevance of Effective IR activity: By Sectors (Contd.)
α βS/A βNPM βUR βBR βS/A*UR βS/A*BR βNPM*UR βNPM*BR R
2 N
(1) (2) (3) (4) (5) (6) (7) (8) (9)
Metal -0,34 8,66 0,02 -7,97 2,78 -2,13 -10,69 0,62 0,05
0,42 31 (0,06) (1,28) (0,10) (0,61) (0,30) (0,13) (0,91) (2,20) (0,23)
Oil & Gas 2,54 -0,28 -0,03 - 1,67 5,96 -1,17 -0,02 -0,01
0,88 20 (1,85) (0,35) (0,50) (0,76) (6,65) (0,97) (0,43) (0,07)
Power 2,23 -0,42 -0,02 1,07 -1,06 - 0,50 -0,02 0,03
0,61 18 (8,46) (0,52) (2,85) (0,57) (2,80) (0,59) (0,42) (3,54)
Telecom 1,91 -1,37 0,01 - -0,72 - 2,10 0,32 -0,01
0,55 11 (1,64) (0,67) (0,77) (0,58) (0,99) (0,61) (0,18)
Textile 0,72 0,18 0,01 0,78 0,23 -0,38 - -0,04 -0,03
0,51 9 (0,69) (0,11) (0,10) (0,34) (0,15) (0,11) (0,35) (0,13)
Tourism -1,20 - 0,22 3,01 - - - -0,16 0,02
1,00 5

33
Table IV: Value relevance of Effective IR activity: By Sectors (Contd.)
α βS/A βNPM βUR βBR βS/A*UR βS/A*BR βNPM*UR βNPM*BR R
2 N
(1) (2) (3) (4) (5) (6) (7) (8) (9)
Transport Equipment -0,67 0,90 0,29 - 0,71 -0,32 0,03 -0,11 -0,15
0,59 24 (0,33) (0,71) (3,32) (0,31) (0,25) (0,02) (0,35) (1,11)
Transport Services 0,74 1,06 0,02 -4,46 1,82 20,86 -3,16 -0,26 0,23
0,82 17 (0,32) (0,27) (0,22) (1,07) (0,57) (2,92) (0,66) (0,56) (1,66)
Consumer durables -0,73 1,11 0,21 - - - 0,78 - -0,11
0,76 8 (0,35) (0,37) (0,33) (0,23) (0,12)
Table V: Correlation Matrix of variables used
Tobin's Q Sales/Assets Net Profit margin
Tobin's Q 1
Sales/Assets 0,30 1
Net Profit margin 0,05 -0,20 1
34
Table VI: Interaction multiples: By Market capitalization
The coefficients from the regression are used to analyze the interaction between the independent variables and to deduce the
outcome of effective investor relations on them. The explanation „unrated‟ to „other rated‟ explains the effect of moving
from no or minimal IR activity to adopting an average IR activity on respective multiples. In the same way „other rated‟ to
„best rated‟ explains the effect of moving from an average IR activity to embracing best practice IR activities on respective
multiples.
Sales/Assets Net Profit Margin
„unrated‟ to ‟other
rated‟
„other rated‟ to „best
rated‟
„unrated‟ to ‟other
rated‟
„other rated‟ to „best
rated‟
Largecap -2,39 0,02 -12,08 3,31
Midcap 1,04 -0,71 2,2 -0,87
Smallcap -2,05 0,2 -8,13 1,99
All 0,93 -0,57 1,32 -0,1

35
Table VII: Interaction multiples: By Sectors
Sales/Assets Net Profit Margin
Unrated to Other
Rated
Other Rated to Best
Rated
Unrated to Other
Rated
Other Rated to Best
Rated
Agriculture 2,18 6,30 1,04 -1,15
Capital Goods -0,68 3,14 0,21 -18,23
Chemical &
Petrochemical -0,37 -0,56 1,50 -1,04
Diversified 4,01 -3,00 7,72 -1,01
Finance 1,08 0,48 1,60 -0,96
FMCG 1,04 -0,55 -0,44 0,51
Healthcare 16,02 2,71 2,99 4,54
Housing 0,44 1,22 0,87 -1,28
IT 1,64 -1,84 0,95 -1,87
Media & Pub 1,75 -1,75 0,99 -0,67
Metal 0,25 -1,23 -32,62 2,63
Oil & Gas 21,57 4,24 -0,69 0,17
Power - -1,18 -1,06 -1,73
Telecom - -1,53 -22,20 -0,36
Textile 2,08 - 4,98 -4,23
Tourism 0,00 0,00 0,74 0,11
Transport Equipment 0,36 0,03 0,36 -0,49
Transport Services -19,76 -3,00 10,34 9,19
Consumer durables - 0,70 - -0,54