Investor Protection and Earnings Management: An ...d1c25a6gwz7q5e.cloudfront.net/papers/1045.pdf ·...
35
Investor Protection and Earnings Management: An International Comparison # Christian Leuz The Wharton School of the University of Pennsylvania, Philadelphia, PA 19104 [email protected] Dhananjay Nanda University of Michigan Business School, Ann Arbor, MI 48109 [email protected] Peter D. Wysocki MIT Sloan School of Management, Cambridge, MA 02142 [email protected] May 2002 (First Draft: October 1999) Abstract This paper examines the relation between outside investor protection and earnings management. We argue that insiders, in an attempt to protect their private control benefits, use earnings management to conceal firm performance from outsiders. We hypothesize that earnings management decreases in investor protection because strong protection limits insiders’ ability to acquire private control benefits and hence reduces their incentives to mask firm performance. Using accounting data from 31 countries between 1990 and 1999, we present empirical evidence consistent with this hypothesis. Our result points to an important link between legal institutions, private control benefits and the quality of accounting earnings reported to capital market participants. These findings complement prior finance research that generally treats the quality of corporate reporting as exogenous. JEL classification: G34; G38; M41 Key Words: Corporate governance; Earnings management; Investor protection; Private control benefits; Law # The paper has benefited from presentations at the Duke/UNC Fall Camp, the EAA meetings in Munich and Athens, the 11 th FEA conference at the University of Michigan, Goethe University Frankfurt, MIT, New York University, University of Vasa, the Wharton School, and the College of William and Mary. We are grateful to Stan Baiman, Sudipta Basu, Phil Berger, Simeon Djankov, Richard Frankel, Wayne Guay, David Larcker, Christian Laux, Martien Lubberink, Bill Schwert, Ross Watts, and especially Bob Holthausen and the anonymous referee for helpful comments.
Transcript of Investor Protection and Earnings Management: An ...d1c25a6gwz7q5e.cloudfront.net/papers/1045.pdf ·...

Investor Protection and Earnings Management:
An International Comparison#
Christian Leuz
The Wharton School of the University of Pennsylvania, Philadelphia, PA 19104 [email protected]
Dhananjay Nanda
University of Michigan Business School, Ann Arbor, MI 48109 [email protected]
Peter D. Wysocki
MIT Sloan School of Management, Cambridge, MA 02142 [email protected]
May 2002 (First Draft: October 1999)
Abstract This paper examines the relation between outside investor protection and earnings management. We argue that insiders, in an attempt to protect their private control benefits, use earnings management to conceal firm performance from outsiders. We hypothesize that earnings management decreases in investor protection because strong protection limits insiders’ ability to acquire private control benefits and hence reduces their incentives to mask firm performance. Using accounting data from 31 countries between 1990 and 1999, we present empirical evidence consistent with this hypothesis. Our result points to an important link between legal institutions, private control benefits and the quality of accounting earnings reported to capital market participants. These findings complement prior finance research that generally treats the quality of corporate reporting as exogenous.
JEL classification: G34; G38; M41
Key Words: Corporate governance; Earnings management; Investor protection; Private control benefits; Law
# The paper has benefited from presentations at the Duke/UNC Fall Camp, the EAA meetings in Munich and Athens, the 11th FEA conference at the University of Michigan, Goethe University Frankfurt, MIT, New York University, University of Vasa, the Wharton School, and the College of William and Mary. We are grateful to Stan Baiman, Sudipta Basu, Phil Berger, Simeon Djankov, Richard Frankel, Wayne Guay, David Larcker, Christian Laux, Martien Lubberink, Bill Schwert, Ross Watts, and especially Bob Holthausen and the anonymous referee for helpful comments.

1
1. Introduction
The legal protection of outside investors has been identified as a key determinant of
financial market development, capital and ownership structures, dividend policies, and private
control benefits around the world (see Shleifer and Vishny, 1997 and La Porta et al, 2000a).
Extant work, however, has paid scant attention to the relation between legal protection and the
quality of financial information reported by insiders, namely managers and controlling
shareholders, to outsiders, namely the firm’s minority (or arm’s length) shareholders and
creditors.1 Reporting firm performance in a “true and fair” manner is critical for effective
corporate governance because it allows outsiders to monitor their claims and exercise their rights
(see, for example, OECD Principles of Corporate Governance, 1999).
In this paper, we highlight legal protection as a key primitive affecting the quality of
firms’ earnings. Strong and well-enforced outsider rights limit the acquisition of private control
benefits, and consequently, mitigate insiders’ incentives to manage accounting earnings, as
insiders have little to conceal from outsiders. This insight motivates our primary hypothesis that
the pervasiveness of earnings management is decreasing in legal protection. Our empirical
findings are consistent with this hypothesis.
Following Healy and Wahlen (1999), we define earnings management as the alteration of
firms’ reported economic performance by insiders to either “mislead some stakeholders” or to
“influence contractual outcomes.” We argue that incentives to misrepresent firm performance
through earnings management arise from a conflict of interest between the firms’ insiders and
1 While previous work acknowledges the importance of accounting information, it generally treats the quality of
this information as exogenous (e.g., La Porta et al., 1998). Furthermore, it is important to distinguish between stated accounting rules and firms’ actual reporting practices. Even though accounting standards likely affect the quality of reported earnings, they can and often are circumvented by insiders (see also Ball et al., 1999).

2
outsiders.2 Specifically, insiders use their control over the firm’s resources to benefit themselves
at the expense of outsiders. If these private control benefits are detected, outsiders are likely to
take disciplinary actions against insiders. Consequently, insiders have an incentive to conceal
these resource diversions from outsiders.3 We argue that insiders manipulate accounting reports
of firm performance in an attempt to hide their private control benefits. For instance, insiders
can use their discretion in financial reporting to overstate earnings and conceal unfavorable
earnings realizations (e.g., losses) that would prompt outsider interference. Similarly, insiders
can use accounting choices to understate earnings in years of good performance to create
reserves for periods of poor future performance, effectively making reported earnings less
variable than true firm performance. Outsiders’ ability to govern a firm is weakened when
extensive earnings management results in financial reports that inaccurately reflect firm
performance.
The effectiveness of a country’s legal system in protecting minority shareholders and
outside creditors limits insiders' ability to acquire private control benefits (e.g., Claessens et al.,
2000a; Nenova, 2000; Dyck and Zingales, 2002). Strong legal protection increases insiders’
costs of diverting resources (e.g., Shleifer and Vishny, 1997; La Porta et al., 2000a; Shleifer and
Wolfenzon, 2000). We argue that insiders’ incentive to conceal their private control benefits
decreases in the legal system’s effectiveness in protecting outside investor interests. Thus, our
primary hypothesis is that earnings management decreases in legal protection because strong
investor protection limits the acquisition of private control benefits, which reduces insiders’
incentives to obfuscate performance.
2 We acknowledge that there may be other reasons to manage earnings. Our analysis, however, highlights the
central importance of legal investor protection in explaining differences in earnings management across countries.
3
This hypothesis is tested using financial accounting and institutional data for a sample of
firms from 31 countries (from 1990 to 1999) with substantial variation in investor protection
laws and enforcement activities. We create four related proxies to measure the pervasiveness of
earnings management in a country. The measures capture the extent to which insiders manage
the “accounting” component of reported earnings to smooth or mask the firm’s economic
performance, and together proxy for the level of earnings management in a country.
Our analysis begins with a descriptive country cluster analysis, which groups countries
with similar legal and institutional characteristics. Three distinct country clusters are identified:
(1) outsider economies with strong legal enforcement (e.g., UK and US); (2) insider economies
with strong legal enforcement (e.g. Germany and Japan); and, (3) insider economies with weak
legal enforcement (e.g., Italy and India). The clusters closely parallel simple code/common-law
and regional characterizations used in prior work (e.g., La Porta et al., 1997; Ball et al. 2000).
Outsider economies with strong enforcement display the lowest and insider economies with
weak enforcement the highest level of earnings management. That is, earnings management
appears to be lower in economies with strong investor protection, large stock markets, dispersed
ownership, and strong legal enforcement.
To relate earnings management more explicitly to the level of investor protection, we
undertake a multiple regression analysis. Outside investor protection is measured by the extent
of minority shareholder rights as well as the quality of legal enforcement. Our results show that
earnings management is negatively related to outsider rights and legal enforcement. These
results are robust after controlling for differences in economic development, macroeconomic
3 Note that even in countries with poor outsider investor protection laws, outsiders generally have some form of
legal recourse in cases of blatantly obvious and verifiable expropriation. Thus, unless a legal system fails completely, insiders face some legal risks and hence have incentives to hide their profit diversions.

4
stability, industry composition and firm characteristics across countries. Tests that account for
the endogeneity of investor protection and other institutional factors, such as differences in the
accounting rules or ownership concentration, provide further evidence that investor protection is
a key determinant of earnings management activity across countries. We also provide direct
evidence that earnings management is positively associated with the level of private control
benefits enjoyed by insiders.
This study builds on recent advances in the corporate governance literature on the role of
legal protection in financial market development, ownership structures, and private control
benefits (e.g., Shleifer and Vishny, 1997; La Porta et al., 2000a). We extend this literature by
presenting evidence that the level of outside investor protection endogenously determines the
quality of financial information reported to outsiders. These results add to our understanding of
how legal protection influences the agency conflict between outsider investors and controlling
insiders. Weak legal protection appears to result in poor-quality financial reporting, which is
likely to undermine the development of arm’s length financial markets.
Our work also contributes to a growing literature on international differences in firms’
financial reporting. Prior research has analyzed the relation between earnings and stock prices
around the world, only implicitly accounting for international differences in institutional factors
(e.g., Alford et al., 1993; Joos and Lang, 1994; Land and Lang, 2000). Our results suggest that a
country’s legal and institutional environment fundamentally influences the properties of reported
earnings. In this regard, our study complements the recent work by Ball et al. (1999 and 2000),
Fan and Wong (1999), Ali and Hwang (2000), and Hung (2001), which documents that various

5
institutional factors explain differences in the price-earnings association across countries.4
However, the price-earnings association reflects both differences in the pricing mechanism and
earnings management. Thus, it is important to understand the effect of institutional factors on
reported earnings when examining the relation between stock prices and “managed” earnings.
The remainder of the paper is organized as follows. Specific hypotheses are developed in
section 2. Section 3 describes the construction of the earnings management measures. In section
4, we describe the sample and provide descriptive statistics. Empirical tests and results are
presented in section 5. Section 6 concludes.
2. Earnings management, private control benefits and investor protection
In this section, we argue that international differences in incentives to misrepresent firm
performance arise from a conflict of interest between the firms’ insiders and outsiders, i.e., the
incentive of insiders to acquire private control benefits, effectively expropriating outsiders.
Recent advances in the corporate governance literature suggest that this agency conflict is
widespread around the world and affected by a country’s legal structure (e.g., Shleifer and
Vishny, 1997; La Porta et al., 1999 and 2000a; Claessens et al., 2000b).
2.1. Private control benefits and hiding incentives
A benefit of acquiring control in a firm is that controlling parties, such as majority
owners or managers, need not share gains with all the firms’ owners. Examples of private
control benefits are wide-ranging. They include the “psychic” value of being in charge and fairly
facile forms of profit diversion such as perquisite consumption. At the other end of the
spectrum, private control benefits include outright theft or transfer of firm assets to other firms
4 See also Basu et al. (1998) and Hope (2002) for work on properties of analyst forecasts related to institutional

6
owned by insiders and their family members. The common theme is that some value is enjoyed
exclusively by insiders and not shared with non-controlling outsiders.
As a consequence, controlling insiders have incentives to conceal their private control
benefits from non-controlling parties, i.e. outside investors (see also Zingales, 1994; Shleifer and
Vishny, 1997). If these private control benefits are detected, outsiders are likely to take
disciplinary actions against insiders. We therefore argue that managers and controlling owners
have an incentive to manage earnings in order to conceal the firm’s true performance from
outsiders.5 For example, insiders can use their financial reporting discretion to overstate
earnings and conceal unfavorable earnings realizations (e.g., losses) that would prompt outsider
interference. Insiders can also use accounting choices to understate earnings in years of good
performance to create reserves for future poor periods; effectively making firm earnings less
variable than its economic performance. Thus, insiders can reduce the likelihood of outside
intervention by masking their private control benefits through the management of the level and
the variability of reported earnings.6
2.2. The role of investor protection
In order to limit insiders’ private control benefits, outside investors design contracts that
confer them rights to discipline insiders (e.g., to replace managers).7 However, outsiders must
rely on their country’s legal system to enforce these contracts (La Porta, et. al., 1998). Legal
factors.
5 Note that we do not claim that managers always use their discretion to reduce the informativeness of financial reports. In fact, the evidence in US suggests that on average managers use their discretion in a way that increases the informativeness of earnings (e.g., Watts and Zimmerman, 1986). These findings, however, may be the result of an effective outside investor protection and therefore may not extent to countries with weak investor protection.
6 There is no end to the stories where insiders attempt to conceal poor performance and expropriation through financial statement manipulation. Well known examples include the well-publicized Bank of Credit and Commerce International (BCCI) embezzlement and accounting fraud scandal in the early 1990’s and the recent allegations of multi-billion dollar asset diversions at Korean Daewoo Motors.

7
systems protect investors’ property rights by enacting and enforcing laws that enable a firm to
contract with outside investors. For instance, shareholders are paid dividends because they can
vote to replace their firms’ managers and directors, and creditors are repaid because the law
enables them to repossess firm assets in case of default. Recent research documents that
effective outside investor protection limits insiders’ ability to acquire private control benefits. La
Porta et al. (2000b) show that higher dividend payouts are associated with stronger minority
shareholder protection. Claessens et al. (2000a), Nenova (2000), and Dyck and Zingales (2002)
find that private control benefits are negatively associated with stronger outsider protection and
legal enforcement.
As effective outside investor protection limits insiders’ ability to acquire private control
benefits, it also reduces insiders’ need to conceal their activities. We hypothesize that earnings
management is more pervasive in countries with weak legal protection of outside investors
because insiders enjoy greater private control benefits and hence have stronger incentives to
obfuscate firm performance. Following La Porta et al. (1998), we distinguish between the legal
rights accorded to outside investors and the quality of their enforcement. The strength of laws
that protect minority rights and their enforcement via the judicial system are complementary
legal structures and hence are both hypothesized to be negatively associated with earnings
management.
2.3. Competing effects
In the preceding discussion, we argue that outside investor protection is a key primitive
that affects insiders’ earnings management activities across countries. A number of other factors
7 Outsiders are also expected to price protect themselves, leading to more internal financing, smaller arm’s length
financial markets and higher cost of outside capital. See La Porta et al. (1997) and Bhattacharya et al. (2002).

8
are purported to affect earnings quality at the country level. These factors can be broadly
categorized as essentially exogenous factors, such as industry composition, and arguably
endogenous factors, such as accounting standards and ownership structure. We attempt to
explicitly control for exogenous factors, such as industry composition and macroeconomic
stability, in our empirical analyses.
While accounting standards and ownership structure are important factors correlated with
observed earnings management activities, it is unclear whether they are fundamental primitives.
In our view, low earnings management, well-functioning markets for outside capital and
dispersed ownership patterns are joint outcomes of strong investor protection. Prior work shows
that investor protection is the key primitive that explains corporate choices, such as firms’
financing and dividend policies as well as ownership structures (e.g., La Porta et al. 1997, 1999,
2000a). Accounting rules likely reflect the influence of a country’s legal and institutional
framework and are therefore endogenous in our analysis.8 Countries with strong outsider legal
protection are expected to enact and enforce accounting and securities laws that limit the
manipulation of accounting information reported to outsiders. Consistent with this view,
Enriques (2000) argues that UK and the US laws on director self-dealing are stricter and are
more reliant on disclosure than those in Germany or Italy. Similarly, d’ Arcy (2000) shows that
Anglo-American countries have stricter accounting rules with respect to accounting choices than
do Continental-European countries with less effective investor protection. Moreover, the extent
to which accounting rules limit insiders’ ability to engage in earnings management depends on
how well these rules are enforced. While accounting standards can affect the reliability of
financial reports, their impact is diminished in the face of weak legal enforcement. Ultimately,

9
however, the relative importance and impact of various institutional factors on firms’ earnings
management activities is an empirical issue. We therefore explore the role of other institutional
factors in our empirical analysis.
Finally, we note that strong investor protection may potentially encourage earnings
management because insiders have greater incentive to hide their private control benefits when
faced with higher penalties. Conversely, insiders have little incentive to conceal their diversions
if outsiders cannot penalize these activities. We acknowledge this potentially confounding
effect. One may argue that the penalty effect is likely to be dominated by international
differences in private control benefits as suggested by our primary hypothesis. To resolve this
issue, we appeal to the data.
3. Earnings management measures
This section develops the earnings management measures that are used to examine the
relation between investor protection and the quality of accounting information reported to
outside investors. Much of the measure construction relies on the existing earnings management
literature (see Healy and Wahlen, 1999; Dechow and Skinner, 2000). We analyze four different
measures of earnings management because insiders can exercise their discretion along a number
of different dimensions and the discretion afforded them varies across countries. The earnings
management measures reflect both the level and variability of reported earnings. Our approach
captures the outcomes of earnings management activities and sidesteps the problem that
countries’ stated accounting rules often lack enforcement and hence do not reflect insiders’
actual reporting practices (see also Ball et al., 1999).
8 Note that for this reason, we define earnings management relative to unmanaged firm performance and not relative
to a particular set of accounting rules.

10
3.1. Smoothing reported operating earnings using accruals
Insiders can hide changes in the firm’s economic performance using both real operating
decisions and financial reporting choices. To focus on insiders’ reporting choices, the first
smoothing measure captures the degree to which insiders alter the “accounting” component of
earnings, namely accruals, to reduce the variability of reported earnings. The measure is
computed as the country’s median ratio of the firm-level standard deviation of operating earnings
divided by the standard deviation of cash flow from operations.9 A low value of this measure,
ceteris paribus, indicates insiders’ exercise of accounting discretion to smooth reported earnings.
Cash flow from operations is computed indirectly by subtracting the accrual component
from earnings because direct information on firms’ cash flows is not widely available in many
countries. Following the approach of Dechow et al. (1995), we compute the accrual component
of earnings as:
( ) ( ) ititititititit DepTPSTDCLCashCAAccruals −∆−∆−∆−∆−∆= (1)
where ∆CAit = change in total current assets, ∆Cashit = change in cash/cash equivalents,
∆CLit = change in total current liabilities, ∆STDit = change in short-term debt included in current
liabilities, ∆TPit = change in income taxes payable, Depit = depreciation and amortization
expense. Changes in short-term debt are excluded from accruals because they relate to financing
transactions as opposed to operating activities. If a firm does not report information on taxes
payable or short-term debt, then the change in both variables is assumed to be zero.
9 Dividing by the cash flow from operations controls for differences in the variability in firms’ economic
performance. In subsequent sections, we provide robustness checks investigating the validity of this approach.

11
3.2. Smoothing and the correlation of accounting accruals and operating cash flows
Insiders wishing to conceal firm performance can use accounting discretion to offset
economic shocks to the firm’s operating cash flow. They can undo negative shocks to hide poor
performance or offset positive shocks to create “hidden reserves” for the future. In both cases,
the use of accounting accruals to buffer cash flow shocks results in a negative correlation
between changes in accruals and operating cash flows (see Skinner and Myers, 1999). While a
negative correlation is also a “natural” result of accrual accounting, the magnitude of this
negative correlation, ceteris paribus, indicates opportunistic smoothing of reported earnings that
does not reflect a firm’s underlying economic performance.10 Therefore, the contemporaneous
correlation between the change in accounting accruals and the change in operating cash flows is
the second measure of earnings smoothing. The correlation is computed over the pooled set of
firms in each country and the accrual and operating cash flow components of earnings are
computed as in equation (1).
3.3. Discretion in reported earnings: The magnitude of accruals
Apart from dampening fluctuations in firm performance, insiders can use their reporting
discretion to simply misstate the firm’s economic performance. For instance, insiders can
overstate reported earnings to achieve certain earnings targets or report an extraordinary
performance in specific instances, such as an equity issuance (see, e.g., Dechow and Skinner,
2000). The third measure uses the magnitude of accruals as a proxy for the amount of discretion
exercised by insiders. It is computed as the country’s median ratio of the absolute value of
10 Under the reasonable assumption that accounting systems on average underreact to economic shocks, insiders
wishing to reveal the firm’s economic performance are likely to use accruals in a way that results in a less negative (or in some cases even positive) correlation.

12
accruals scaled by the absolute value of the firm’s cash flow from operations. Scaling controls
for differences in firm performance (and size).
3.4. Discretion in reported earnings: Small loss avoidance
Degeorge et al. (1999) and Burgstahler and Dichev (1997) present evidence that US
managers use accounting discretion to avoid reporting small losses. While one may argue that
managers have an incentive to avoid losses of any size, they have limited reporting discretion
and hence are unable to report profits in the presence of large losses. Small losses, however, are
more likely to lie within the bounds of insiders’ reporting discretion and can be avoided at
relatively low cost. Thus, in each country, the ratio of small reported profits to small reported
losses reflects the extent to which firm insiders exercise discretion to avoid reporting losses.
Following Burgstahler and Dichev (1997), the ratio of “small” profits to “small” losses is
computed, for each country, using after-tax earnings scaled by total assets. Small losses are
defined to be in the range [-0.01, 0.00) and small profits are defined to be in the range [0.00,
0.01]. In order to reliably compute this ratio, we require at least 5 observations of small losses
for a country to be included in the sample.11
3.5. Aggregate measure of earnings management
Finally, to mitigate potential measurement error, we construct an overall summary
measure of earnings management for each country. For each of the four earnings management
measures, countries are ranked such that a higher score suggests a higher level of earnings
management. An aggregate earnings management measure is computed by averaging the ranks
of the four individual earnings management measures.
11 Three countries (Chile, New Zealand, Turkey) do not meet this criterion and hence are dropped.

13
4. Sample selection and descriptive statistics
Our data are obtained from the Worldscope database, which contains up to ten years of
historical financial data from home-country annual reports of publicly traded companies around
the world. Banks and financial institutions are excluded from the empirical analysis. To be
included in the sample, a country must have at least 300 firm-year observations for a number of
accounting variables, including total assets, sales, net income, and operating income. Each firm
must have income statement and balance sheet information for at least 3 consecutive years.
Finally, three countries with hyperinflation over the sample period are excluded because high
inflation may unduly affect the earnings management measures.12 The final sample consists of
70,955 firm-year observations for the fiscal years 1990-99 across 31 countries and 8,616 non-
financial firms.
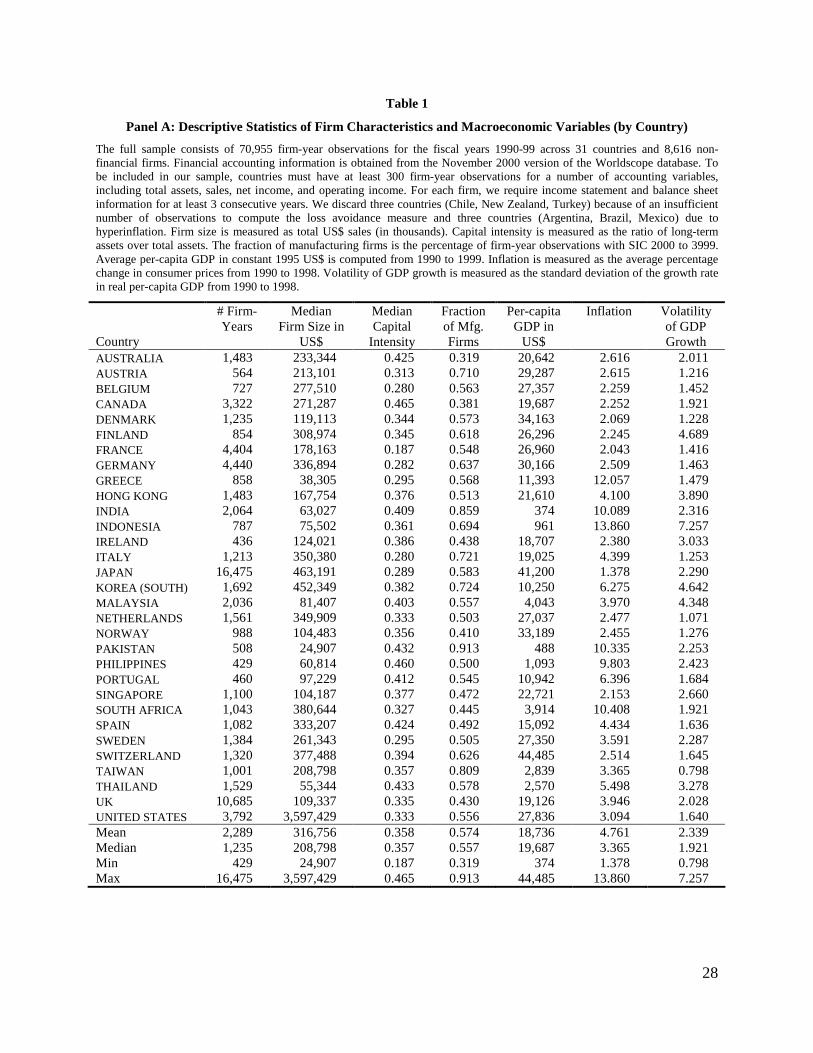
Panel A of Table 1 presents the number of firm-year observations per country as well as
descriptive statistics of firm characteristics and macroeconomic variables for each country.
There is significant variation in the number of firm-year observations across countries due to
differences in capital market development, country size, and the availability of complete
financial accounting data.13 To allow for direct firm-size comparisons across countries, the
country median of firms’ sales in $US is reported. Based on the large differences in the median
firm size across countries, we scale all financial variables by the lagged value of total assets.14
There is also substantial cross-country variation in capital intensity, the fraction of
manufacturing firms, per-capita GDP, inflation and volatility of growth. We address the
12 We eliminate Argentina, Brazil and Mexico. The inflation rates for these countries were considerably higher than
any other country in the sample, which is likely to increase the volatility of their accounting numbers and hence lead to low rankings for the smoothness measures. The results, however, are qualitatively unchanged if these countries remain in the sample.
13 Note that the Worldscope database currently includes only US firms that belong to the S&P 500. 14 Scaling by lagged sales instead does not affect the results.

14
potential confounding effects of cross-country differences in these variables in the multiple
regressions.
Panel B of Table 1 provides summary information on the key legal protection and
institutional variables for each country in the sample. All institutional variables are drawn from
data used by La Porta et al. (1997 and 1998). The legal origin and legal tradition assignments are
presented in columns 2 and 3 of Panel B. The proxy for outside investor rights is an “anti-
director rights” index that captures the aggregate rights of minority shareholders. Belgium,
Germany and Italy rate low on this index while Canada, the United Kingdom and the United
States have a high rating. The legal enforcement measure for each country is the mean score
across three variables, each ranging from zero to ten: (1) an index of the legal system’s
efficiency, (2) an index of the rule of law, and (3) the level of corruption. Scandinavian
countries have the highest level of enforcement while countries like Indonesia, Pakistan and the
Philippines have the lowest. The “importance of equity markets” is measured by the mean rank
across (1) the ratio of the aggregate stock market held by minorities to gross national product, (2)
the number of listed domestic stocks relative to the population, and (3) the number of IPOs
relative to the population. Ownership concentration is measured as the median percentage of
common shares owned by the largest three shareholders, in the ten largest privately owned non-
financial firms. Finally, the disclosure index measures the inclusion or omission of 90
accounting items in firms’ 1990 annual reports and hence captures firms’ disclosure policies.
Panel A of Table 2 provides descriptive statistics on the four individual earnings
management measures as well as the aggregate earnings management score. The countries are
sorted in descending order based on the calculated aggregate earnings management measure.
The first smoothing measure (EM1) shows that operating income is less variable than operating

15
cash flows in all countries. The second smoothing measure (EM2) indicates that changes in
accounting accruals and operating cash flows are significantly negatively correlated in all
countries. Given the nature of the accrual accounting process, and the fact that all countries use
accrual accounting, these findings are not surprising. However, there appears to be a systematic
pattern in the relative magnitude of these measures across countries. For example, the first
measure (EM1) suggests that earnings are smoother (relative to cash flows) in a weak investor
protection country, such as South Korea, than in a high investor protection country, such as the
US. Similarly, firms in low investor protection countries, such as India or Greece, exhibit a
greater negative correlation between changes in accruals and cash flows (EM2) than do firms in
the US. The first discretion measure (EM3) shows that the relative magnitude of accruals to the
magnitude of operating cash flows is small in countries like the UK or the US compared to
countries like Austria, Belgium or Germany. The second discretion measure reveals that all
countries exhibit some degree of loss avoidance, as EM4 is always greater than one. The cross-
country variation in this measure is consistent with the pattern depicted by the other measures.15
The measures EM1-EM4 are highly correlated and the rankings corresponding to the four
individual and the aggregate earnings management measures are very similar. Factor analysis
suggests that there is only one factor in the four earnings management measures. Thus, it seems
appropriate to combine all four variables into a summary measure for earnings management as
described in the previous section.16 The last column of Panel A presents a country ranking based
on this aggregate earnings management measure, showing high ranks for countries such as
Austria, Germany and Italy, and low ranks for countries like Australia, the UK and the US.
15 While our loss avoidance results appear to be in contradiction with those of Brown and Higgins (2001), note that
their earnings surprise measure is computed based on analyst forecasts. Thus, cross-country differences in managing analysts’ expectations may explain the divergence in our and their findings.

16
The simple correlations among institutional variables and the aggregate earnings
management measure for each country are presented in Panel B of Table 2. Consistent with our
main hypothesis, there is a strong negative correlation between the aggregate earnings
management measure and both the outside investor rights and enforcement proxies. However,
there are also significant correlations between the earnings management measure and other
institutional factors, suggesting that earnings management is greater in countries where stock
market play a lesser role, ownership is more concentrated and disclosure levels are low. The
following empirical analysis attempts to control for these correlations.
5. Empirical results
5.1. Descriptive cluster analysis
We begin with a cluster analysis that provides descriptive evidence on systematic patterns
in earnings management across groups of countries with similar institutional characteristics. The
aim of this analysis is to identify institutional clusters, i.e., countries with similar institutional
features such as legal investor protection, stock market development and ownership
concentration. This approach, while being descriptive in nature, captures interactions among
institutional factors and documents systematic patterns in earnings management without relying
on specific hypotheses.
Nine institutional variables used in La Porta et al. (1997 and 1998) are employed in the
cluster analysis.17 The variables are standardized to z-scores and a k-means cluster analysis with
16 We confirmed and reported in an earlier version of this paper that our results also hold for the smoothing and
discretion measures separately as well as the single factor identified by factor analysis. 17 We use the individual stock market and enforcement variables created by La Porta et al. (1997 and 1998) prior to
the aggregation presented in Table 1. An analysis based on the five institutional variables presented in Table 1 produces qualitatively similar results. However, for cluster analysis, it is generally preferable to have a large set of variables, which is why we avoid the aggregation of the stock market and enforcement variables.

17
three distinct country clusters is conducted. Panel A of Table 3 reports the means of each
institutional variable for each of the three clusters. The first cluster is characterized by large
stock markets, low ownership concentration, extensive outsider rights, high disclosure and strong
legal enforcement. The second and third clusters show markedly smaller stock markets, higher
ownership concentration, weaker investor protection, lower disclosure levels and weaker
enforcement. Based on their institutional characteristics, we refer to countries in the first cluster
as “outsider (or arm’s length) economies”. Compared to the first cluster, the countries in the
second and third cluster are referred to as “insider economies.”18 What distinguishes the second
and the third clusters is the quality of legal enforcement. Overall, the results in panel A are
consistent with the existence of institutional complementarities.
Panel B of Table 3 shows the cluster membership of the sample countries. Groupings are
consistent with the common- and code-law as well as regional distinctions used in prior research
to classify countries (see, e.g., Ball et al. 1999 and 2000). As indicated in Panel B, all countries
in the first cluster with the exception of Norway have a common-law tradition. The three
Southeast Asian countries (Hong Kong, Malaysia, and Singapore) in this cluster were formerly
under British rule and have inherited parts of the Anglo-Saxon institutional framework.19 In the
second cluster, all countries, except Ireland and South Africa, have a code-law tradition. This
cluster contains most of the Northern European and Scandinavian countries. The third cluster
consists of several Asian and Southern European countries with both common- and code-law
traditions. Thus, the cluster approach suggests that the common and code law distinction only
18 While cluster 2 seems generally between cluster 1 and 3, a comparison of the Euclidean distances between the
cluster centers supports our interpretation that cluster 2 and 3 are closer to each other than cluster 1 and 2. 19 The fact that the three East Asian countries in this group have by far the worst earnings management ratings is
consistent with Ball et al. (1999). They argue that, despite the common-law influence, reported earnings do not exhibit common-law properties with respect to (asymmetric) timeliness. See also Fan and Wong (1999) for similar findings.

18
matters when legal enforcement is reasonably high, as in the first and second cluster. In the third
cluster, where the quality of legal enforcement is low, legal tradition does not seem to be a
determinant of cluster membership.
Panel C of Table 3 shows that the differences between the cluster means of the aggregate
earnings management measure are statistically significant. Outsider economies (cluster 1)
exhibit lower levels of earnings management than insider economies (clusters 2 and 3). Thus,
even after controlling for interactions among various institutional factors, earnings management
continues to be lower in economies with strong investor protection, large stock markets and
dispersed ownership. Highlighting the salient importance of legal enforcement, the third cluster
exhibits significantly higher earnings management than the second cluster.
5.2. The role of investor protection: Multiple regression analysis
The previous analyses suggest that earnings management is systematically related to
countries’ institutional characteristics. A key issue, however, is which institutional factors are
primary determinants of earnings management and which of them are correlated outcomes. We
posit that better investor protection results in less earnings management because insider enjoy
fewer private control benefits and hence have lower incentives to hide firm performance from
outside investors. This hypothesis ties in closely with the findings in Nenova (2000) and Dyck
and Zingales (2002) suggesting that private control benefits decrease in the level of investor
protection. It also builds on the work of La Porta et al. (1997 and 1999) suggesting investor
protection as a key primitive in explaining the development of capital markets and ownership
concentration. In our view, low earnings management, large arm’s length capital markets and

19
dispersed ownership patterns are complements and joint outcomes of strong investor
protection.20
Our multiple regressions therefore examine the relation between earnings management
and investor protection. Column 1 of Table 3 reports a rank regression using the aggregate
earnings management measure as the dependent variable.21 Results show that outside investor
protection explains a substantial portion (39%) of the variation in the earnings management
measure. Outsider rights and legal enforcement both exhibit a significant negative association
with earnings management.
The multiple regressions, however, assume that outside investor rights and legal
enforcement are exogenous variables. If, on the other hand, outsider protection and earnings
management are simultaneously determined, our results suffer from an endogeneity bias. We
address this concern by using countries’ legal origins and wealth as instruments for the investor
protection variables as suggested by Levine (1999). While related to the level of investor
protection (see La Porta et al., 1998), a country’s legal origin can be considered as predetermined
and exogenous to our analysis because the origins of most legal systems are several centuries old
and many countries obtained their legal system through occupation and colonization. We use
three dummy variables, indicating English, French, German and Scandinavian legal origins, as
instrumental variables. In addition, we use a country’s average per-capita GDP, measured prior
to our sample period from 1980 to 1989, as an instrument because it is costly to create and
20 La Porta et al. (1997 and 1999) treat the level of disclosure as an exogenous factor in explaining financing and
ownership patterns. Our results, however, suggest that the quality of reported earnings and financial disclosures is likely to be endogenous and hence a joint outcome.
21 As several of our variables are essentially rank measures, we report rank regressions. OLS regressions of the aggregate earnings management measure (or alternatively an earnings management factor extracted from EM1-4) on the unranked institutional variables yield similar results.

20
maintain an effective legal infrastructure and hence a country’s wealth potentially influences the
level of legal enforcement.
Column 2 of Table 4 reports results from a two-stage least squares regressions.22 The
relation between outside investor protection and earnings management does not appear to be
affected by the endogeneity of investor protection. The findings support our primary hypothesis
that the pervasiveness of earnings management decreases in the level of investor protection.
Finally, we attempt to provide some more direct evidence that insiders’ private control
benefits and earnings management activities are in fact positively associated as implied by our
main hypothesis. The problem in documenting this relation is that large private control benefits
and extensive earnings management are hypothesized to be joint outcomes of poor investor
protection. For this reason, we adopted a “reduced-form” approach for the primary analysis by
using the investor protection variables.
An alternative approach is to estimate the relation between earnings management and
private control benefits, accounting for the results in Nenova (2000) and Dyck and Zingales
(2002) that investor protection partly determines the level of private control benefits. We use the
mean block premium estimated by Dyck and Zingales (2002) as a proxy for the level of private
control benefits, which has been shown to be negatively associated with both outsider rights and
legal enforcement. Accounting for these associations, we estimate a two-stage least squares
regression of the aggregate earnings management measure on the control benefits proxy using
the level of outsider rights and legal enforcement as instruments. The results presented in
22 To be consistent with column 1, we again use ranks of the outsider rights, legal enforcement and per-capita GDP
variables. Results from two-stage regressions without ranking right-hand side variables are very similar.

21
column 3 of Table 5 show that earnings management and private control benefits exhibit a
significantly positive association.
5.3. Robustness Checks
Prior work shows that per-capita GDP explains differences in observed financing,
ownership, and payout policies across countries. Consequently, we re-estimate our primary
regressions using contemporaneous per-capita GDP as an additional explanatory variable (not
reported). While GDP is marginally significant in this regression (p = 0.182), the significantly
negative relation between the investor protection variables and earnings management is robust to
the inclusion of this proxy.
Another potential concern is that our results are driven by economic heterogeneity across
countries. While earnings management measures are computed relative to the operating cash
flow to control for differences in firms’ economic processes, differences in industry composition
across countries can potentially affect our results. Since Table 1 shows that the fraction of
manufacturing firms varies considerably across countries, the regressions are re-estimated using
a sub-sample comprised exclusively of manufacturing firms (SIC 2000-3999). The regression
results for this sub-sample (not reported) are essentially the same as those presented in Table 4,
alleviating concerns that cross-country differences in industry composition drive our main
findings.23
Finally, we are concerned that differences in firm characteristics and macroeconomic
stability affect our inferences. For instance, larger firms have smoother earnings, and operating
23 As medium-size firms are likely to be the most representative in an economy, we also re-estimate our regressions
discarding firms that are in a country’s top and bottom quartile with respect to firm size. This also eliminates many multinationals operating in different institutional settings. The findings based on this sub-sample are very similar to those reported in Table 4.
22
leverage is positively related to earnings volatility. Similarly, inflation rates and the volatility in
growth rates influence the variability of accounting earnings. Consequently, we re-estimate the
regressions using additional controls for median firm size, median capital intensity, a country’s
average yearly inflation rate and the standard deviation of the real GDP growth rate.24 The
results (not reported) are consistent with our original findings in Table 4. In particular, outside
investor rights and legal enforcement continue to have a significantly negative relation with
earnings management.
5.4. The role of other institutional factors
While the robustness checks in the previous section alleviate concerns that our findings
are driven by economic heterogeneity across countries, we still have to address the concern that
other institutional variables, which are correlated with investor protection, are responsible for our
main findings. Section 2 discusses several competing effects, which are addressed as follows.
First, well-enforced accounting rules can limit managers’ ability to distort reported
earnings as well as shape the properties of reported earnings. While we take the view that
accounting rules reflect a country’s legal and institutional framework and are therefore
endogenous to our analysis, it is an empirical matter whether our results are robust to the
inclusion of controls for countries’ stated accounting rules.25 To address this issue, we re-
estimate the main regression and include an “accrual index” constructed by Hung (2001) as a
control variable. This index captures the use of accrual accounting rules to accelerate the
recognition of economic transactions (e.g., R&D activities, pension plans). It proxies for the
24 OLS regressions without ranking the right-hand side variables produce similar results. 25 A related concern is that the use of earnings for tax and financial accounting purposes may introduce earnings
management and in particular smoothing incentives unrelated to investor protection. We therefore re-run the main regression including a proxy for the degree of a country’s tax-book conformity (e.g., Alford et al., 1993; Hung,

23
extent to which a country’s stated accounting rules are intended to produce timely and
informative reported earnings.
The results presented in column 1 of Table 5 show that the accounting rules proxy is
significant in conjunction with the outsider rights and legal enforcement variables. However, as
shown in column 2, the coefficient on the accounting rules proxy becomes insignificant in the
2SLS regression specification, whereas the investor protection variables remain significant.
These results support our view that the accounting rules are endogenous and confirm the key
importance of the investor protection variables as determinant of earnings management.
Finally, we examine the incremental impact of ownership concentration on insiders’
earnings management incentives since prior research highlights the relation between firms’
ownership structures and the properties of reported earnings (e.g., Fan and Wong, 1999; Ball et
al., 1999). We re-estimate the main regression using a proxy for ownership concentration
constructed by La Porta et al. (1998) as an additional control variable. Neither the rank
regression nor the 2SLS regression presented in columns 3 and 4 of Table 5 indicate any
incremental explanatory power of the ownership variable. Thus, while differences in ownership
concentration may be related to cross-sectional variation in earnings management within a
country, our country-level tests suggest that average ownership patterns are not a primary
determinant of systematic earnings management activities across countries.
In summary, while our results do not preclude a complementary role for other
institutional variables, they are consistent with the hypothesis that outside investor protection is a
key determinant of earnings management activities around the world.
2001). In this regression (not reported), the tax variable is not significant while the results for the investor protection variables are similar to those reported in Table 4.

24
6. Conclusion and Caveats
This paper examines how the legal protection of outside investors affects insiders'
incentives to manage reported earnings. The analysis is based on the notion that insiders, i.e.,
managers and controlling shareholders, have an incentive to acquire private control benefits.
Insiders’ ability to divert resources for their benefit is limited by a legal system that protects the
rights of outside investors. However, outsiders can only take legal and other disciplinary actions
against insiders if they detect the private benefits. Consequently, insiders manipulate accounting
reports to conceal their diversion activities.
Using this framework, we hypothesize that earnings management decreases in legal
protection because, when investor protection is strong, insiders enjoy fewer private control
benefits and consequently have little incentive to conceal firm performance. This hypothesis is
tested using financial accounting data from 31 countries. We perform a descriptive cluster
analysis to identify groupings of countries with similar institutional characteristics and then show
that earnings management varies systematically across these institutional clusters. The cluster
analysis suggests that countries sharing arm’s length institutional features, typically Anglo-
American countries, exhibit lower levels of earnings management than countries with insider
institutional characteristics, largely Continental-European and East-Asian countries.
Prior work shows that investor protection is a key primitive driving corporate choices,
such as firms’ financing and dividend policies as well as ownership structures (e.g., La Porta et
al. 1997, 1998 and 1999). We complement these findings by analyzing the impact of investor
protection on firms’ financial reporting and earnings management practices. The regression
results show that earnings management is negatively associated with the quality of minority
shareholder rights and legal enforcement. These findings are robust to controls for country

25
wealth, economic heterogeneity across countries as well as the inclusion of other institutional
factors capturing international differences in the accounting rules and ownership concentration.
Our empirical findings point to an important link between legal institutions and the
quality of accounting earnings reported to market participants. They complement earlier work in
finance, which generally treats the quality of corporate reporting as exogenous, and prior
research in accounting, which documents systematic patterns in the relation between stock
returns and accounting numbers.
The empirical results, however, are subject to several caveats. First, earnings
management is notoriously difficult to measure, especially as it manifests itself in different
forms. We attempt to address these difficulties by computing several proxies for earnings
management and obtain consistent results across all measures. However, our findings rely on the
ability of these measures to capture relative differences in earnings management activities around
the world. Second, the existence of complementarities among institutional factors raises
concerns about endogeneity bias. We attempt to address these issues with two-stage least
squares estimation. But as theoretical relations among the institutional factors are not yet well
understood, it is possible that we have not appropriately controlled for the endogenous
interactions among the factors. Finally, the analysis assumes that a country’s institutional
infrastructure is fairly stable from 1990 to 1999. While institutional changes are slow and
complex, this assumption need not be valid. However, recent changes in the institutional
frameworks of Continental European countries towards an Anglo-American system are likely to
bias results against our hypotheses.

26
References
Alford, A., J. Jones, R. Leftwich, and M. Zmijewski, 1993. The relative informativesness of accounting disclosures in different countries. Journal of Accounting Research 31, Supplement, 183-221.
Ali A., L. Hwang, 2000. Country-specific factors related to financial reporting and the value relevance of accounting data. Journal of Accounting Research 38, 1-23.
Ball, R., S. Kothari, A. Robin, 2000. The effect of international institutional factors on properties of accounting earnings. Journal of Accounting and Economics 29, 1-52.
Ball, R., A. Robin, J. Wu, 1999. Incentives versus standards, properties of accounting income in four East Asian countries and implications for acceptance of IAS. Unpublished working paper, University of Chicago.
Basu, S., L. Hwang, and C. Jan, 1998. International variation in accounting measurement rules and analysts’ earnings forecast errors. Journal of Business, Finance & Accounting 25, 1207-1247.
Bhattacharya, U., H. Daouk, M. Welker, 2002. The world price of earnings opacity. Unpublished working paper, Indiana University, University of Michigan and Queen’s University.
Brown, L., H. Higgins, 2001. Managing earnings surprises in the US versus 12 other countries. Journal of Accounting and Public Policy 20, 373-398.
Burgstahler, D., I. Dichev, 1997. Earnings management to avoid earnings decreases and losses. Journal of Accounting and Economics 24, 99-129.
Claessens, S., S. Djankov, J. Fan, L. Lang, 2000a. Expropriation of Minority Shareholders in East Asia. Unpublished working paper, University of Amsterdam.
Claessens, S., S. Djankov, L. Lang, 2000b. The separation of ownership and control in East Asian corporations. Journal of Financial Economics 58, 81-112.
d’Arcy, A. 2000. The degree of determination of national accounting systems – An empirical investigation, Schmalenbach Business Review 52, 45-67.
Dechow, P., R. Sloan, A. Sweeney, 1995. Detecting earnings management. The Accounting Review 70, 193-225.
Dechow, P., D. Skinner, 2000. Earnings management: Reconciling the views of accounting academics, practioners, and regulators. Accounting Horizons 14, 235-250.
Degeorge, F., J. Patel, R. Zeckhauser, 1999. Earnings manipulation to exceed thresholds. Journal of Business 72, 1-33.
Dyck, A., L. Zingales, 2002. Private benefits of control: An international comparison. Unpublished NBER working paper (8711).
Enriques, L., 2000. The law on company directors' self-dealing: A comparative analysis. International and Comparative Corporate Law Journal 2, 297-314.
Fan, J., T. Wong, 1999. Corporate ownership structure and the informativeness of accounting earnings in East Asia. Unpublished working paper, Hong Kong University of Science and Technology.

27
Healy, P., J. Wahlen, 1999. A review of the earnings management literature and its implications for standard setting. Accounting Horizons 13, 365-383.
Hope, O., 2002. Disclosure pratices, enforcement of accounting standards, and analysts’ forecasts: An international study. Forthcoming Journal of Accounting Research. Hung, M., 2001. Accounting standards and value relevance of financial statements: An
international analysis. Journal of Accounting and Economics 30, 401-420. Joos, P. and M. Lang, 1994. The effects of accounting diversity: Evidence from the European
Union. Journal of Accounting Research, Supplement, 141-168. La Porta, R., F. Lopez-de-Silanes, A. Schleifer, R. Vishny, 1997. Legal determinants of external
finance. Journal of Finance 52, 1131-1150. La Porta, R., F. Lopez-de-Silanes, A. Schleifer, R. Vishny, 1998. Law and finance. Journal of
Political Economy 106, 1113-1155. La Porta, R., F. Lopez-de-Silanes, A. Schleifer, R. Vishny, 1999. Corporate ownership around
the world. Journal of Finance 54, 471-517. La Porta, R., F. Lopez-de-Silanes, A. Schleifer, R. Vishny, 2000a. Investor protection and
corporate governance. Journal of Financial Economics 58, 3-27. La Porta, R., F. Lopez-de-Silanes, A. Schleifer, R. Vishny, 2000b. Agency problems and
dividend policies around the world. Journal of Finance 55, 1-33. Land J., M. Lang, 2000. Empirical evidence on the evolution of global accounting. Working
paper, University of North Carolina. Levine, R., 1999. Law, finance and economic growth, Journal of Financial Intermediation 8, 8-
35. Nenova, T., 2000. The value of corporate votes and control benefits: A cross-country analysis.
Unpublished working paper, Harvard University. Organization for Economic Co-operation and Development, 1999. OECD principles of corporate
governance. Shleifer, A., R. Vishny, 1997. A survey of corporate governance. Journal of Finance 52, 737-
783. Shleifer, A., D. Wolfenzon, 2000. Investor protection and equity markets. Unpublished working
paper, Harvard University. Skinner, D., L. Myers, 1999. Earnings momentum and earnings management. Unpublished
working paper, University of Michigan and University of Illinois. Watts R., Zimmerman, J, 1986. Positive accounting theory (Prentice-Hall, Englewood Cliffs,
NJ). Zingales, L., 1994. The value of the voting right: A study of the Milan stock exchange
experience. Review of Financial Studies 7, 125-148.
28
Table 1
Panel A: Descriptive Statistics of Firm Characteristics and Macroeconomic Variables (by Country) The full sample consists of 70,955 firm-year observations for the fiscal years 1990-99 across 31 countries and 8,616 non-financial firms. Financial accounting information is obtained from the November 2000 version of the Worldscope database. To be included in our sample, countries must have at least 300 firm-year observations for a number of accounting variables, including total assets, sales, net income, and operating income. For each firm, we require income statement and balance sheet information for at least 3 consecutive years. We discard three countries (Chile, New Zealand, Turkey) because of an insufficient number of observations to compute the loss avoidance measure and three countries (Argentina, Brazil, Mexico) due to hyperinflation. Firm size is measured as total US$ sales (in thousands). Capital intensity is measured as the ratio of long-term assets over total assets. The fraction of manufacturing firms is the percentage of firm-year observations with SIC 2000 to 3999. Average per-capita GDP in constant 1995 US$ is computed from 1990 to 1999. Inflation is measured as the average percentage change in consumer prices from 1990 to 1998. Volatility of GDP growth is measured as the standard deviation of the growth rate in real per-capita GDP from 1990 to 1998.
Country
# Firm-Years
Median Firm Size in
US$
Median Capital
Intensity
Fractionof Mfg. Firms
Per-capita GDP in
US$
Inflation
Volatility of GDP Growth
AUSTRALIA 1,483 233,344 0.425 0.319 20,642 2.616 2.011 AUSTRIA 564 213,101 0.313 0.710 29,287 2.615 1.216 BELGIUM 727 277,510 0.280 0.563 27,357 2.259 1.452 CANADA 3,322 271,287 0.465 0.381 19,687 2.252 1.921 DENMARK 1,235 119,113 0.344 0.573 34,163 2.069 1.228 FINLAND 854 308,974 0.345 0.618 26,296 2.245 4.689 FRANCE 4,404 178,163 0.187 0.548 26,960 2.043 1.416 GERMANY 4,440 336,894 0.282 0.637 30,166 2.509 1.463 GREECE 858 38,305 0.295 0.568 11,393 12.057 1.479 HONG KONG 1,483 167,754 0.376 0.513 21,610 4.100 3.890 INDIA 2,064 63,027 0.409 0.859 374 10.089 2.316 INDONESIA 787 75,502 0.361 0.694 961 13.860 7.257 IRELAND 436 124,021 0.386 0.438 18,707 2.380 3.033 ITALY 1,213 350,380 0.280 0.721 19,025 4.399 1.253 JAPAN 16,475 463,191 0.289 0.583 41,200 1.378 2.290 KOREA (SOUTH) 1,692 452,349 0.382 0.724 10,250 6.275 4.642 MALAYSIA 2,036 81,407 0.403 0.557 4,043 3.970 4.348 NETHERLANDS 1,561 349,909 0.333 0.503 27,037 2.477 1.071 NORWAY 988 104,483 0.356 0.410 33,189 2.455 1.276 PAKISTAN 508 24,907 0.432 0.913 488 10.335 2.253 PHILIPPINES 429 60,814 0.460 0.500 1,093 9.803 2.423 PORTUGAL 460 97,229 0.412 0.545 10,942 6.396 1.684 SINGAPORE 1,100 104,187 0.377 0.472 22,721 2.153 2.660 SOUTH AFRICA 1,043 380,644 0.327 0.445 3,914 10.408 1.921 SPAIN 1,082 333,207 0.424 0.492 15,092 4.434 1.636 SWEDEN 1,384 261,343 0.295 0.505 27,350 3.591 2.287 SWITZERLAND 1,320 377,488 0.394 0.626 44,485 2.514 1.645 TAIWAN 1,001 208,798 0.357 0.809 2,839 3.365 0.798 THAILAND 1,529 55,344 0.433 0.578 2,570 5.498 3.278 UK 10,685 109,337 0.335 0.430 19,126 3.946 2.028 UNITED STATES 3,792 3,597,429 0.333 0.556 27,836 3.094 1.640 Mean 2,289 316,756 0.358 0.574 18,736 4.761 2.339 Median 1,235 208,798 0.357 0.557 19,687 3.365 1.921 Min 429 24,907 0.187 0.319 374 1.378 0.798 Max 16,475 3,597,429 0.465 0.913 44,485 13.860 7.257

29
Table 1 (continued)
Panel B: Institutional Characteristics of the Sample Countries The classification of the legal origin and the legal tradition are based on La Porta et al. (1998). CD (CM) indicates a code-law (common-law) country. The outside investor rights variable is the “anti-director rights” index created by La Porta et al. (1998). It is an aggregate measure of minority shareholder rights and ranges from zero to five. Enforcement is measured as the mean score across three legal variables used in La Porta et al. (1998): (1) the efficiency of the judicial system, (2) an assessment of rule of law, and (3) the corruption index. All three variables range from zero to 10. The “importance of the equity markets” is measured by the mean rank across three variables used in La Porta et al. (1997): (1) the ratio of the aggregate stock market capitalization held by minorities to gross national product, (2) the number of listed domestic firms relative to the population, and (3) the number of IPOs relative to the population. Each variable is ranked such that higher scores indicate a greater importance of the stock market. Ownership concentration is measured as the median percentage of common shares owned by the largest three shareholders in the 10 largest privately owned nonfinancial firms (La Porta et al., 1998). The disclosure index measures the inclusion or omission of 90 items in the 1990 annual reports (La Porta et al. 1998). It is not available (NA) for three countries in our sample.
Country Legal Origin Legal Tradition
Outside Investor Rights
Legal Enforcement
Importance of Equity Market
Ownership Concentration
Disclosure Index
AUSTRALIA English CM 4 9.5 24.0 0.28 75 AUSTRIA German CD 2 9.4 7.0 0.51 54 BELGIUM French CD 0 9.4 11.3 0.62 61 CANADA English CM 5 9.8 23.3 0.24 74 DENMARK Scandinavian CD 2 10.0 20.0 0.40 62 FINLAND Scandinavian CD 3 10.0 13.7 0.34 77 FRANCE French CD 3 8.7 9.3 0.24 69 GERMANY German CD 1 9.1 5.0 0.50 62 GREECE French CD 2 6.8 11.5 0.68 55 HONG KONG English CM 5 8.9 28.8 0.54 69 INDIA English CM 5 5.6 14.0 0.43 57 INDONESIA French CD 2 2.9 4.7 0.62 NA IRELAND English CM 4 8.4 17.3 0.36 NA ITALY French CD 1 7.1 6.5 0.60 62 JAPAN German CD 4 9.2 16.8 0.13 65 KOREA (SOUTH) German CD 2 5.6 11.7 0.20 62 MALAYSIA English CM 4 7.7 25.3 0.52 76 NETHERLANDS French CD 2 10.0 19.3 0.31 64 NORWAY Scandinavian CD 4 10.0 20.3 0.31 74 PAKISTAN English CM 5 3.7 7.5 0.41 NA PHILIPPINES French CD 3 3.5 5.7 0.51 65 PORTUGAL French CD 3 7.2 11.8 0.59 36 SINGAPORE English CM 4 8.9 28.8 0.53 78 SOUTH AFRICA English CM 5 6.4 16.3 0.52 70 SPAIN French CD 4 7.1 7.2 0.50 64 SWEDEN Scandinavian CD 3 10.0 16.7 0.28 83 SWITZERLAND German CD 2 10.0 24.8 0.48 68 TAIWAN German CD 3 7.4 13.3 0.14 65 THAILAND English CM 2 4.9 14.3 0.48 64 UK English CM 5 9.2 25.0 0.15 78 UNITED STATES English CM 5 9.5 23.3 0.12 71

30
Table 2
Panel A: Country Scores for the Earnings Management Measures The variables are computed from 70,955 firm-year observations for fiscal years 1990-99 across 31 countries and 8,616 non-financial firms. Data are obtained from the Worldscope database (November 2000). EM1 is the country’s median ratio of the firm-level standard deviations of operating income and operating cash flow (both scaled by lagged total assets). The cash flow from operations is equal to operating income minus accruals, where accruals are calculated as: (∆total current assets - ∆cash) - (∆total current liabilities- ∆short-term debt - ∆taxes payable) - depreciation expense. EM2 is the country’s Spearman correlation of the change in accruals and the change in cash flow from operations (both scaled by lagged total assets). EM3 is the country’s median ratio of the absolute value of accruals and the absolute value of the cash flow from operations. EM4 is the number of “small profits” divided by the number of “small losses” for each country. A firm-year observation is classified as a “small profit” if net earnings (scaled by lagged total assets) are in the range [0,0.01]. A firm-year observation is classified as a “small loss” if net earnings (scaled by lagged total assets) are in the range [-0.01,0). Net earnings are bottom-line reported income after interest, taxes, special items, extraordinary items, reserves and any other items. The “aggregate earnings management measure” is the average rank across all four measures, EM1-4. The sign in the column heading indicates whether higher scores for the respective EM measure imply more earnings management (+) or less earnings management (–).
Earnings Smoothing Measures Earnings Discretion Measures EM1
σ(OpInc)/σ(CFO) (–)
EM2 ρ(∆Acc, ∆CFO)
(–)
EM3 |Acc| / |CFO|
(+)
EM4 #SmProfit / #SmLoss
(+)
Aggregate Earnings
Management Score
AUSTRIA 0.345 -0.921 0.783 3.563 28.3 GREECE 0.415 -0.928 0.721 4.077 28.3 KOREA (SOUTH) 0.399 -0.922 0.685 3.295 26.8 PORTUGAL 0.402 -0.911 0.745 3.000 25.1 ITALY 0.488 -0.912 0.630 4.154 24.8 TAIWAN 0.431 -0.898 0.646 2.765 22.5 SWITZERLAND 0.473 -0.873 0.547 5.591 22.0 SINGAPORE 0.455 -0.882 0.627 3.000 21.6 GERMANY 0.510 -0.867 0.848 3.006 21.5 JAPAN 0.560 -0.905 0.567 3.996 20.5 BELGIUM 0.526 -0.831 0.677 3.571 19.5 HONG KONG 0.451 -0.850 0.552 3.545 19.5 INDIA 0.523 -0.867 0.509 6.000 19.1 SPAIN 0.539 -0.865 0.514 6.000 18.6 INDONESIA 0.481 -0.825 0.506 7.200 18.3 THAILAND 0.602 -0.868 0.671 3.136 18.3 PAKISTAN 0.508 -0.913 0.513 2.643 17.8 NETHERLANDS 0.491 -0.861 0.480 3.313 16.5 DENMARK 0.559 -0.875 0.526 2.708 16.0 MALAYSIA 0.569 -0.857 0.578 2.658 14.8 FRANCE 0.561 -0.845 0.579 2.370 13.5 FINLAND 0.555 -0.818 0.517 2.633 12.0 PHILIPPINES 0.722 -0.804 0.555 2.455 8.8 UNITED KINGDOM 0.574 -0.807 0.397 1.802 7.0 SWEDEN 0.621 -0.764 0.466 2.568 6.8 NORWAY 0.713 -0.722 0.556 1.235 5.8 SOUTH AFRICA 0.643 -0.840 0.297 1.667 5.6 CANADA 0.649 -0.759 0.478 2.338 5.3 IRELAND 0.607 -0.788 0.371 1.667 5.1 AUSTRALIA 0.625 -0.790 0.450 1.486 4.8 UNITED STATES 0.765 -0.740 0.311 1.631 2.0 Mean 0.541 -0.849 0.558 3.196 Median 0.539 -0.861 0.552 3.000 Standard Deviation 0.100 0.056 0.128 1.413 Min 0.345 -0.928 0.297 1.235 Max 0.765 -0.722 0.848 7.200

31
Table 2 (continued)
Panel B: Correlation between Earnings Management and Various Institutional Factors The table presents Spearman correlations and significance levels (in parentheses) between the following measures. The “aggregate earnings management measure” is the average rank of all four earnings management measures, EM1-EM4. Outside investor rights is the “anti-director rights” index from La Porta et al. (1998). It is an aggregate measure of (minority) shareholder rights and ranges from zero to six. Enforcement is measured as the mean score across three legal variables used in La Porta et al. (1998): (1) the efficiency of the judicial system, (2) an assessment of rule of law, and (3) the corruption index. All three variables range from zero to 10. The “importance of the equity markets” is measured by the mean rank across three variables used in La Porta et al. (1997): (1) the ratio of the aggregate stock market capitalization held by minorities to gross national product, (2) the number of listed domestic firms relative to the population, and (3) the number of IPOs relative to the population. Each variable is ranked such that higher scores indicate a greater importance of the stock market. Ownership concentration is measured as the median percentage of common shares owned by the largest three shareholders in the 10 largest privately owned nonfinancial firms (La Porta et al., 1998). The disclosure index measures the inclusion or omission of 90 items in the 1990 annual reports (La Porta et al. 1998).
Outside Investor Rights
Legal Enforcement
Importance of Stock Market
Ownership Concentration
Disclosure Index
Aggregate Earnings Management -0.538 (0.002)
-0.291 (0.112)
-0.418 (0.019)
0.434 (0.015)
0.686 (0.000)
Outside Investor Rights -0.026 (0.888)
0.515 (0.003)
-0.344 (0.058)
0.568 (0.002)
Legal Enforcement - 0.522 (0.003)
-0.396 (0.028)
0.393 (0.038)
Importance of Stock Market - -0.315 (0.084)
0.647 (0.000)
Ownership Concentration - -0.398 (0.036)

32
Table 3
Earnings Management and Institutional Characteristics (Cluster Analysis) The table presents results from a k-means cluster analysis using three distinct clusters and nine institutional variables from La Porta et al. (1997 and 1998). See Panel B of table 1 for details. The variables are standardized to z-scores. Panel A reports the means of the institutional variables by cluster. Panel B reports the cluster membership for the 31 sample countries. Membership in a particular institutional cluster is based on the cluster analysis performed on the variables in panel A. CD (CM) indicates a code-law (common-law) tradition. This variable is not used in the cluster analysis. Panel C reports the level of earnings management by cluster. The aggregate earnings management measure is the average rank of all four measures, EM1-4. The last row reports one-sided p-values for differences in the means of the aggregate earnings management across clusters using a t-test.
Panel A: Mean Values of Institutional Variables by Cluster
Institutional Variables Cluster 1 Cluster 2 Cluster 3 Stock Market Capitalization 0.82 0.46 0.21 Listed Firms 49.56 18.58 9.50 IPOs 4.04 0.55 0.37 Ownership Concentration 0.34 0.37 0.50 Anti-Director Rights 4.50 2.62 2.90 Disclosure 74.38 66.67 58.13 Efficiency of Judicial System 9.78 9.04 5.50 Rule of law 9.02 9.07 5.65 Corruption Index 8.80 9.09 5.13 Outsider Features ←→ Insider Features
Panel B: Countries per Institutional Cluster
Cluster 1 Cluster 2 Cluster 3 Sample Countries Australia (CM)
Canada (CM) Hong Kong (CM)
Malaysia (CM) Norway (CD)
Singapore (CM) UK (CM)
USA (CM)
Austria (CD) Belgium (CD)
Denmark (CD) Finland (CD)
Germany (CD) Ireland (CM)
Japan (CD) Netherlands (CD)
South Africa (CM) Sweden (CD)
Switzerland (CD) Taiwan (CD)
Greece (CD) India (CM)
Indonesia (CD) Italy (CD)
Korea (CD) Pakistan (CM)
Philippines (CD) Portugal (CD)
Spain (CD) Thailand (CM)
Panel C: Level of Earnings Management by Cluster
Cluster 1 Cluster 2 Cluster 3
Mean Aggregate Earnings Management Measure 10.1 16.1 20.6
Tests of EM differences between clusters (p-values)
C1 vs. C2 (0.044)
C2 vs. C3 (0.059)
C1 vs. C3 (0.003)

33
Table 4
Earnings Management, Outside Investor Protection and Private Control Benefits The table presents coefficients and two-sided p-values (in parentheses) from rank regressions with the “aggregate earnings management measure” as dependent variable, which is created by averaging the ranks of all four earnings management measures, EM1-EM4 (see table 2). Outside investor rights is the “anti-director rights” index from La Porta et al. (1998). It is an aggregate measure of (minority) shareholder rights and ranges from zero to five. Enforcement is measured as the mean score across three legal variables used in La Porta et al. (1998): (1) the efficiency of the judicial system, (2) an assessment of rule of law, and (3) the corruption index. All three variables range from zero to 10. The first column presents a simple rank regression. The regression is estimated using two-stage least squares. Instrumental variables are the rank of the country’s real per-capita GDP averaged from 1980 to 1989 and three binary variables indicating an English, German, French, or Scandinavian legal origin based on the classification in La Porta et al. (1998). Private control benefits are measured at the country level as the mean block premium estimated by Dyck and Zingales (2002). It is based on transfers of controlling blocks of shares. The third regression is also estimated using two-stage least squares. The instrumental variables are the outsider rights index and the legal enforcement.
Aggregate Earnings Management Measure
Aggregate Earnings Management Measure
- 2SLS -
Aggregate Earnings Management Measure
- 2SLS -
Constant 28.605 (<0.001)
31.519 (<0.001)
3.128 (0.463)
Outside Investor Rights -0.499 (0.004)
-0.642 (0.001)
-
Legal Enforcement -0.289 (0.025)
-0.328 (0.024)
-
Private Control Benefits - - 0.931 (0.004)
Adjusted R2 0.389 0.358 0.272 Number of Observations 31 31 26
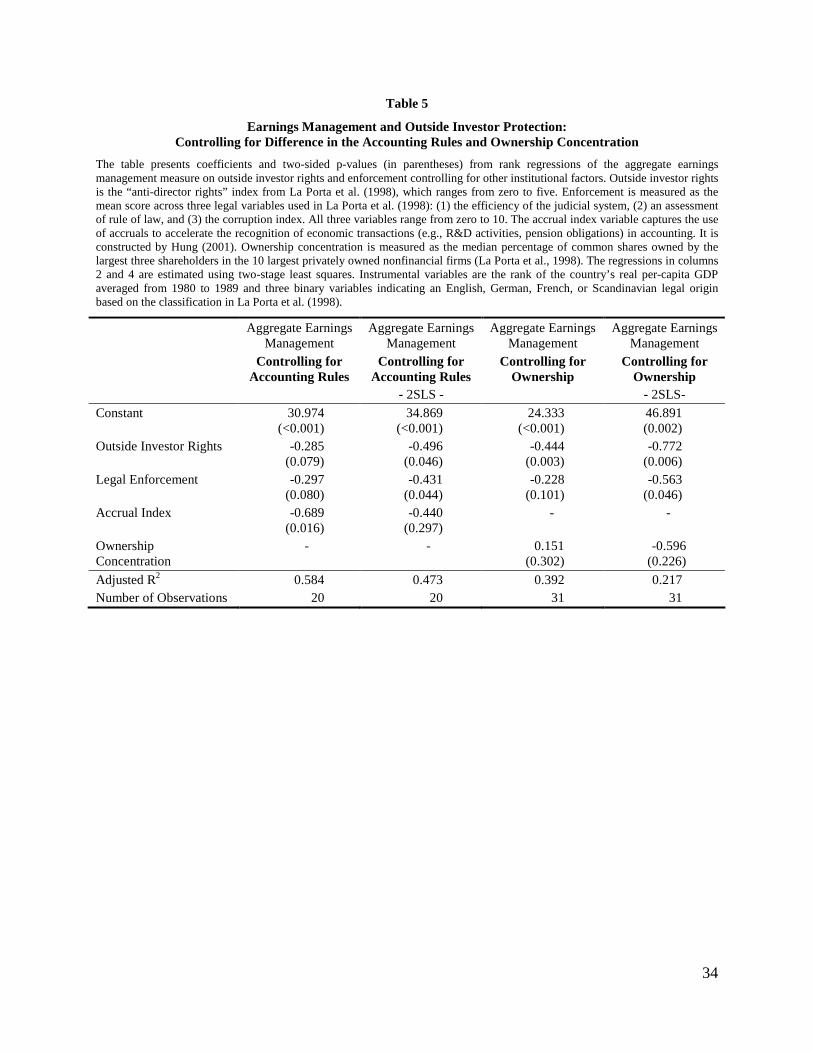
34
Table 5
Earnings Management and Outside Investor Protection: Controlling for Difference in the Accounting Rules and Ownership Concentration
The table presents coefficients and two-sided p-values (in parentheses) from rank regressions of the aggregate earnings management measure on outside investor rights and enforcement controlling for other institutional factors. Outside investor rights is the “anti-director rights” index from La Porta et al. (1998), which ranges from zero to five. Enforcement is measured as the mean score across three legal variables used in La Porta et al. (1998): (1) the efficiency of the judicial system, (2) an assessment of rule of law, and (3) the corruption index. All three variables range from zero to 10. The accrual index variable captures the use of accruals to accelerate the recognition of economic transactions (e.g., R&D activities, pension obligations) in accounting. It is constructed by Hung (2001). Ownership concentration is measured as the median percentage of common shares owned by the largest three shareholders in the 10 largest privately owned nonfinancial firms (La Porta et al., 1998). The regressions in columns 2 and 4 are estimated using two-stage least squares. Instrumental variables are the rank of the country’s real per-capita GDP averaged from 1980 to 1989 and three binary variables indicating an English, German, French, or Scandinavian legal origin based on the classification in La Porta et al. (1998).
Aggregate Earnings Management
Controlling for Accounting Rules
Aggregate Earnings Management
Controlling for Accounting Rules
- 2SLS -
Aggregate Earnings Management
Controlling for Ownership
Aggregate Earnings Management
Controlling for Ownership
- 2SLS- Constant 30.974
(<0.001) 34.869
(<0.001) 24.333
(<0.001) 46.891 (0.002)
Outside Investor Rights -0.285 (0.079)
-0.496 (0.046)
-0.444 (0.003)
-0.772 (0.006)
Legal Enforcement -0.297 (0.080)
-0.431 (0.044)
-0.228 (0.101)
-0.563 (0.046)
Accrual Index -0.689 (0.016)
-0.440 (0.297)
- -
Ownership Concentration
- - 0.151 (0.302)
-0.596 (0.226)
Adjusted R2 0.584 0.473 0.392 0.217 Number of Observations 20 20 31 31