Investor Presentations21.q4cdn.com/387111300/files/doc_financials/2017/Q3/3Q17-IR-Deck... ·...
30
Investor Presentation October 2017
-
Upload
hoangnguyet -
Category
Documents
-
view
215 -
download
2
Transcript of Investor Presentations21.q4cdn.com/387111300/files/doc_financials/2017/Q3/3Q17-IR-Deck... ·...

Investor Presentation
October 2017

Safe Harbor Slide
Safe Harbor Statement
This presentation contains forward-looking statements that involve risks and uncertainties, including statements regarding
MobileIron's revenue and other GAAP and non-GAAP financial metrics for the company's third quarter in 2015 and other
statements regarding trends in the company's business, including statements regarding MobileIron's GAAP and non-GAAP
revenue and operating expense targets, growth in our customer base, increased customer adoption, and expected benefits
from new product offerings and MobileIron’s partner ecosystem. There are a significant number of factors that could cause
actual results to differ materially from statements made in this presentation, including MobileIron's limited operating history,
quarterly fluctuations in MobileIron's operating results, MobileIron's need to develop new solutions and enhancements to
compete in rapidly evolving markets, product defects, competitive pressures, customer adoption, changes by operating
system providers and mobile device manufacturers, MobileIron's inability to manage growth, the quality of MobileIron
support, MobileIron's reliance on channel partners and development of partner ecosystem.
Additional information on potential factors that could affect MobileIron's financial results is included in the company's SEC
filings, including its most recent Form 10-K and Form 10-Q. MobileIron does not assume any obligation to update the
forward-looking statements provided to reflect events that occur or circumstances that exist after the date on which they
were made.

VisionUnlock human
potential
MissionProvide security and apps
backbone for modern
computing
StrategyBuild scalable, multi-OS
architecture with repeatable
business model
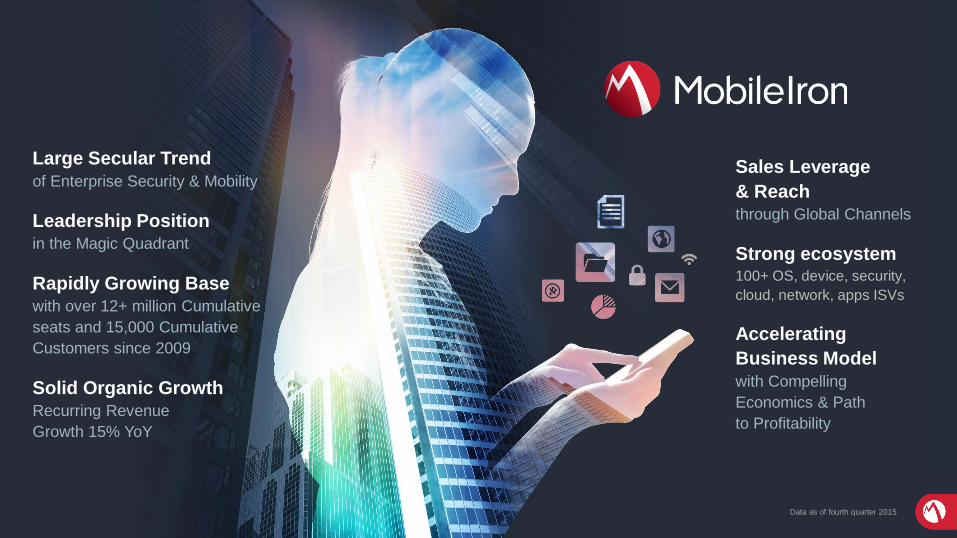
Large Secular Trend
of Enterprise Security & Mobility
Leadership Positionin the Magic Quadrant
Rapidly Growing Base with over 12+ million Cumulative
seats and 15,000 Cumulative
Customers since 2009
Solid Organic GrowthRecurring Revenue
Growth 15% YoY
Sales Leverage
& Reach through Global Channels
Strong ecosystem100+ OS, device, security,
cloud, network, apps ISVs
Accelerating
Business Model
with Compelling
Economics & Path
to Profitability
Data as of fourth quarter 2015

Two trends power our business
Mobile
security
Cloud
security
Network
security
Enablement
Intelligence
Move to cloudMove to mobile

Old: Perimeter Model
Enterprise Boundary Collapsing
System image
Anti-malware agentsPerimeter
Firewall
Device VPN
VDI
Mobile & Cloud Model
Salesforce Office365 Workday SAP Oracle
Concur Google Drive box Dropbox

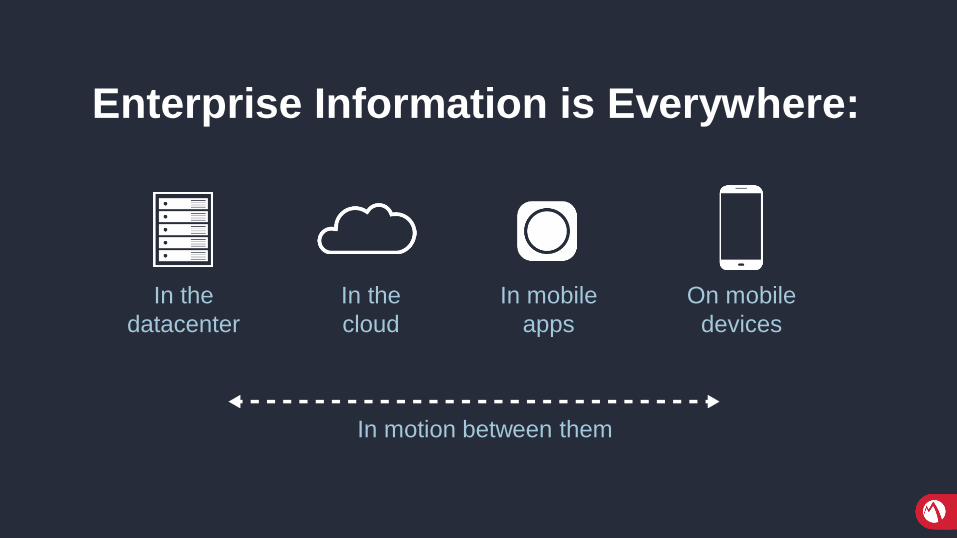
Enterprise Information is Everywhere:
In the
datacenter
In the
cloud
In mobile
apps
On mobile
devices
In motion between them
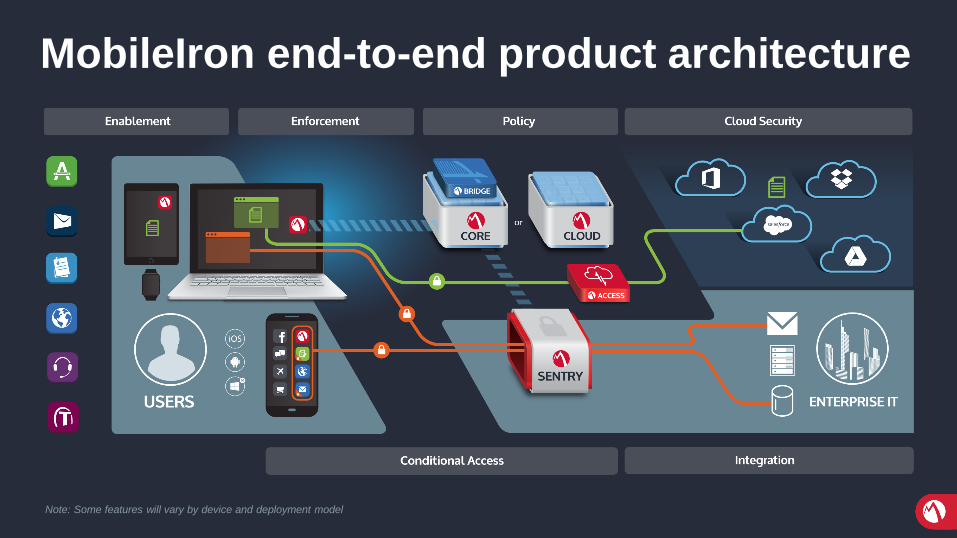
Note: Some features will vary by device and deployment model
MobileIron end-to-end product architecture
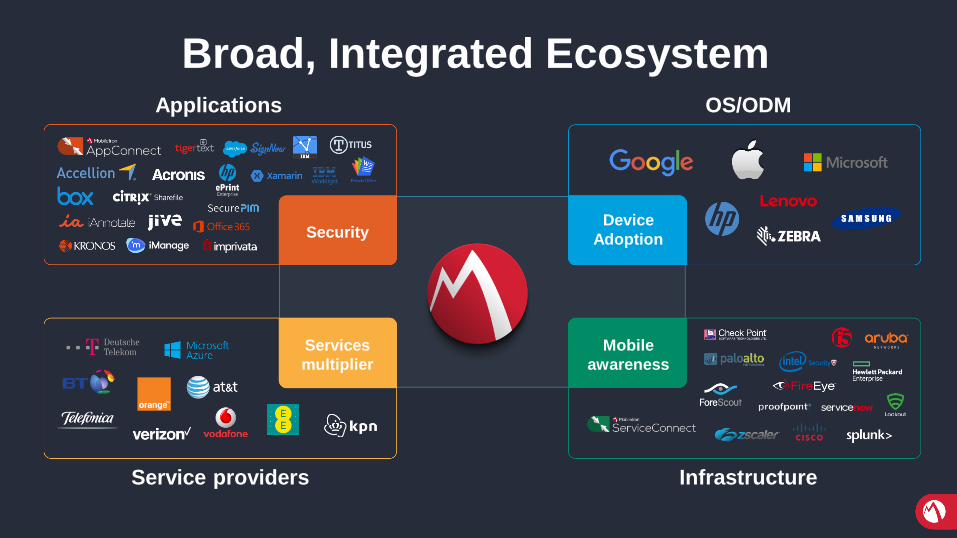
Broad, Integrated Ecosystem
Service providers
Services
multiplier
Infrastructure
Mobile
awareness
OS/ODM
Device
Adoption
Applications
Security

Accelerating growth
FedRamp
California law
Common Criteria
Mobile apps and
regulatory
requirement
New products
Grow EMM business: 15-20% growth
Expand TAM: 560M laptops
Increase ASP $ / customer: 10 - 33%

Certifications awarded
FedRAMPGovernment Cloud
US-EU Privacy Shield CSfCNSA Commercial Solutions for Classified
FIPS 140-2Common Criteria
MDMPP V2SOC 2 Type II

Why We Win
We secure
apps
AppConnect
We secure
the network
Sentry
We secure
identity
Certs and SSO

Routes to Market
Operators
VARs

Financial Overview

Sales Model: Optimized for Long Term Growth
SELL MORE SEATS
INC
RE
AS
E $
/SE
AT
1) Renew: renewals of subscription and software support agreements on a device basis
Upsell More ProductsIncreased $ per seat
Land New CustomersSubscription or Perpetual
Expand OrdersExisting Customer Upside
RenewHigh Renewal Rate
MCM MAM
MDM
Kerberos

Solid Top-Line Growth
Non-GAAP Revenue(excludes VSOE)
Gross Billings
$30M
$35M
$38M
$42M
$36M$39M
$41M
$49M
$38M
$42M
$47M
$55M
$45M $45M
$50M
Guidance$55M-$58M
1Q
14
2Q
14
3Q
14
4Q
14
1Q
15
2Q
15
3Q
15
4Q
15
1Q
16
2Q
16
3Q
16
4Q
16
1Q
17
2Q
17
3Q
17
4Q
17
$27M
$30M
$34M
$37M
$33M$34M
$38M
$43M
$38M$39M
$42M
$46M
$42M $43M$43M
Guidance$46M-$48M
1Q
14
2Q
14
3Q
14
4Q
14
1Q
15
2Q
15
3Q
15
4Q
15
1Q
16
2Q
16
3Q
16
4Q
16
1Q
17
2Q
17
3Q
17
4Q
17

Revenue Mix Shifting Towards Subscription
See earnings press release for non-GAAP reconciliation
Shift from
Perpetual to
Subscription
64% to 21%
Net Present Value
on Subscription
Higher
Increased
Predictability
$0
$5
$10
$15
$20
$25
$30
$35
$40
$45
$50
Re
ve
nu
e $
MM
Subscription Software Sprt/Service Perpetual
64%59%
57%
53% 49%
48%
48%48% 35% 34%
35%
36%
27%
25%27%
32%23% 23% 21%
21%24%
25%27%
28%28%
28%27%
34%33%
32%
31% 34% 36%35% 33%
37% 37% 39%
15% 17% 19% 20% 22%24% 24% 25% 31% 33% 33% 34%
38% 39% 37% 36% 40% 40%40%

3Q REVENUE
$42.7M
3Q YoY Revenue Growth by Category
$41.6 -2.3
+1.7 +1.8
$42.7
3Q16Revenue
Perpetual Subscription Support &Services
3Q17Revenue
+3%

Recurring Billings Recurring Revenue
Billings Model
Perpetual (One Time)
Software Support
Term Subscription(12/24/36 Month)
Monthly Recurring (MRC)Billed Each Month by Service Provider
Not in Deferred Revenue
Footnotes:
1) See earnings press release for non-GAAP reconciliation
2) Recurring billings: Billings from subscription (term and MRC) plus service support.
3) Recurring revenue: revenue from subscription (term and MRC) plus service support.
36% CAGR 42% CAGR
Recurring Billings and Revenue

Billings and Revenue shift to recurring model
Billings Mix Revenue Mix
66.3%73.9% 74.5%
33.7%26.1% 25.5%
3Q15 3Q16 3Q17
Recurring Billings One-Time Billings
61.9%69.7%
75.9%
38.1%30.3%
24.1%
3Q15 3Q16 3Q17
Recurring Revenue One-Time Revenue
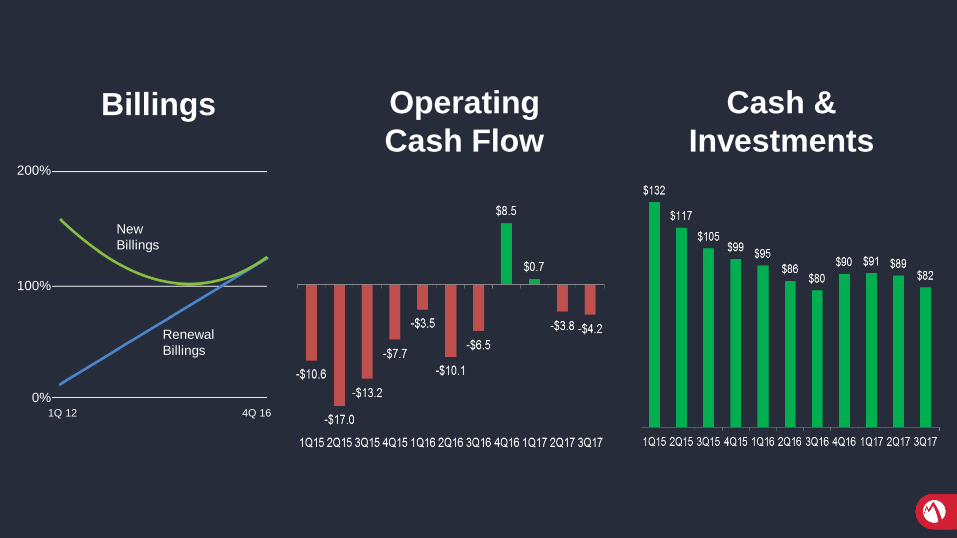
Billings
200%
100%
0%1Q 12 4Q 16
New
Billings
Renewal
Billings
Operating
Cash Flow
Cash &
Investments
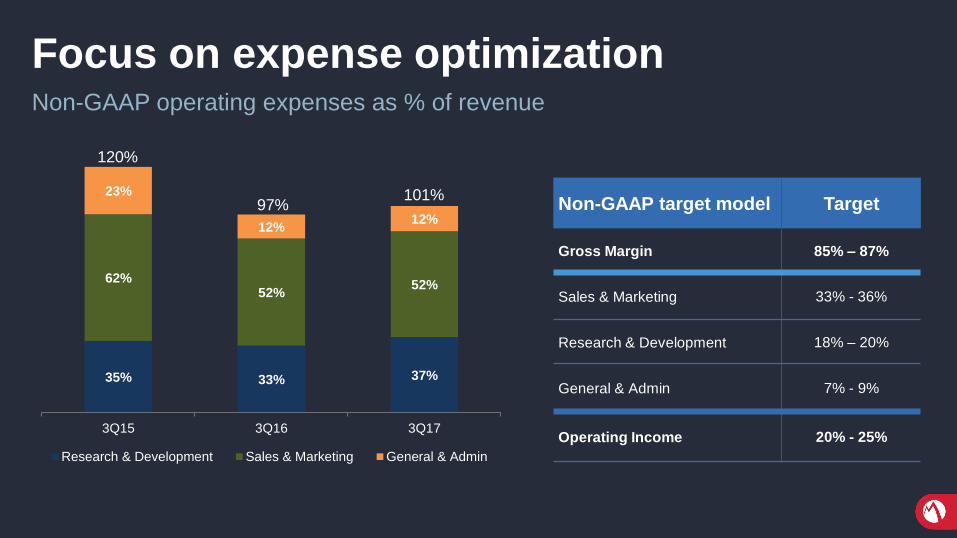
Focus on expense optimizationNon-GAAP operating expenses as % of revenue
Non-GAAP target model Target
Gross Margin 85% – 87%
Sales & Marketing 33% - 36%
Research & Development 18% – 20%
General & Admin 7% - 9%
Operating Income 20% - 25%
35% 33% 37%
62%52%
52%
23%
12%12%
3Q15 3Q16 3Q17
Research & Development Sales & Marketing General & Admin
120%
97%101%


GAAP to Non-GAAP Reconciliation

GAAP to Non-GAAP Reconciliation

GAAP to Non-GAAP Reconciliation

GAAP to Non-GAAP Reconciliation
Explanation of Non-GAAP Measures
To supplement our financial results presented on a GAAP basis, we use the non-GAAP measures indicated in the tables, which exclude stock-based compensation, the amortization of intangible assets, and perpetual revenue recognized from licenses delivered prior to 2013, that we believe are helpful in understanding our past financial performance and our future results. Our non-GAAP financial measures are not meant to be considered in isolation or as a substitute for comparable GAAP measures and should be read only in conjunction with our consolidated financial statements prepared in accordance with GAAP. Our management regularly uses our supplemental non-GAAP financial measures internally to understand, manage and evaluate our business and make operating decisions. These non-GAAP measures are among the primary factors management uses in planning for and forecasting future periods. Compensation of our executives is based in part on the performance of our business based on these non-GAAP measures. Our non-GAAP financial measures reflect adjustments based on the following items:
Perpetual license revenue recognized from licenses delivered prior to 2013 We have excluded the effect of perpetual license revenue recognized from licenses delivered prior to 2013 from revenue gross profit, gross margin, operating loss, and operating margin. Because we had not established vendor specific objective evidence, or VSOE, of fair value of software support and services prior to January 1, 2013, we recognized perpetual license revenue ratably over the term of the related software support agreement. Upon establishing VSOE on January 1, 2013, we began to recognize perpetual license revenue upon delivery assuming all other revenue recognition criteria are met. As a result, our perpetual license revenue includes amounts related to licenses delivered in previous years. Revenue from these perpetual licenses delivered prior to 2013 has declined over each quarter since the quarter ended March 31, 2013 and will continue to decline sequentially until it is fully amortized. We evaluate our business performance excluding revenue from these perpetual licenses delivered prior to 2013 as we believe that the inclusion of this revenue makes it difficult to compare periods and understand growth in our business.
Stock-based compensation expenses: We have excluded the effect of stock-based compensation expenses from our non-GAAP cost of revenue, operating expenses and net income measures. Although stock-based compensation is a key incentive offered to our employees, and we believe such compensation contributed to the revenues earned during the periods presented and also believe it will contribute to the generation of future period revenues, we continue to evaluate our business performance excluding stock-based compensation expenses. Stock-based compensation expenses will recur in future periods.
Amortization of intangible assets: We have excluded the effect of amortization of intangible assets from our non-GAAP cost of revenue, operating expenses and net income measures. Amortization of intangible assets is inconsistent in amount and frequency and is significantly affected by the timing and size of our acquisitions. Investors should note that the use of intangible assets contributed to our revenues earned during the periods presented and will contribute to our future period revenues as well. Amortization of intangible assets will recur in future periods.
Restructuring Charges: In our non-GAAP financial measures, we have excluded the effect of the severance and other expenses related to our reduction in workforce. Restructuring charges may recur in the future; however, the timing and amounts are difficult to predict.
GAAP to Non-GAAP Reconciliation