
Investor Presentations21.q4cdn.com/204186877/files/doc_presentations/...Global Gas Turbine Market...
24
Investor Presentation December 2017
Transcript of Investor Presentations21.q4cdn.com/204186877/files/doc_presentations/...Global Gas Turbine Market...

Investor Presentation
December 2017

Industry Data and Forward-Looking Statements
Disclaimer
December 20172
Broadwind obtained the industry and market data used throughout this presentation from our own research, internal surveys and studies
conducted by third parties, independent industry associations or general publications and other publicly available information. Independent industry
publications and surveys generally state that they have obtained information from sources believed to be reliable, but do not guarantee the
accuracy or completeness of such information. Forecasts are particularly likely to be inaccurate, especially over long periods of time. We are not
aware of any misstatements in the industry data we have presented herein, but estimates involve risks and uncertainties and are subject to change
based on various factors beyond our control.
This presentation contains “forward-looking statements”, as defined in Section 21E of the Securities Exchange Act of 1934, as amended.
Forward-looking statements include any statement that does not directly relate to a current or historical fact. Our forward-looking statements may
include or relate to our beliefs, expectations, plans and/or assumptions with respect to the following: (i) state, local and federal regulatory
frameworks affecting the industries in which we compete, including the wind energy industry, and the related extension, continuation or renewal of
federal tax incentives and grants and state renewable portfolio standards; (ii) our customer relationships and efforts to diversify our customer base
and sector focus and leverage customer relationships across business units; (iii) our ability to continue to grow our business organically and
through acquisitions; (iv) the sufficiency of our liquidity and alternate sources of funding, if necessary; (v) our ability to realize revenue from
customer orders and backlog; (vi) our ability to operate our business efficiently, manage capital expenditures and costs effectively, and generate
cash flow; (vii) the economy and the potential impact it may have on our business, including our customers; (viii) the state of the wind energy
market and other energy and industrial markets generally and the impact of competition and economic volatility in those markets; (ix) the effects of
market disruptions and regular market volatility, including fluctuations in the price of oil, gas and other commodities; (x) the effects of the recent
change of administrations in the U.S. federal government; (xi) our ability to successfully integrate and operate the business of Red Wolf Company,
LLC and to identify, negotiate and execute future acquisitions; and (xii) the potential loss of tax benefits if we experience an “ownership change”
under Section 382 of the Internal Revenue Code of 1986, as amended. These statements are based on information currently available to us and
are subject to various risks, uncertainties and other factors. We are under no duty to update any of these statements. You should not consider any
list of such factors to be an exhaustive statement of all of the risks, uncertainties or other factors that could cause our current beliefs, expectations,
plans and/or assumptions to change.
This presentation contains non-GAAP financial information. We believe that certain non-GAAP financial measures may provide users of this
financial information with meaningful comparisons between current results and results in prior operating periods. We believe that these non-GAAP
financial measures can provide additional meaningful reflection of underlying trends of the business because they provide a comparison of
historical information that excludes certain infrequently occurring or non-operational items that impact the overall comparability. Non-GAAP
financial measures should be viewed in addition to, and not as an alternative to, our reported results prepared in accordance with GAAP. Please
see our earnings release dated October 31, 2017 for a reconciliation of certain non-GAAP measures presented in this presentation.

Introduction to Broadwind Energy
December 2017 3
Towers and Weldments Leading US wind tower manufacturer with plants
strategically located in Texas and Wisconsin
Current capacity – 550 towers per year
Have produced towers for every major OEM in industry
Leveraging welding competencies in broader markets
Gearing 90-year history
Large precision custom gearing manufacturer
Gearbox and loose gearing expertise
Key markets: oil & gas, wind, steel, mining, and other
industrial
Process Systems Kitting (3000+ components), fabrication and assembly for
natural gas turbines
Fabrication and assembly for complex skid and compression
packages
Growth focused on diversification of markets and customer
base
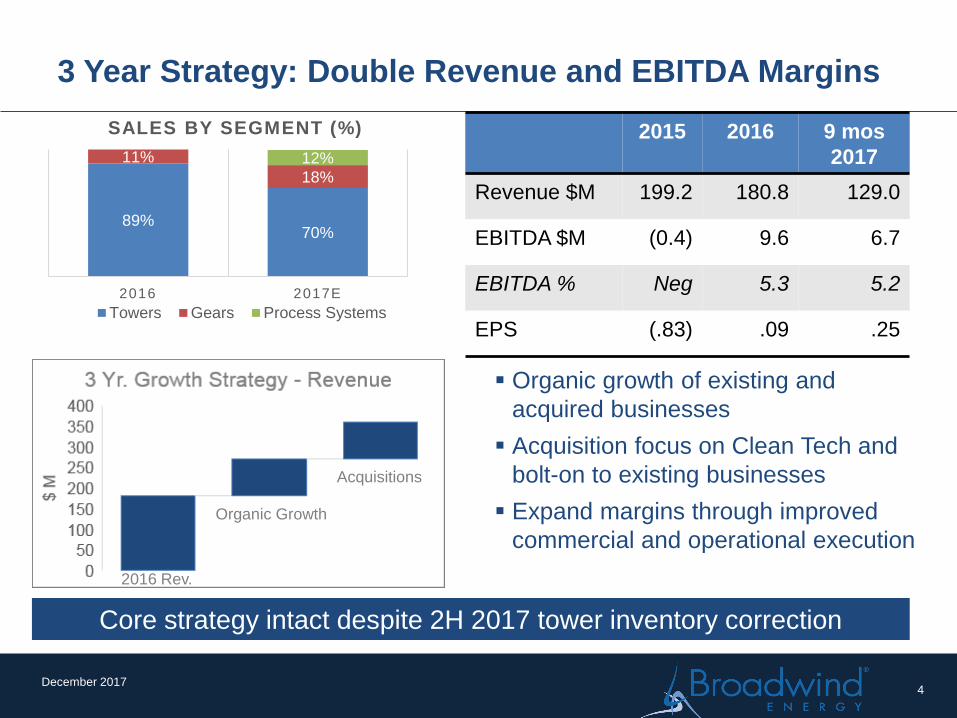
3 Year Strategy: Double Revenue and EBITDA Margins
December 20174
2016 Rev.
Organic Growth
Acquisitions
89%70%
11%
18%
12%
2016 2017E
SALES BY SEGMENT (%)
Towers Gears Process Systems
Organic growth of existing and
acquired businesses
Acquisition focus on Clean Tech and
bolt-on to existing businesses
Expand margins through improved
commercial and operational execution
2015 2016 9 mos
2017
Revenue $M 199.2 180.8 129.0
EBITDA $M (0.4) 9.6 6.7
EBITDA % Neg 5.3 5.2
EPS (.83) .09 .25
Core strategy intact despite 2H 2017 tower inventory correction

Orders and Backlog
Orders – $M
Break in tower order demand due to
industry fundamentals and dynamics
with key customer
Strong gearing orders from oil & gas
customers
Process Systems includes Red Wolf
and CNG
Backlog – $M
9/30/17 backlog $143M
Curve heavily impacted by PTC
dynamics
Industry slowdown in new order intake
following PTC qualification boom
December 2017
FY
2016
2016
B2B
9 mos
2017
9 mos
2017
B2B
Towers &
Weldments
260.8 1.64 32.3 .33
Gearing 14.2 .69 29.5 1.69
Process
Systems
n/a n/a 13.4 1.09
Total 275.0 1.53 72.3 .58
5
-
50
100
150
200
250
300
350
Q1 12
Q3 12
Q1 13
Q3 13
Q1 14
Q3 14
Q1 15
Q3 15
Q1 16
Q3 16
Q1 17
Q3 17
Mil
lio
ns

>90% of BWEN 2016 Revenue From Wind Energy
December 2017
0
20
40
60
80
100
GW
Cumulative Installations – US
Source: AWEA Q3 17 Market Report
85 GW
Wind Power Capacity (GW) Under
Construction/Advanced Development
Over 84 GW currently installed in the US
8.2 GW added in 2016 – wind provided 5.5% of electrical power in the US
~29 GW under construction or in advanced development at 6/30/17
Growing demand from commercial/industrial customers
PTC dynamics in 2017 causing delays and volatility – uncertainty of current tax legislation
6
0
5
10
15
20
25
30
35
Q1 16 Q2 16 Q3 16 Q4 16 Q1 17 Q2 17 Q3 17
Under construction at QE Adv. Development

As Costs Decline, Wind Energy is Becoming More
Competitive with Conventional Power Generation
December 2017 7
$-
$50
$100
$150
$200
$250
UNSUBSIDIZED Levelized Cost of Power
Generation Ranges by Technology - ($/MWh)
Global Onshore Wind Levelized Cost of
Energy Over Time ($/MWh)
Cost of wind energy has declined more than 66% over the last 7 years
Wind energy becoming a formidable competitor with conventional power generation
Further cost reductions expected – taller towers, longer blades, improved capacity factors all
contribute
Source: Lazard Levelized Cost of Energy Analysis (version 10.0)
2009 2010 2011 2012 2013 2014 2015 2016

4.8
8.6 8.9
7.3
10 10.2
12.3
7.5
8.59.4
10.9
8.4 8.4
2014A 2105A 2016A 2017E 2018E 2019E 2020E
Demand (MAKE) Demand (BNEF) Domestic Supply (MAKE)
US Wind Tower Supply/Demand Dynamics
December 2017
Following weaker 2017, domestic tower production expected to be strong through 2020
US supply is 8.4 GW or ~3800 towers (includes 2017 capacity additions)
Imports provide additional supply especially in coastal areas
MAKE demand est. 40 GW, Bloomberg demand est. 36 GW (2017-2020)
Source: MAKE Consulting Q2 2017 Global Wind Power Market Outlook Update dated 6/7/17, Bloomberg
New Energy Finance 1H 2017 North American Wind Market Outlook report dated 3/24/17
8

Towers and Weldments
Leading US wind tower manufacturer
Have produced >3000 multi-mw towers for all
major OEM’s in US: Vestas, GE,
Siemens/Gamesa, Nordex, Goldwind
Recent $7M investment improves flow and
expands capacity to 550 towers – Manitowoc, WI
350 and Abilene, TX 200
Continuous improvement culture
Engineering experts partner with our customers
to improve efficiencies and reduce costs
Low Q4 2017 production reduces full year
outlook
December 20179
$M 2013 2014 2015 2016 9 mos
2017
Towers Sold (units) 392 435 450 458 263
Revenue 159.5 184.9 170.9 160.2 99.2
OI 19.6 18.1 4.7 12.8 7.2
EBITDA 24.8 22.3 9.5 17.2 10.7

Broadwind: Geared For Industry
December 2017 10
Wind
O&G
Mining
General Industrial
Sales By Industry 2014-2016
Underground and surface mining
Cone crushers, drive shafts, cab
rotation, crawler shafts
Replacement gears and gear
boxes in steel processing
plants
Waste Processing
Paper Industry
On and offshore drilling
Frack and mud pumps
Replacement Gearing - Wind
Gearbox repair - Wind

BWEN YTD 2017 orders up over 2.5x vs YTD 2016
Gear Market Update – 2016 Inflection Point
December 2017
Source: IHS Markit August 2017 Source: IHS Markit August 2017
11

Cost Management and Continuous Improvement
Culture Leading to Operational Turnaround in Gearing
September 2017
Custom precision gear manufacturing with state of the art machinery
Operational turnaround evident – focus on cost management and
continuous improvement
Plant capacity in place to support >$50M annual production rate
2017 focus:
Leverage expanded sales resources to improve capacity utilization
Continue aggressive cost management
Continue cross-training to improve labor productivity
Positive EBITDA for 2017, trending to positive OI by year-end
12
$M 2013 2014 2015 2016
9 mos
2017
Orders 34.5 41.9 24.9 14.2 29.5
Revenue 43.2 42.3 29.6 20.6 17.5
OI (17.9) (9.4) (8.2) (3.2) (2.5
EBITDA (3.6) (0.9) (2.1) (0.6) (0.6)
Gearing Financials

Global Gas Turbine Market
December 201713
Red Wolf sales concentrated in gas turbine market – new units and
aftermarket
New unit market deliveries running well behind 2016
Industry overcapacity and excess inventories create a challenging near
term environment
Industry experts predicting ~3% annual growth rate 2018-2020
Sources: McCoy Power Reports
0
10
20
30
40
50
60
70
80
0
50
100
150
200
250
300
350
400
450
500
2012 2013 2014 2015 2016
Cap
acit
y (G
W)
# o
f U
nit
s
# of Units GW
Global Gas Turbine Orders(Utility and IPP segment)

September 2017
Process Systems
14
Q3
2016
Q3
2017
9 mos
2016
9 mos
2017
Orders ($M) n/a 5.3 n/a 13.4
Revenue ($M) n/a 6.1 n/a 12.3
Operating
Profit/(Loss) ($M)n/a 0.1 n/a -1.8
EBITDA* ($M) n/a .4 n/a -0.7
* Reconciliation to non-GAAP measure included in Appendix
Red Wolf acquisition
Contract manufacturer specialized in kitting,
light fabrication, packaging/assembly and
testing
Diversifies BWEN into gas turbine install and
upgrade market
Adds new southeast regional geographic
manufacturing presence in close proximity to
leading Power Generation OEM’s
2/3 of Red Wolf’s sales support installed base
vs. new units
Leverage existing customer base and
capabilities to expand business
Current Objectives
Complete integration of Red Wolf into
BWEN
Grow Red Wolf business by expanding
customer base and entering new markets
Refine procurement process to support
scaling up business
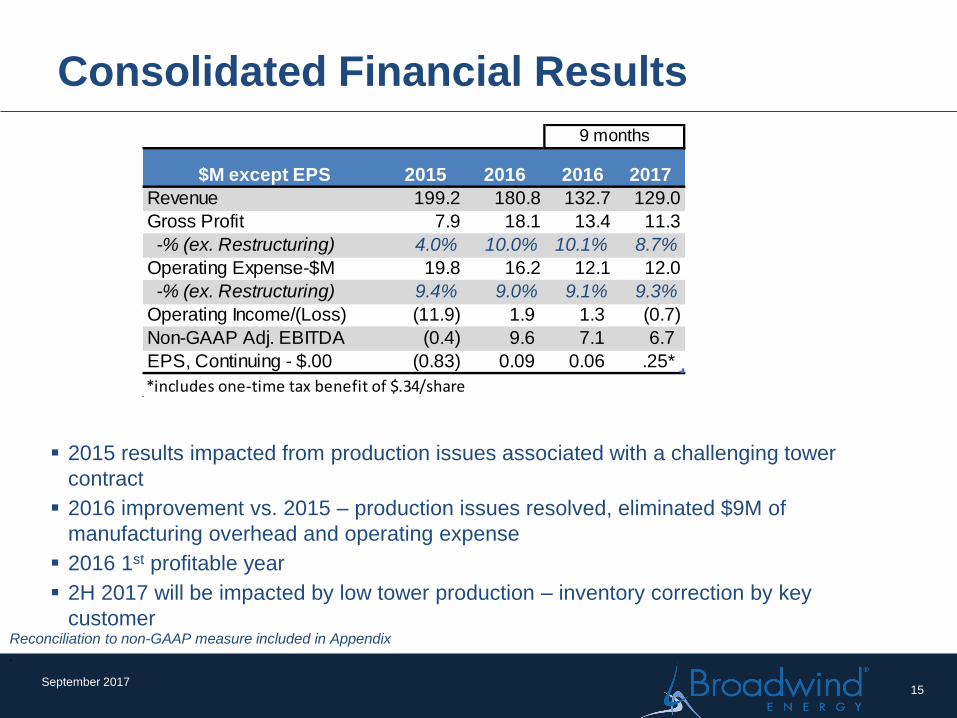
Consolidated Financial Results
September 2017
2015 results impacted from production issues associated with a challenging tower
contract
2016 improvement vs. 2015 – production issues resolved, eliminated $9M of
manufacturing overhead and operating expense
2016 1st profitable year
2H 2017 will be impacted by low tower production – inventory correction by key
customerReconciliation to non-GAAP measure included in Appendix
.
15
$M except EPS 2015 2016 2016 2017
Revenue 199.2 180.8 132.7 129.0
Gross Profit 7.9 18.1 13.4 11.3
-% (ex. Restructuring) 4.0% 10.0% 10.1% 8.7%
Operating Expense-$M 19.8 16.2 12.1 12.0
-% (ex. Restructuring) 9.4% 9.0% 9.1% 9.3%
Operating Income/(Loss) (11.9) 1.9 1.3 (0.7)
Non-GAAP Adj. EBITDA (0.4) 9.6 7.1 6.7
EPS, Continuing - $.00 (0.83) 0.09 0.06 .25*
*includes one-time tax benefit of $.34/share
9 months

Operating Working Capital (OWC)
September 2017 16
$-
$0.05
$0.10
$0.15
$0.20
Q3 OWC cents/$ sales flat compared to Q2 17
OWC dollars decreased as expected, due to lower sales and the timing of
customer receipts
*Operating Working Capital = Trade A/R +
Inventories – Trade Payables – Customer Deposits
OWC* Historical Trend – cents/$ salesOWC* Management

Balance Sheet and Capital Expenditures
September 2017 17
$1.6
$6.2$6.0
2015 2016 2017 YTD
Cap Ex Actual $M
Capital Expenditures
Q3 Debt declined by $6M due to working capital reduction
CIBC (previously The Private Bank) $25M credit line had $12M of additional availability
at quarter-end
Capital expenditures totaled $1.7M in Q3 17, $6.0M YTD – above normal 2% of sales
run rate due to Abilene expansion
12/31/2016 6/30/2017 9/30/2017
Cash Assets 21.9$ 0.2$ 0.0$
Accounts Receivable 11.9 21.5 9.3
Inventory 21.2 21.3 15.4
PPE 54.6 57.4 56.5
Other 8.1 24.6 24.1
Total Assets 117.7 125.0 105.3
Accounts Payable 15.9 14.6 7.1
Customer Deposits 18.0 5.2 2.1
Debt + Cap. Leases 4.1 19.1 12.9
Other 11.1 11.5 10.4
Total Liabilities 49.1 50.4 32.5
Equity 68.6 74.6 72.8
(In Millions)
% of sales 0.8% 3.4% 4.6%

Near Term Priorities
September 2017
Navigate through the impact of 2H tower inventory correction
Progress growth/diversification strategy
Commission Abilene plant expansion
Add machining capabilities for weldments
Red Wolf market expansion initiatives
Controlled Gearing revenue growth to achieve profitability
Evaluate bolt-on acquisitions
18

Investment Thesis
Medium term US Wind markets fundamentally strong, short term
weakness driving share price below tangible book value
Broadwind gearing gaining share in strong oil & gas market
Strong balance sheet –good working capital management
Conservative capital structure supports operating needs
>$200M NOL to shelter income for foreseeable future
December 2017 19

Appendix
December 2017 20
Consolidated
2017 2016 2017 2016
Net Income/(Loss) from continuing operations…………………………….(2,049)$ 1,245$ 3,745$ 929$
Interest Expense…………………………………. 228 125 584 431
Income Tax Provision/(Benefit)……………………………… (22) 0 (5,056) (16)
Depreciation and Amortization………………………………………………………………2,267 1,695 6,571 5,138
Share-based Compensation and Other Stock Payments………………………………………………………………439 195 900 628
Adjusted EBITDA (Non-GAAP)………………… 863$ 3,260$ 6,744$ 7,110$
Three Months Ended September 30, Nine Months Ended September 30,
Towers and Weldments Segment
2017 2016 2017 2016
Net Income…...……………………………. (901)$ 2,797$ 5,127$ 6,738$
Interest Expense/(Benefit)…………………………………. 28 5 63 21
Income Tax Provision/(Benefit)……………………………… (600) 1,259 2,003 3,285
Depreciation and Amortization………………………………………………………………1,121 1,007 3,283 3,066
Share-based Compensation and Other Stock Payments………………………………………………………………197 79 312 154
Adjusted EBITDA (Non-GAAP)…………………. (155)$ 5,147$ 10,788$ 13,264$
Three Months Ended September 30, Nine Months Ended September 30,
Gearing Segment
2017 2016 2017 2016
Net Loss……………………………. (393)$ (697)$ (2,568)$ (3,099)$
Interest Expense…………………………………. 3 1 9 8
Income Tax Provision/(Benefit)……………………………… (7) 5 (2) 7
Depreciation and Amortization………………………………………………………………610 638 1,847 1,918
Share-based Compensation and Other Stock Payments………………………………………………………………72 17 113 89
Adjusted EBITDA (Non-GAAP)…………………. 285$ (36)$ (601)$ (1,077)$
Three Months Ended September 30, Nine Months Ended September 30,
Process Systems
2017 2016 2017 2016
Net Income/(Loss)……………………………. 124$ -$ (1,817)$ -$
Interest Expense…………………………………. 1 - 4 -
Income Tax Provision/(Benefit)……………………………… (22) - (10) -
Depreciation and Amortization………………………………………………………………477 - 1,278 -
Share-based Compensation and Other Stock Payments………………………………………………………………18 - 34 -
Adjusted EBITDA (Non-GAAP)…………………. 598$ -$ (511)$ -$
Three Months Ended September 30, Nine Months Ended September 30,

Broadwind Energy is a precision
manufacturer of structures, equipment &
components for clean tech and other
specialized applications.
www.BWEN.com
September 201721

Corporate and Other Buyers are Becoming a
Significant Demand Driver for US Wind
September 2017 22
39% of MW contracted in 2016 through PPA’s were signed by Fortune
500 companies, universities and government agencies
Emergent and sustained demand market for wind industry
Google Energy
Microsoft
Amazon
IKEA
Owens Corning
Source: AWEA Annual Market Report 2016

Making a Wind Tower – More than Metal Bending
September 2017 23
Steel Plate Prepped Bevel Roll
Long Seam Flange Fit Up Circ Weld
Clip and Clean Blast and Paint Assembly

M&A Overview & Selection Criteria
Half of plan period revenue growth from inorganic transactions
Key Objectives:
Add scale
Diversify industry and customer mix
Unlock value of NOL’s
24
Financial Profile:
Consistency
Profitability
Growth Rate
Controls
Attractiveness:
Clean Tech or expands
existing businesses
Adds a new served
market
Strong mgt. team
Adds IP
Structure
Integration
complexity
Gating Factors:
>75% of income generated in US
Estimated timing for accretive
results <12 mos.
Diversifies BWEN customer risk
September 2017