Investor Presentation - South Indian Bank€¦ · Investor Presentation MARCH-2013. IMPORTANT...
20
Investor Presentation MARCH-2013
Transcript of Investor Presentation - South Indian Bank€¦ · Investor Presentation MARCH-2013. IMPORTANT...

Investor Presentation MARCH-2013

IMPORTANT NOTICE
2
No representation or warranty, express or implied is made as to, and no reliance should be placed on, thefairness, accuracy, completeness or correctness of such information or opinions contained herein. The informationcontained in this presentation is only current as of its date. Certain statements made in this presentation may not bebased on historical information or facts and may be “forward looking statements”, including those relating to theCompany’s general business plans and strategy, its future financial condition and growth prospects, and futuredevelopments in its industry and its competitive and regulatory environment. Actual results may differ materially fromthese forward-looking statements due to a number of factors, including future changes or developments in theCompany’s business, its competitive environment and political, economic, legal and social conditions in India. Thiscommunication is for general information purpose only, without regard to specific objectives, financial situations andneeds of any particular person. This presentation does not constitute an offer or invitation to purchase or subscribe forany shares in the Company and neither any part of it shall form the basis of or be relied upon in connection with anycontract or commitment Important Notice whatsoever. The Company may alter, modify or otherwise change in anymanner the content of this presentation, without obligation to notify any person of such revision or changes. Thispresentation can not be copied and/or disseminated in any manner.
2
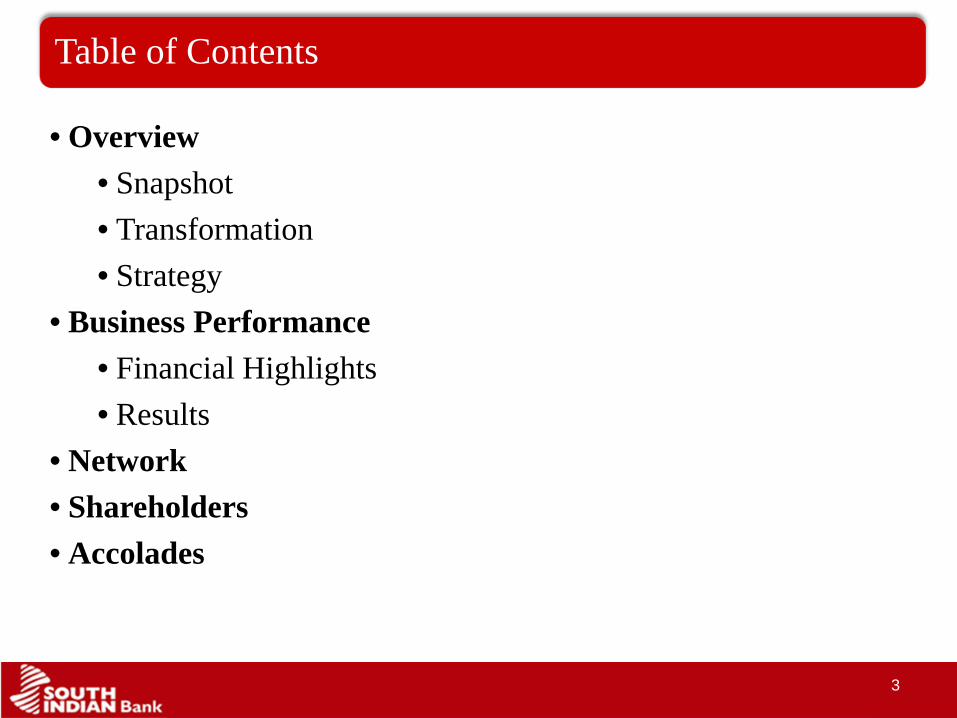
Table of Contents
3
• Overview • Snapshot • Transformation• Strategy
• Business Performance • Financial Highlights • Results
• Network• Shareholders• Accolades

Snapshot
4
Last 5 year CAGR: 26% business; PAT CAGR of 27%; RoAA up from 1.09% to 1.17%. Improving asset yield as bank builds fee income streams in addition to interest income
Steadily improving asset quality; GNPA at 1.36%, NNPA 0.78%
Mr. Amitabha Guha , Non Exec, Chairman (ex-Joint MD of SBI, ex MD -SBT, SBH)Proactive management led by Dr. V. A. Joseph, well supported by 2 ExecutiveDirectors, 2CGMs and 6 GMs – 6 GMs life time bankers at the bank
Young workforce (avg. age of 36 years) with continuity of management2 CEOs in the last decade
84 year old franchise; Leading position in Kerala; Expanding fast outside
Strong protection of stakeholder interestStock return of 592% since IPO, and 10.71% since QIP in 2012
Growth and Profitability
Quality
Board and Management
Building for future
Track record
Stakeholder value

5
Significant Transformation Since 2009
3.17
2.77
3.063.10
3.21
2.50
2.60
2.70
2.80
2.90
3.00
3.10
3.20
3.30
FY 09 FY 10 FY 11 FY 12 FY 13
NIM
0.96
0.92
0.89
0.991.01
0.820.840.860.880.900.920.940.960.981.001.02
FY 09 FY 10 FY 11 FY 12 FY 13
RoA
47.80
47.1446.82
48.65
47.48
45.50
46.00
46.50
47.00
47.50
48.00
48.50
49.00
FY 09 FY 10 FY 11 FY 12 FY 13
Cost to Income1.13
0.390.29 0.28
0.78
0.00
0.20
0.40
0.60
0.80
1.00
1.20
FY 09 FY 10 FY 11 FY 12 FY 13
Net NPA

Strategy
6
50 addition to branches, 100 ATM additions per yearProportion of branches outside Kerala : 1:1Second largest player in Kerala among private banks
Priority banking in 80 centres; NRE banking to attract depositsCASA ratio to increase 1% per annumCost/Income to decline 1% per annum
30% from wholesale banking ; 30% from SME and 40% from retail by FY15Credit growth rate of 25% till FY15; NIM to be maintained in 3% rangeFee income to be 10%NNPA to be under 0.50%
Strong distribution network
Low cost liabilities and Cost/Income
Growth with quality
Business Performance

8
Financial Highlights – As on March 2013
8
Rs. In Crore
Q4FY13 Q4FY12 Y-o-Y (%) Q3FY13 Q-o-Q (%)
Capital & LiabilitiesCapital 133.85 113.39 18.04 133.62 0.17Reserves & Surplus 2,869.76 2054.11 39.71 2,823.89 1.62Deposits 44,262.30 36500.53 21.26 38,939.56 13.67Borrowings 1,284.56 588.19 118.39 971.14 32.27Other Liabs. &Provisions 1,244.56 1113.84 11.74 1,011.19 23.08
Total 49,795.03 40370.06 23.35 43,879.40 13.48AssetsCash & Balances with RBI 1,696.70 1571.84 7.94 1,844.98 -8.04Balances with Banks 2,639.20 1068.70 146.95 1,516.03 74.09Investments 12,523.47 9399.87 33.23 10,509.92 19.16Advances 31,815.53 27280.74 16.62 29,039.41 9.56Fixed Assets 396.12 377.51 4.93 386.52 2.48Other Assets 724.01 671.40 7.84 582.54 24.28Total 49,795.03 40370.06 23.35 43,879.40 13.48Business (Advances+Deposit) 76,077.83 63781.27 19.28 67,979 11.91
Balance Sheet Overview
9
Result Review
9
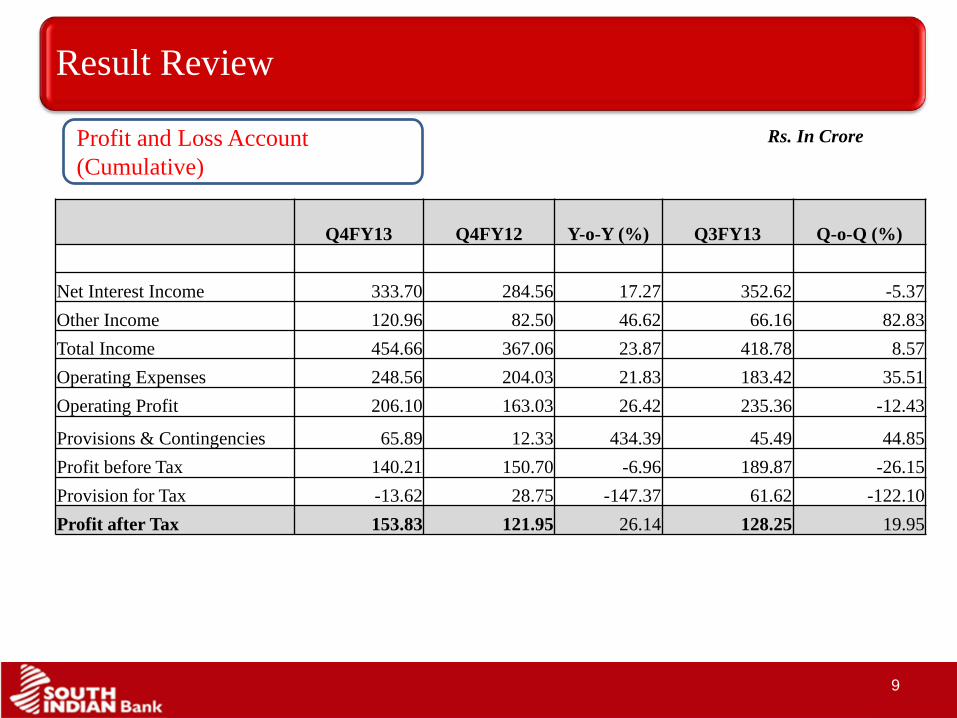
Rs. In CroreProfit and Loss Account (Cumulative)
Q4FY13 Q4FY12 Y-o-Y (%) Q3FY13 Q-o-Q (%)
Net Interest Income 333.70 284.56 17.27 352.62 -5.37Other Income 120.96 82.50 46.62 66.16 82.83Total Income 454.66 367.06 23.87 418.78 8.57Operating Expenses 248.56 204.03 21.83 183.42 35.51Operating Profit 206.10 163.03 26.42 235.36 -12.43
Provisions & Contingencies 65.89 12.33 434.39 45.49 44.85Profit before Tax 140.21 150.70 -6.96 189.87 -26.15Provision for Tax -13.62 28.75 -147.37 61.62 -122.10Profit after Tax 153.83 121.95 26.14 128.25 19.95
10
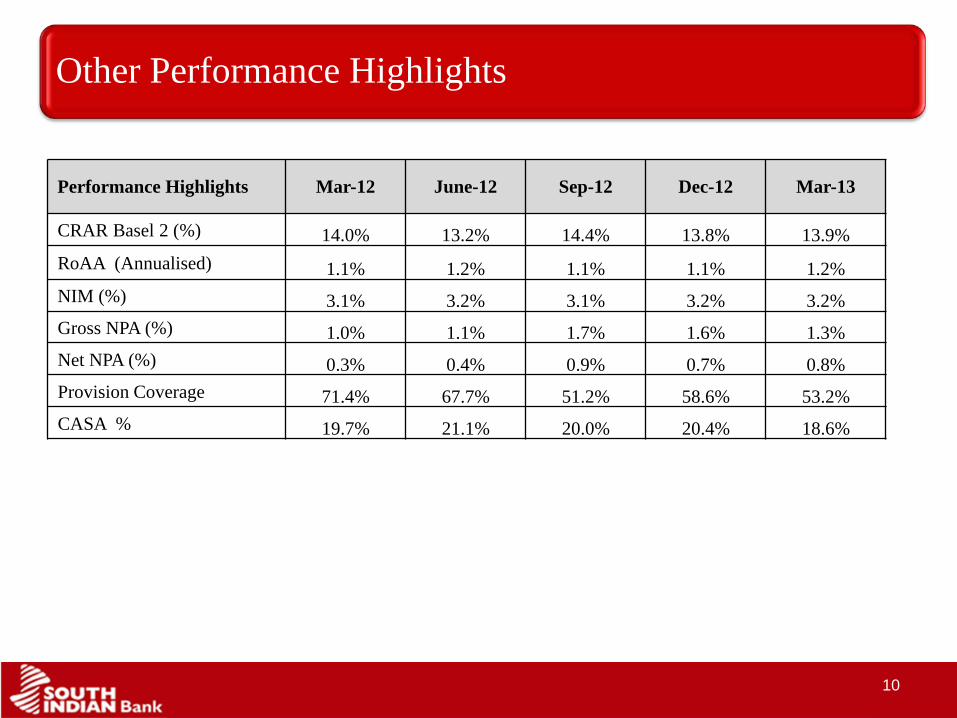
Performance Highlights Mar-12 June-12 Sep-12 Dec-12 Mar-13
CRAR Basel 2 (%) 14.0% 13.2% 14.4% 13.8% 13.9%RoAA (Annualised) 1.1% 1.2% 1.1% 1.1% 1.2%NIM (%) 3.1% 3.2% 3.1% 3.2% 3.2%Gross NPA (%) 1.0% 1.1% 1.7% 1.6% 1.3%Net NPA (%) 0.3% 0.4% 0.9% 0.7% 0.8%Provision Coverage 71.4% 67.7% 51.2% 58.6% 53.2%CASA % 19.7% 21.1% 20.0% 20.4% 18.6%
Other Performance Highlights
10

11
Composition of Other Income
11
Composition of Other Income
Q4FY13 Q4FY12 Y-o-Y (%) Q3FY13 Q-o-Q (%)
Commission & Exchange 11.49 13.53 -15.07 9.62 19.44
Processing Fees 7.67 6.07 26.35 4.82 59.13
Profit on Sale of Investments 13.74 8.96 53.35 13.17 4.33
Foreign Exchange Profit 11.89 6.15 93.33 3.90 204.87
Others 76.17 47.79 59.38 34.65 119.83
Total 120.96 82.50 46.67 66.16 82.83
Rs. In Crore

12
Trend in Cost of Deposits
Trend in Cost & Yield (Annualized)
Trend in Yield on Advances
7.3 6.9 6.6
7.9 8.3
0.0
1.0
2.0
3.0
4.0
5.0
6.0
7.0
8.0
9.0
Mar-09 Mar-10 Mar-11 Mar-12 Mar-13
11.7
11.110.9
12.512.7
9.5
10.0
10.5
11.0
11.5
12.0
12.5
13.0
Mar-09 Mar-10 Mar-11 Mar-12 Mar-13

13
Break-up of Provision (other than tax)
13
Particulars 4Q FY 13 4Q FY12 3Q FY 13
For NPA advance 42.07 13.70 25.97For Depreciation on Investments 9.73 -10.41 1.51For standard assets 15.46 11.55 9.75For Restructured advances -0.12 0.67 8.21Others -14.88 25.56 61.67
Total Provisions and Contingencies 52.26 41.07 107.11
Rs. In Crore(Quarter alone)
14
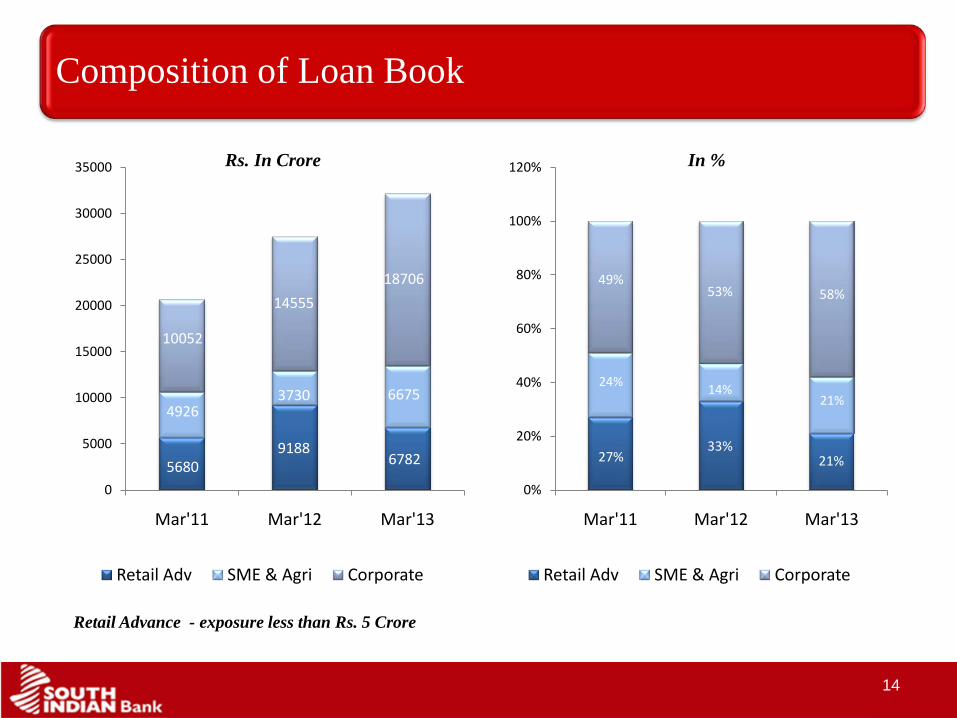
Composition of Loan Book
56809188
6782
49263730 6675
10052
1455518706
0
5000
10000
15000
20000
25000
30000
35000
Mar'11 Mar'12 Mar'13
Retail Adv SME & Agri Corporate
Rs. In Crore
27%33%
21%
24% 14%21%
49%53% 58%
0%
20%
40%
60%
80%
100%
120%
Mar'11 Mar'12 Mar'13
Retail Adv SME & Agri Corporate
In %
Retail Advance - exposure less than Rs. 5 Crore

15
Advances – Composition (March 2013)
Sector Total % to Total
Gold Loan 6,972 21.7 %
Infrastructure 5,340 16.6 %
MSE 4,525 14.1 %
Large Industry(Ex. Infra) 4,501 14.0 %
UBP/LC 2,868 8.9 %
Agriculture 2,149 6.7 %
Others 1,801 5.6 %
Housing 1,621 5.0 %
FSLD 1,051 3.3 %
Medium Industries 649 2.0 %
Food Credit 555 1.7 %
CRE 131 0.4 %32,163 100 %
Rs. In Crore

16
Strong Core Capital. Low Dependence on Capital Instruments
Strong Core Capital (Tier 1 & Tier 2 CRAR)
Quarterly data for Tier I excludes profit for the period
11.5410.90
12.32 11.78 12.05
2.46 2.26 2.11 2.07 1.86
0
2
4
6
8
10
12
14
Mar-12 Jun-12 Sep-12 Dec-12 Mar-13
Tier I CRAR Tier II CRAR

17
Branch Network
No. of Branches
North 46
South 634
East 24
West 46
Total 750
Target 1:1 Outside Kerala
18
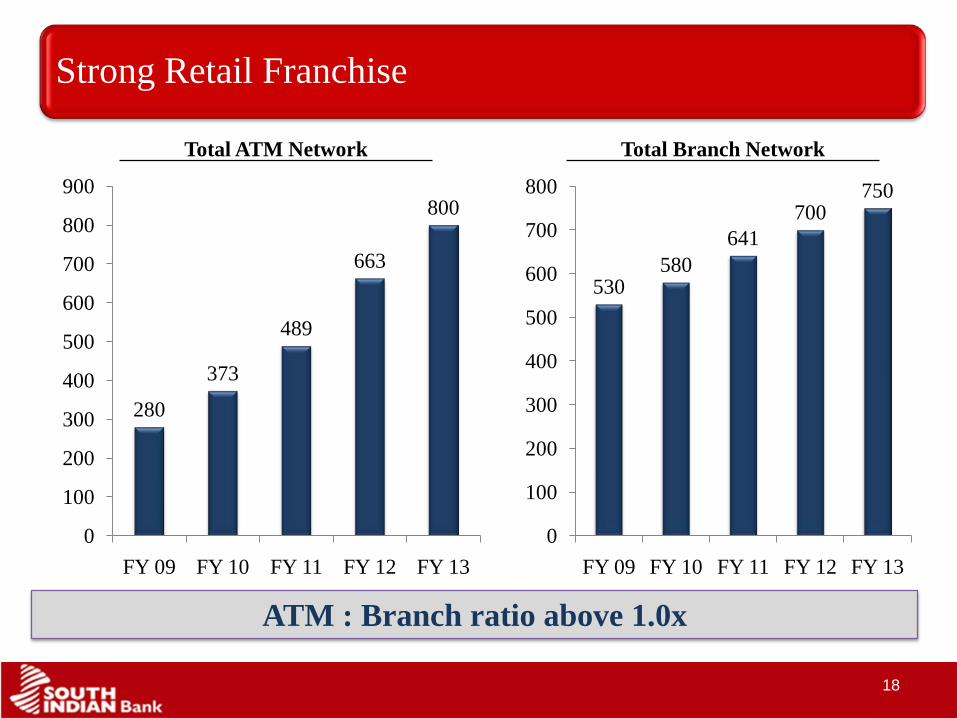
Strong Retail Franchise
Total Branch NetworkTotal ATM Network
ATM : Branch ratio above 1.0x
280
373
489
663
800
0
100
200
300
400
500
600
700
800
900
FY 09 FY 10 FY 11 FY 12 FY 13
530580
641700
750
0
100
200
300
400
500
600
700
800
FY 09 FY 10 FY 11 FY 12 FY 13

19
Marquee Investor List
Major Institutional Shareholders
Public, 32.36
Domestic, 9.00NRI,
2.25
FII, 43.97
Corp & Banks, 9.57
Others, 2.75
Strong Institutional Ownership
INDIA CAPITAL FUND LIMITED 5.9%
IFCI LTD 4.98%
FIRST CARLYLE VENTURES MAURITIUS 4.97%
ARGONAUT VENTURES 4.24%
IIFL INC A/C MULTIPLES PRIVATE EQUITY FII I 4.05%
LIFE INSURANCE CORPORATION OF INDIA 3.69%

Recognitions
20
TECHNOLOGY EXCELLENCE AWARD 2011-12 FROM IDRBT
BUSINESSWORLD INDIA’s BEST BANK 2010 AWARD to SOUTH INDIAN BANK
SOUTH INDIAN BANK BAGS TWO PRESTIGIOUS D&B BANK AWARDS
SOUTH INDIAN BANK BAGS FIRST MASTERCARD INNOVATION AWARD FOR ACTIVATION AND USAGE PROGRAM