Investor presentation - september 2019 - Enel
84
Investor Presentation September 2019
Transcript of Investor presentation - september 2019 - Enel

Investor Presentation
September 2019

This presentation contains certain forward-looking statements that reflect the Company’s management’s current views with
respect to future events and financial and operational performance of the Company and its subsidiaries. These forward-looking
statements are based on Enel S.p.A.’s current expectations and projections about future events. Because these forward-looking
statements are subject to risks and uncertainties, actual future results or performance may differ materially from those expressed
in or implied by these statements due to any number of different factors, many of which are beyond the ability of Enel S.p.A. to
control or estimate precisely, including changes in the regulatory environment, future market developments, fluctuations in the
price and availability of fuel and other risks. You are cautioned not to place undue reliance on the forward-looking statements
contained herein, which are made only as of the date of this presentation. Enel S.p.A. does not undertake any obligation to
publicly release any updates or revisions to any forward-looking statements to reflect events or circumstances after the date of
this presentation. The information contained in this presentation does not purport to be comprehensive and has not been
independently verified by any independent third party.
This presentation does not constitute a recommendation regarding the securities of the Company. This presentation does not
contain an offer to sell or a solicitation of any offer to buy any securities issued by Enel S.p.A. or any of its subsidiaries.
Pursuant to art. 154-bis, paragraph 2, of the Italian Unified Financial Act of February 24, 1998, the executive in charge of
preparing the corporate accounting documents at Enel, Alberto De Paoli, declares that the accounting information contained
herein correspond to document results, books and accounting records.
Disclaimer
2

We are a leader in the new energy world
1. By number of customers. Publicly owned operators not included
2. By installed capacity. Includes managed capacity for 4.2 GW
3. It includes nuclear
4. Includes customers of free and regulated power and gas markets
1st private network
operator1
World’s largest private
player2 in renewables
Largest retail customer
base worldwide1
73 mn end users
70.4 mn customers4
43.4 GW capacity2
46.4 GW capacity3
6.2 GW demand response
En
el to
da
y
3

4.4 €bn
46%
28%
7%
18%
0.7 €bn
100%
Our business model is well diversified and provides long term visibility
7.1 €bn
50%
16%
32%
2%
Italy
South America
North & Central America Rest of Europe
1. As of 2018. Breakdown excludes -0.2 €bn from holding and services
Presence with operating assets or through Enel X
Africa, Asia & Oceania
2018 Group EBITDA1
16.2 €bn
3.6 €bn
Iberia
55%
10%12%
19%
4%
0.5 €bn
30%
46%2%
22%
0.1 €bn
100%
44%
46%
10%
En
el to
da
y
Networks Thermal generation Renewables Retail Other
4

Progress on strategic pillars
Continued exceptional delivery on renewables developmentDouble digit increase in end users
Further decline in operating costs
Portfolio rotation and further simplification to accelerate growth and optimize risk profile
Significant progresses on SDGs 4, 7 and 8
En
el to
da
y
5

Delivery on financial targets
Net ordinary income (€bn)
Dividend per share (€)
Ordinary EBITDA (€bn)
Net debt (€bn)
FFO/Net debt
3.7
0.237
15.6
2017
37.4
27%
4.1
16.2
2018
41.1
27%
0.28
4.1
16.2
2018 target1
41-42
26.5%
0.28
+9%
+4%
∆ YoY
+10%
- %
+18%
✔
✔
✔
✔
✔
En
el to
da
y
1. Target set in November 2018 with Strategic Plan 2019-21
6

2019-2021
Our Sustainable Strategy

Macro trends affecting our business
1.Sources: 1.IEA WEO 2018. SDS = Sustainable Development Scenario aligned to Paris Agreement; 2 United Nations, World Population Prospects, The 2014,2015 & 2018 revision; 3 BNEF NEO 2018
24
39
15.0 0
20.0 0
25.0 0
30.0 0
35.0 0
40.0 0
45.0 0
50.0 0
2016 2040
286
462
0
100
200
300
400
500
600
2018-25 2026-40
Average yearly grid capex (€bn)1
Urbanization rate 2015-2050 (%)2
49
78
66
87
20.0 0
30.0 0
40.0 0
50.0 0
60.0 0
70.0 0
80.0 0
90.0 0
100 .00
110 .00
120 .00
Less developedcountries
Developed countries2050
2015
+1.3x
+1.1x
Global power demand (‘000. TWh)3
60%
World renewables installed capacity (TW)1
60%
2.2
9.9
-
2.00
4.00
6.00
8.00
10.0 0
12.0 0
2016 2040
360%
# people living in cities
(bn) 1.1 5.53.00.9
Ou
r su
sta
ina
ble
str
ate
gy
8

Our commitment on U.N. SDGs
Direct actions
Contribution & behaviors
7 AFFORDABLE AND
CLEAN ENERGY 13CLIMATE
ACTION 11SUSTAINABLE
CITIES AND
COMMUNITIES9INDUSTRY
INNOVATION AND
INFRASTRUCTURE
9
Ou
r su
sta
ina
ble
str
ate
gy

Enel’s direct actions on SDG 7, 9, 11 and 13…
7 AFFORDABLE
AND CLEAN
ENERGY
9INDUSTRY
INNOVATION AND
INFRASTRUCTURE
11SUSTAINABLE
CITIES AND
COMMUNITIES
<0.345 kg/kWheq in 2021 CO2 emission reduction
+11.6 GW renewable capacity
55% renewable installed capacity by 2021
46.9 mn Smart Meters
5.4 €bn digital capex for Innovation2
+9.9 GW Demand Response
+173 MW/y storage
455 k charging points for Mobility
8.5 mn households passed in fiber deployment
~12 €bn
~11 €bn
~2 €bn
13CLIMATE
ACTION
Direct actions Capex 2019-2021 Key actions 2019-2021
1. Global Business Lines
2. Across GBLs
GBLs1
Ou
r su
sta
ina
ble
str
ate
gy
10

…and commitment to all 17 SDGP
illa
rs
Growth across low carbon
technologies & services
Operational improvement for a better
service
Engaging local communities
Engaging the people we work with
Bac
kb
on
es
Occupational Health & Safety
Sound governance
Environmental sustainability
Sustainable supply chain
Economic and financial
value creation
1 2 3 4 5 6 7 8 9 10 11 12 13 1514 16 17
Cro
ss
Bo
os
t
Digitalization and innovation
Public commitment
Ou
r su
sta
ina
ble
str
ate
gy
11

Our ability to reach the decarbonization target1
37 39.2 39.4
2015 2018 2021E
89.7 85.6
A greener installed base… …thanks to growing execution capability
41% 46% 55%Renewables/Total capacity
344 382
887 930 932 1,000 924
2,018
3,000 3,100
2009 2012 2015 2018
Additional renewables capacity2 (MW)
Future growthambitions
>4 GW yr
Decarbonization
-7 GW Thermal capacity reduction
+11.6 GW Renewables commissioning2
Consolidated Capacity (GW)
H1 2019
85.8
46%
1. The target is in line with the Strategic Plan 2019-2021 presented in November 20182. This includes: capacity built and capacity built and subsequently sell through the BSO model. 70% wind and 30% solar
12
Ou
r su
sta
ina
ble
str
ate
gy

Asset development supports our sustainable growth ambitions
Total gross capex by business and by nature1 2019-21
28%
64%
4%4%
Networks Renewables Thermalgeneration
Enel X
Asset development by business1 2019-21
16.5 €bn16.5
4.8
6.2
Asset development Customers Asset management
27.5 €bn
40%
42%
9%
4%5%
Networks Renewables ThermalGeneration
Enel X Retail
27.5 €bn
1. Includes 1.6 €bn BSO capex
Ou
r su
sta
ina
ble
str
ate
gy
13

Growth driven by networks and renewables
+1.0
+1.2
+0.4
+0.5
+0.5
2018 target vs 2021
64%
28%
4%
0%
10%
20%
30%
40%
50%
60%
70%
80%
90%
100 %
Asset development
16.5
Capital allocation 2019-21 (€bn)
25%
66%
9%
0%
10%
20%
30%
40%
50%
60%
70%
80%
90%
100 %
Customers
4.8
15%
52%
30%
0%
10%
20%
30%
40%
50%
60%
70%
80%
90%
100 %
Asset management
6.2
Incremental EBITDA2 (€bn)
11.6
1.3
11.1
1.1
2.5
Total by business1
1. It excludes other equal to -0.1 €mn. Thermal generation includes nuclear. Calculated on 2018 target
2. Excluding the impact of our asset rotation programme
Ou
r su
sta
ina
ble
str
ate
gy
14

6%
14%
30%
37%
4% 9%
Renewables are the driving force of growth
10.6 €bn
Higher investments to build
11.6 GW additional capacity
Focus on markets with integrated
presence & on developed countries
Maximization of portfolio returns
Value creation through decarbonization
& integration with retail portfolio
3%
16%
29%
33%
4%
15%
~11.6 GW2
Additional capacity by geography
70% 28%Italy
Iberia
South America North & C. America
Rest of Europe Africa, Asia & Oceania
1. Includes 1.6 €bn BSO capex
2. Of which 1.8 GW related to BSO and 0.8 GW related to JVs.
Asset development capex1 2019-21
By technology
Ou
r su
sta
ina
ble
str
ate
gy
15

Decarbonization shapes our capacity and improves margins
Total installed capacity 2018-211 (GW)
43.4 42.953.9
46.4 46.5
7.0 11.6
39.5
(0.6)
-10
10
30
50
70
90
110
FY 2018 Target2018
Thermal capacityreduction
Renewablesadditions
2021
48% 62%Emission free production3
89.4 93.4
2
CO2 specific emissions <0.35 kg/kWheq in 20204
CO2 specific emissions 0.23 kg/kWheq in 2030Decarbonization in 2050
Renewables extra margin
1. Includes managed capacity for renewables. Thermal generation includes 3.3 GW of nuke installed capacity.
2. 0.6 GW additional capacity subject to portfolio rotation
3. Emission free production includes nuclear generation and production form managed capacity in 2018.
4. Target certified as «Science based». CO2 specific emissions will be <0.345 kg/kWheq in 2021
0.0
10.0
20.0
30.0
40.0
50.0
60.0
70.0
80.0
90.0
Thermal cost Solar LCOE
~20%
extra margin127
99
24
98
132
26
Thermal GenerationRenewables Nuclear
ProductionTwh
250
ProductionTwh
25689.8
51%
Ou
r su
sta
ina
ble
str
ate
gy
16

42%
29%
29%
Asset development
Customers
Asset Management
44%
17%
36%
3%
Italy Iberia
South America Rest of Europe
Networks’ investments tailored to maximize asset base value
11.1 €bn
Gross capex 2019-21 by nature & by geography
11.1 €bn
Restructuring of Eletropaulo
Completion of Goias turnaround
Resiliency and flexibility in Italy and
Spain
2021 RAB ~45 €bn: ~30% South
America, ~70% Europe
Digitalization to promote efficiencies
and improve service quality
Ou
r su
sta
ina
ble
str
ate
gy
17

39%
21%
27%
13%
Italy Iberia South America North & C. America
Enel X capital allocation addresses customers’ needs
1.1 €bn1.1 €bn
59%
41%
Asset development Customers
Gross capex 2019-21 by nature & by geography
Smart lighting and fiber optics for cities
Electric mobility in Italy, Spain, US and
Romania
Energy efficiency solutions
Demand response and storage solutions
for C&I customers
Ou
r su
sta
ina
ble
str
ate
gy
18

Driving efficiencies across all businesses
8.5 8.7
0.6 0.1 (1.2)
8.1
2018ACTUAL
2018E CPI &Forex
Growth Efficiency 20212
Opex evolution (€bn)1
-7%
33%
23%
36%
8%
Networks Thermalgeneration
Retail Other
Efficiency by business
1.2 €bn
1. Total fixed costs in nominal terms (net of capitalization)
2. Of which CPI +0.9 €bn and forex -0.3 €bn
Ou
r su
sta
ina
ble
str
ate
gy
19

Operating risk: low EBITDA exposure to merchantrisk
72%
28%
0%
20%
40%
60%
80%
100 %
120 %
2019-21 EBITDA
Regulated &
contracted
Merchant
55.3
Regulated EBITDA by business 2019-21
~ 64%Regulated, contracted under long term
PPA, incentivized
~ 100%Regulated
~ 46%Regulated
~ 20%Regulated
~ 23%Regulated
EBITDA 2019-21 (€bn)
Retail portfolio hedge
Ou
r su
sta
ina
ble
str
ate
gy
20

Enel is positioned among the leading utilities on the
main ESG ratings
(1) Sustainalytics measures the ESG risk, the lower the score the higher the performance
(2) The scoring methodology of MSCI ranges from AAA to CCC
(3) The scoring methodology of CDP ranges from A to F. They do not elaborate a stock market index
Stock Market
Indices in which
Enel is included
ESG rater
Main ESG Ratings & Indices
22.9/100 4.9/5Climate: A-
Water: BAA
MSCI ESG
Universal
Indices
MSCI ESG
Focus Indices
(2)(3)
85/100 67/100
Ou
r su
sta
ina
ble
str
ate
gy
(1)
21
Evolution of the sustainable
finance landscape

Sustainable finance market overview so far1
1. Source: BloomberNEF dataset
2. Year to date
Despite the evident growing path, it is estimated that the green bonds, social bonds and sustainability
bonds market accounts for less than 2 per cent of global fixed income issuance
Sustainable debt issuance by year, $bn equivalent
2Pre-2012 2012 2013 2014 2015 2016 2017 2018 2019
Green bond Sustainability-linked loan Sustainability bond Social bond Green loan
13.4 5.014.8
43.0
57.3
111.9
199.5
261.3248.1
23

Rise of a new approach to sustainable finance
“These loan products offer a refreshing new take on ‘sustainability’ in debt markets, and arguably
have the potential to scale up to a greater extent than their green bond and loan cousins.
The loans offer a new way to capture sustainability characteristics within debt products, by linking
the strategy of the borrower to debt terms. Terms are typically preferential for borrowers that meet pre-
determined sustainability performance targets.
This approach to sustainability is markedly different from that offered by green bonds, social bonds
and green loans, which define sustainable debt by the use of the proceeds from those debt
products. Removing restrictions on the use of proceeds could turbo-charge the market.”
These corporate SDG bonds can take the form of use-of-proceed bonds whereby companies can identify
specific assets or projects that contribute to the SDGs and commit to a strict accountability on use-of-
proceed bonds. In the absence of such assets and projects, or if companies are looking to finance a
more comprehensive SDG strategy at the corporate level, corporate SDG bonds can be issued as
general-purpose bonds with a commitment to accountability on the general use of proceeds and
corporate-level impacts (general-purpose bonds).
BloombergNEF, Rise of Sustainability-Linked Loans Aided by ‘Principles’, March 21, 2019
SDG Bonds & Corporate Finance - A Roadmap to Mainstream Investments,
The UN Global Compact Action Platform on Financial Innovation for the SDGs, 201824

25
Context and principles of Enel’s SDG Bond Programme
Discover more by clicking here
Our strategy creates value through the pursuit of SDG 7 “Affordable and clean energy”, SDG 9 “Industry, innovation and infrastructure”, SDG 11 “Sustainable cities and communities” and SDG 13 “Climate action”
Our leading role in the sustainable finance space, with 3.5€B green bonds issued in the last 3 years, allows us to raise our voice
The effect of “use of proceeds”: green bonds account for less than 2% of the global fixed-income issuance
The necessity to scale the sustainable finance market with a new general purpose instrument linked to a pre-determined sustainability target, complementing the use-of-proceeds green bond space
The urgent need to act fast and now to tackle the world’s challenges

A market solution for sustainable finance
Leverage on an issuer’s
sustainability strategy
Expand the current reach
of sustainable finance
Promote a replicable
future issuance
framework
Create a direct link between an issuer’s
sustainability strategy and its funding strategy
Provide investors with more tools to deploy their
capital towards the energy transition
• Commitment to sustainability
• Economic incentive to deliver
• Ensuring transparency
• Aligned with sustainable corporate
strategy
Strong alignment of corporate strategy with
the UN SDGs across all lines of business
Early adopter of the Green bond framework
and promoter of sustainable finance growth
Strong believer in transparency and firm-wide
reporting
• Ambitious SDG Targets1
• Premium paid to investor via coupon
step-up or potentially higher redemption
if SDG Target not achieved
• Externally verified SDG metric
• UoP: General corporate purposes
The Path Ahead Enel’s Commitments
2
3
4
1
2
3
4
1
1. There can be no assurance of the extent to which we will be successful in doing so or that any future investment we make in furtherance of this target will meet investor’s expectations or any binding or non-binding legal standards regarding sustainability performance.
26

2019-2021
Our credit profile

Key financial targets and credit metrics
Ou
r cre
dit p
rofile
Net ordinary income (€bn)
Ordinary EBITDA (€bn)
4.1
16.2
2018
4.8
17.4
2019
5.4
18.5
2020
5.6
19.4
2021
Net Debt/EBITDA 2.5x 2.4x 2.3x 2.2x
Net Debt (€bn) 41.1 41.8 42.2 41.8
FFO/Net Debt 27.0% 27.4% 28.6% 31.1%
Earnings growth
Credit metrics
Strong credit profile, stable debt and improving metrics
28

…have been recognized by Rating Agencies
Strong track record of delivery. Global leadership in networks and renewables.
Large share of regulated and quasi-regulated activities. Positioning at the
forefront of innovation and sustainability in the utilities sector.
No automatic link with Italy.1
Enel’s LT rating
Rating Outlook
Progress in delivering against strategic priorities. Increasing international
diversification with corresponding reduction in the proportion
of earnings from Italy. Improving business risk profile as a result
of continuing investment in networks and renewables3.
Magnitude of operating scope and diversified portfolio.
Well-balanced generation mix, with a significant share of renewables globally.
The company is transforming to become greener and more energy-efficient
by reallocating its growth capex to renewables and networks2.
A- Stable
BBB+ Stable
Baa2 Positive
1. Extract from Fitch Press Release dated 27th Feb 2019.
2. Extract from S&P Research Update dated 2nd Aug 2019
3. Extract from Moody’s Credit Opinion dated 17th July 2019.
Italy’s LT rating
Rating Outlook
BBB Negative
BBB Negative
Baa3 Stable
29
Ou
r cre
dit p
rofile

Stable debt throughout the plan
41.1
0.3(27.5)
(13.9)
0.0
5.0
10. 0
15. 0
20. 0
25. 0
30. 0
35. 0
40. 0
45. 0
50. 0
Sourcesof funds
IncrementalDebt
Gross capex Dividends
Source of funds allocation 2019-21 (€bn)
41.1 ~41.8 ~42.2 ~41.8
2018 2019 2020 2021
Net debt evolution (€bn)
-%
1H 20191
45.4
1. Includes 1.4€bn of IFRS 16 impact.
30
Ou
r cre
dit p
rofile

Continued reduction in cost of debt
Bond refinancing
including green bonds1
Bank loans and other
financing
Hybrid refinancing
Financial strategy for 2019-21 (€bn)
6.2
2.8
1.8
2.62.3 2.3 2.2 2.2
5.0%
4.6% 4.6%4.4% 4.4%
2.5 0%
3.0 0%
3.5 0%
4.0 0%
4.5 0%
5.0 0%
0
0.5
1
1.5
2
2.5
3
3.5
4
2015 2018 2019 2020 2021
Net financial expenses on debt (€bn)
-4%
Cost of gross debtNet financial expenses
4.5%
Total 13.6 4.8%
Amount
Emerging markets 2.8
4.2%
2.3%
6.4%
Current total
cost
7.6%
3%
2.5%
4.9%
7.4%
Expected
cost2
4.1%
1. 1 €bn Green bond already issued in January 2019, Long 6Y, Coupon 1.500%
2. Enel estimates on current cost associated with financial instruments
FY 2018
Ou
r cre
dit p
rofile
€1.9bn and $1.5bn already refinanced in 2019
January: €1bn of 1.5% Green Bond
May: €0.9bn 3.5% hybrid (€0.6bn exchange offer)
September: $1.5bn 2.65% General Purpose SDG Linked Bond31

Financial risk: limited re-financing needs; strong available liquidity
15.0
5.8
Available committed credit lines Cash
20.8 €bn
2019-21 Liquidity available1
1.5
4.0 3.7
9.2
0.0
2.0
4.0
6.0
8.0
10.0
12.0
14.0
2019 2020 2021 Total
Debt maturity by year1 (€bn)
153%
1. As of June 30th, 2019.
2.4% 6.8% 6.3%
Maturities/Gross Debt
Refinancing on
average gross debtTotal liquidity / Maturities
New plan Last 3 yrs
8.2% 16.0%
32
Ou
r cre
dit p
rofile

Annexes
2019-2021 Strategic plan

Operating risk: natural margin hedge from retail portfolio
Ris
k m
an
ag
em
en
t
100%84%
0%
20%
40%
60%
80%
100 %
120 %
140 %
160 %
2019 2020
-
10.0
20.0
30.0
40.0
50.0
60.0
GenerationGross margin
A Retailportfolio
Renewables+ Nuke
87%
Coal & Gas
13%
Natural hedging with
retail portfolio
Hedging of CDS-CSS
based on
scenario/market
Integrated margin – Generation GM vs retail GM Hedging position on price driven production
Pool price
indexed
Small and
medium
customers
Large
customers
+13%Ren & Nuke
hedged price vs
2018
+19%
=Retail margin vs
2018=
34

Operating risk: low regulatory risk over the plan period
Ris
k m
an
ag
em
en
t
1. WACC nominal pre-tax
2. Blend of Rio, Cearà, Goias and Eletropaulo
Highly visible frameworks
Argentina
Brazil2
Chile
Colombia
Peru
Italy
Iberia1
Romania
2019 2020 2021 20222018
2019-21 BP
South
America
2019-21 BP
Stable and mature regulations
WACC WACC
5.9%
5.58%
5.7%
12.3%
11.8% - 11.4%
10%
12.5%
12%
Europe 2019 2020 20222018 2021
35

Operating risk: renewables growth alreadysignificantly addressed
Ris
k m
an
ag
em
en
t
1. It includes managed capacity
2. As of July 2019
3. Includes 2019-2021 CODs only
11.6
9.3
2.3
0.0
2.0
4.0
6.0
8.0
10.0
12.0
14.0
Target additional capacity Addressed Residual target
2019-21 Additional capacity addressed1 (GW)
80% addressed
Pipeline by geography and technology2 (GW)
16%
2%
43%
22%
16%
Italy and Iberia Rest of Europe South America
North & C. America Asia/Australia
45%
54%29.1 GW
Total pipeline / residual target
~ 6x
~ 13x
Short term pipeline3 / residual target
2019
2020
2021
Coverage
by yr
100%
89%
57%
36

Currency risk: low exposure to volatile currencies
63%
5%32%
Europe North America South America
2019-21 EBITDA by currency
55.3 €bn
2019-21 EBITDA by geography
63%
11%26%
EUR USD South America
55.3 €bn
Ris
k m
an
ag
em
en
t
FX sensitivity1 – Avg. yearly impact 2019-21 (€mn)
1. Sensitivity based on +/-10% USD/LOC (EUR/USD @Plan). Rounded figures
(180) 225
(35) 40
(6) 6
(100) 125
(20) 25
BRL
ARS
CLP
COP
PEN
(30) 35
(6) 8
- -
(12) 15
(2) ~3
Group NIEBITDA
(340) 420 TOTAL (50) 60
(1.8%) 2.3% % on yearly
value(<1.0%) 1.1%
37

22%
78%
Floating Fixed + Hedged
55.1 €bn
57%
30%
6%
7%
EUR USD GBP Other
Financial risk: gross debt hedges softening FX swings and rates movements
Ris
k m
an
ag
em
en
t
86%
7%
7%
EUR USD GBP Other
55.1 €bn55.1 €bn
Gross debt by currency at 2021 After swap Interest rate composition
38

New investment cycle drives growth while debt remains stable
8.29.2
-
1.0
2.0
3.0
4.0
5.0
6.0
7.0
8.0
9.0
10.0
2018-20Old Plan
2019-21
Net income (€bn)
41.1 41.8
10.0 0
15.0 0
20.0 0
25.0 0
30.0 0
35.0 0
40.0 0
45.0 0
50.0 0
2018 2021
Net Debt (€bn)
2%
Average capex (€bn)
+12%
4.1
5.6
-
1.00
2.00
3.00
4.00
5.00
6.00
7.00
2018 2021
+37%
EBITDA (€bn)
16.219.4
-
2.0
4.0
6.0
8.0
10.0
12.0
14.0
16.0
18.0
20.0
2018 2021
+20%
Ou
r p
lan
39
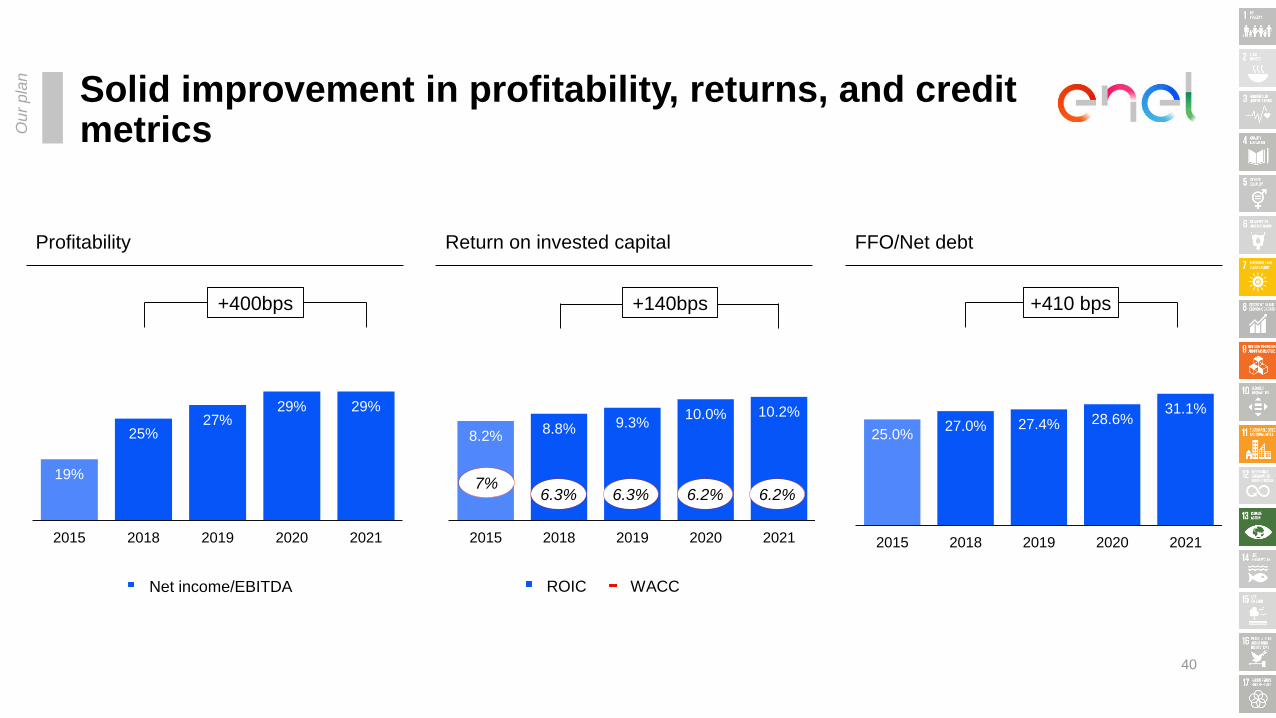
Solid improvement in profitability, returns, and credit metrics
FFO/Net debtReturn on invested capitalProfitability
19%
25%27%
29% 29%
0.1 0
0.1 5
0.2 0
0.2 5
0.3 0
0.3 5
2015 2018 2019 2020 2021
Net income/EBITDA
25.0%27.0% 27.4% 28.6%
31.1%
0.0 %
5.0 %
10.0%
15.0%
20.0%
25.0%
30.0%
35.0%
2015 2018 2019 2020 2021
Ou
r p
lan
8.2%8.8% 9.3%
10.0% 10.2%
0.0 %
2.0 %
4.0 %
6.0 %
8.0 %
10.0%
12.0%
14.0%
2015 2018 2019 2020 2021
ROIC WACC
7%6.3% 6.3% 6.2% 6.2%
+400bps +140bps +410 bps
40
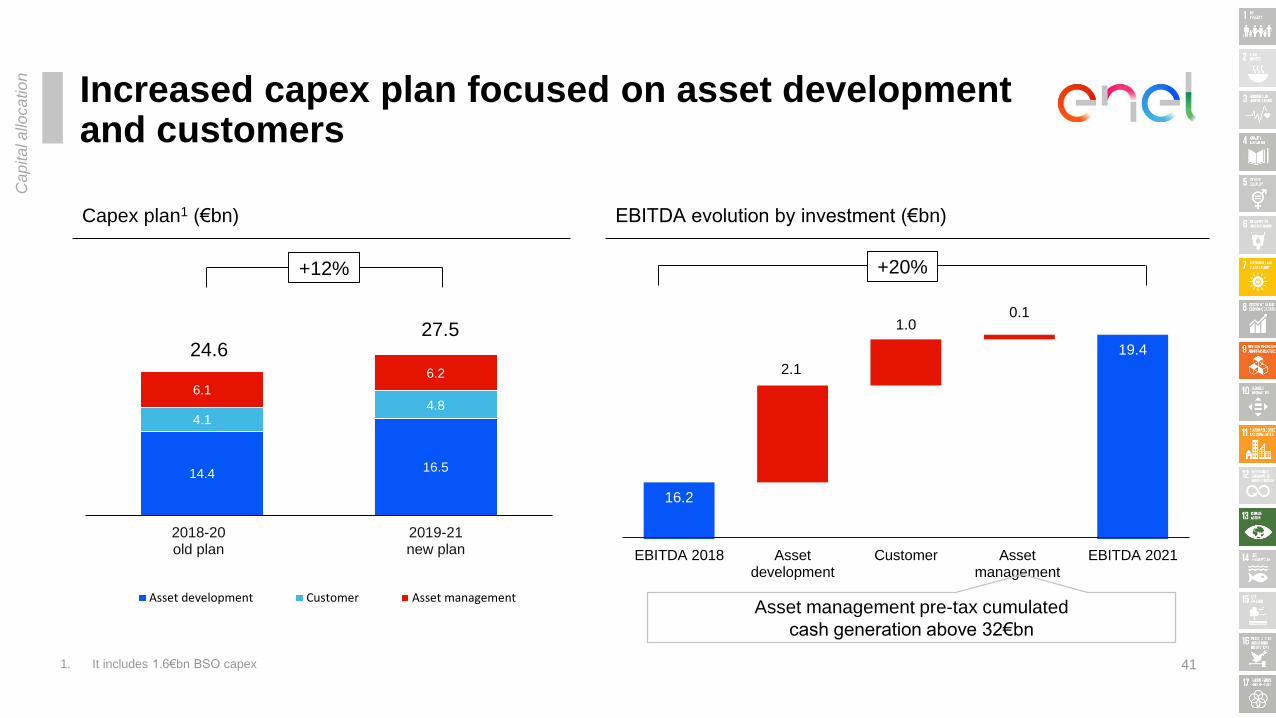
Increased capex plan focused on asset development and customers
Capex plan1 (€bn)
14.416.5
4.14.8
6.1
6.2
0
5
10
15
20
25
30
35
2018-20old plan
2019-21new plan
Asset development Customer Asset management
27.524.6
+12%
Cap
ita
l a
lloca
tio
n
16.2
2.1
1.00.1
19.4
EBITDA 2018 Assetdevelopment
Customer Assetmanagement
EBITDA 2021
EBITDA evolution by investment (€bn)
Asset management pre-tax cumulated
cash generation above 32€bn
+20%
1. It includes 1.6€bn BSO capex 41

28 28
8142
539
48
0.0
10. 0
20. 0
30. 0
40. 0
50. 0
2018 2021
Wind
Renewables: diversifying mix, improved visibility
Installed capacity and Production by technology1
~100
132
0
20
40
60
80
100
120
140
2018 2021
CAPACITY (GW) PRODUCTION (TWh)
1. Consolidated capacity only
2. Volumes to be sold forward in year n-1
Bu
sin
ess lin
e h
igh
lights
2019-21 Sales portfolio composition
2%
52%
17%
29%
Incentivized LT PPA contracted
Forward sales Open position
~357 TWh
> 15 36%
10-15 17%
5-10 16%
PPA duration (yrs)
< 5 31%
+23% +32%
71% of cumulated production sold forward
2
Hydro Solar Other
42

Incremental asset development capex fully allocated to renewables
1. Calculated as asset develpoment Ebitda at regime/Capex (net of BSO)
41%
24%
18%
4%8%
5%
Brazil USA Iberia Italy Chile Other
~5 GW
EBITDA/CAPEX1 IRR spread
over WACC 13% ~200 bps
8.3
10.6
60%
40%
Bu
sin
ess lin
e h
igh
lights
Asset development capex evolution (€bn) Incremental renewable capacity by geography and technology
(~ 2)
~ 4
Old plan2018-20
BSO Organic New plan2019-21
3.4 BSO
1.6 BSO
43

4.4
0.9 0.1
5.4
2018 Assetdevelopment
Assetmanagement
2021
92%
8%
Asset development Asset management
Renewables: accelerating growth
Gross Capex 2019-21
11.6 €bn
Bu
sin
ess lin
e h
igh
lights
2018-21 EBITDA evolution (€bn)
+23%
Asset management pre-tax cumulated cash generation for ~12€bn
4.5
FY2018
44

Networks: 4% total RAB growth
1.32.5
4.6
5.5
1.7
2.02.2
2.70.9
1.310.7
14.0
-
5.00
10.0 0
15.0 0
20.0 0
2018 2021
31 31
-
5.00
10.0 0
15.0 0
20.0 0
25.0 0
30.0 0
35.0 0
40.0 0
45.0 0
2018 2021
+30%-
Bu
sin
ess lin
e h
igh
lights
1. WACC nominal pre-tax
2. Blend of Rio, Cearà, Goias and Eletropaulo
Energy distributed
(TWh) 356 368 117 149
Europe: RAB evolution (€bn) South America: RAB evolution (€bn)
BrazilArgentina Chile Colombia Peru
368 result
target
45

42%
29%
29%
Asset development Customers Asset Management
Networks: profitability supported by asset turnaround and efficiencies
Gross Capex 2019-21
11.1 €bn
Bu
sin
ess lin
e h
igh
lights
2018-21 EBITDA evolution (€bn)
7.6
0.5
0.2
0.5
0.4 (0.3)
8.9
2018 Eletropaulo Connections Tariff& volumes
Efficiency FX 2021
+17%
46

Enel X: capturing new opportunities with customers
1.1 €bn
Bu
sin
ess lin
e h
igh
lights
0.1
0.1
0.1
0.1
0.2
0.5
2018 e-City e-Mobility e-Home e-Industry 2021
2018-21 EBITDA evolution1 (€bn)
Asset Development +0.2 €bn
Customers +0.3 €bn59%
41%
Asset development Customers
1. Rounded figures
Gross Capex 2019-21
47
149198
0
50
100
150
200
250
300
350
400
2018 2021
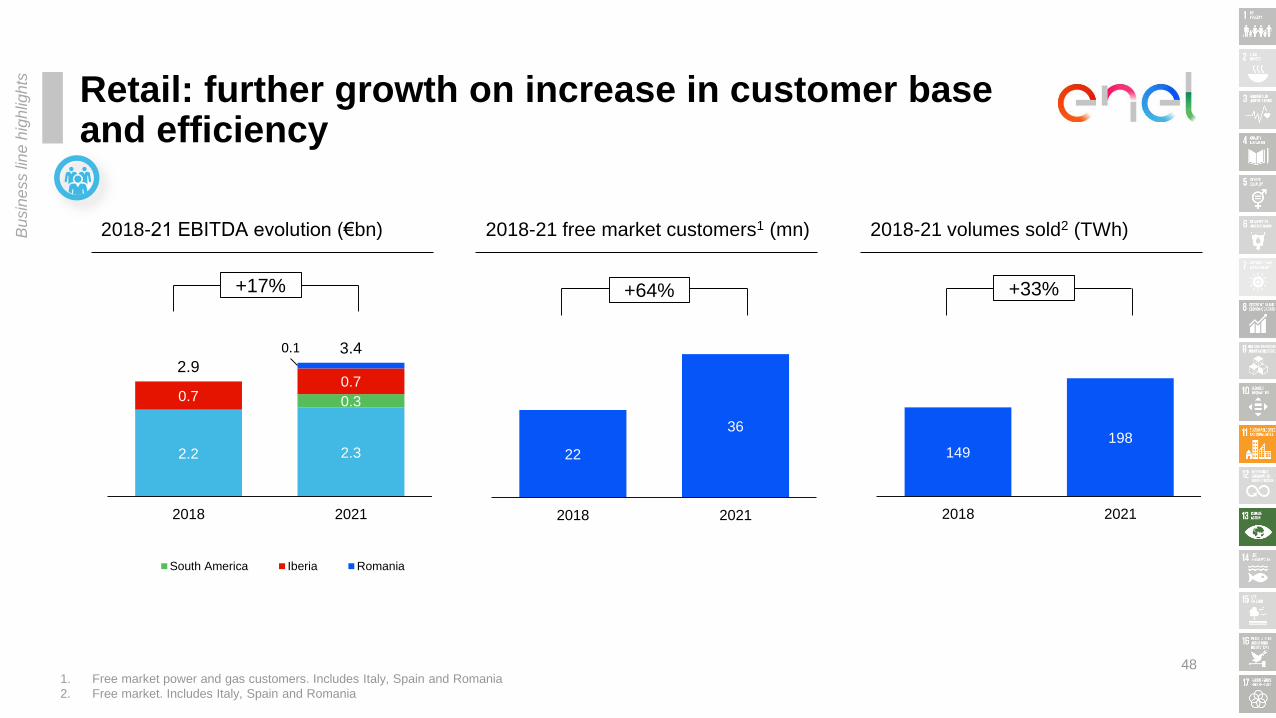
Retail: further growth on increase in customer base and efficiency
2018-21 EBITDA evolution (€bn)
2.2 2.3
0.30.70.7
0.1
2.93.4
0.0
1.0
2.0
3.0
4.0
5.0
6.0
2018 2021
South America Iberia Romania
+17%
22
36
0
10
20
30
40
50
60
2018 2021
+64%
2018-21 volumes sold2 (TWh)
1. Free market power and gas customers. Includes Italy, Spain and Romania
2. Free market. Includes Italy, Spain and Romania
+33%
2018-21 free market customers1 (mn)Bu
sin
ess lin
e h
igh
lights
48
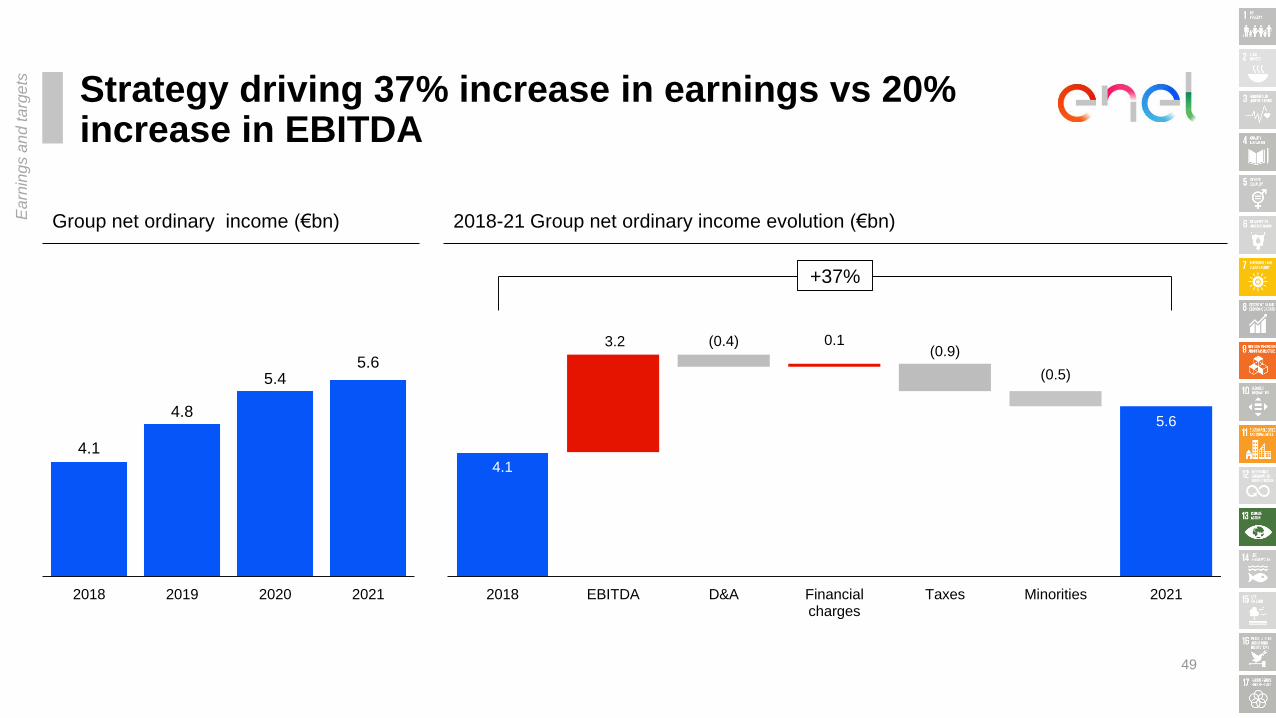
Strategy driving 37% increase in earnings vs 20% increase in EBITDA
5.65.4
4.8
4.1
2.0
2.5
3.0
3.5
4.0
4.5
5.0
5.5
6.0
6.5
7.0
2021202020192018
Group net ordinary income (€bn) 2018-21 Group net ordinary income evolution (€bn)
4.1
3.2 (0.4) 0.1(0.9)
(0.5)
5.6
0.0
1.0
2.0
3.0
4.0
5.0
6.0
7.0
8.0
9.0
2018 EBITDA D&A Financialcharges
Taxes Minorities 2021
+37%
Ea
rnin
gs a
nd
ta
rge
ts
49

Sustainable, profitable, digitalized and customer centric
20212015 2018
Renewables focus Owned RES capacity/Total capacity % 41% 46%
Group simplification Group net income/total net income 64% 70%
Cash flow generation FFO – gross capex €bn 1.8 2.6
End Users mn 61 73
Digital impact Cumulated EBITDA 2019-21 (€bn) n.a.
New businesses Gross margin Enel X €bn n.a. 0.5
Retail customers Mn customers in the free market 17 22
CO2 Footprint Specific Co2 emissions kg/kWh 0.409 0.356
55%
71%
4.4
75
2.5
0.9
36
0.345
~1.7x
Ou
r p
illa
rs
50

Final Consolidated capacity (GW)
Ren
ew
able
s
2018 2021 2018 2021 2018 2021 2018 2021 2018 2021
Italy 12.4 12.4 0.8 1.0 0.8 0.8 0.1 0.1 14.0 14.3
Iberia 4.8 4.8 1.7 2.6 - - 0.0 1.1 6.5 8.4
South America 10.0 10.2 1.6 3.1 0.0 0.1 1.6 2.6 13.3 15.9
Europe and North Africa 0.0 - 0.7 1.1 - - 0.1 0.1 0.9 1.3
North & Central America 0.6 0.6 2.9 5.8 - 0.1 0.3 0.5 3.8 7.0
Africa, Asia & Oceania - - 0.4 0.7 - - 0.3 0.8 0.7 1.4
Total 27.8 28.1 8.2 14.2 0.8 0.9 2.4 5.2 39.2 48.4
TotalHydro Wind Geothermal Solar & Other
51

2019-2021
ESG annexes

Growth across low carbon technologies and services
Plan actions
Development of renewable capacity and
reduction of thermal capacity in 2019-21
Electrification, storage & demand response
Related targets/commitments
1. Includes managed capacity
2. CO2 specific emissions will be <0.345 kg/kWheq in 2021
Implementation of environmental
international best practices to selected coal
plants
340 €mn of investments for environmental
retrofit in 2019-21
Reduction of CO2 specific emissions 0.23 kg/kWheq in 20302
9.9 GW demand response
173 MW/yr storage
ES
G t
arg
ets
Inno
vation
bo
ost
+11.6 GW renewable capacity1
-7GW thermal capacity
New products and services and new power production technologies – Electric mobility; home
and business solutions; marine energy; data valorization; integrated storage solutions
53
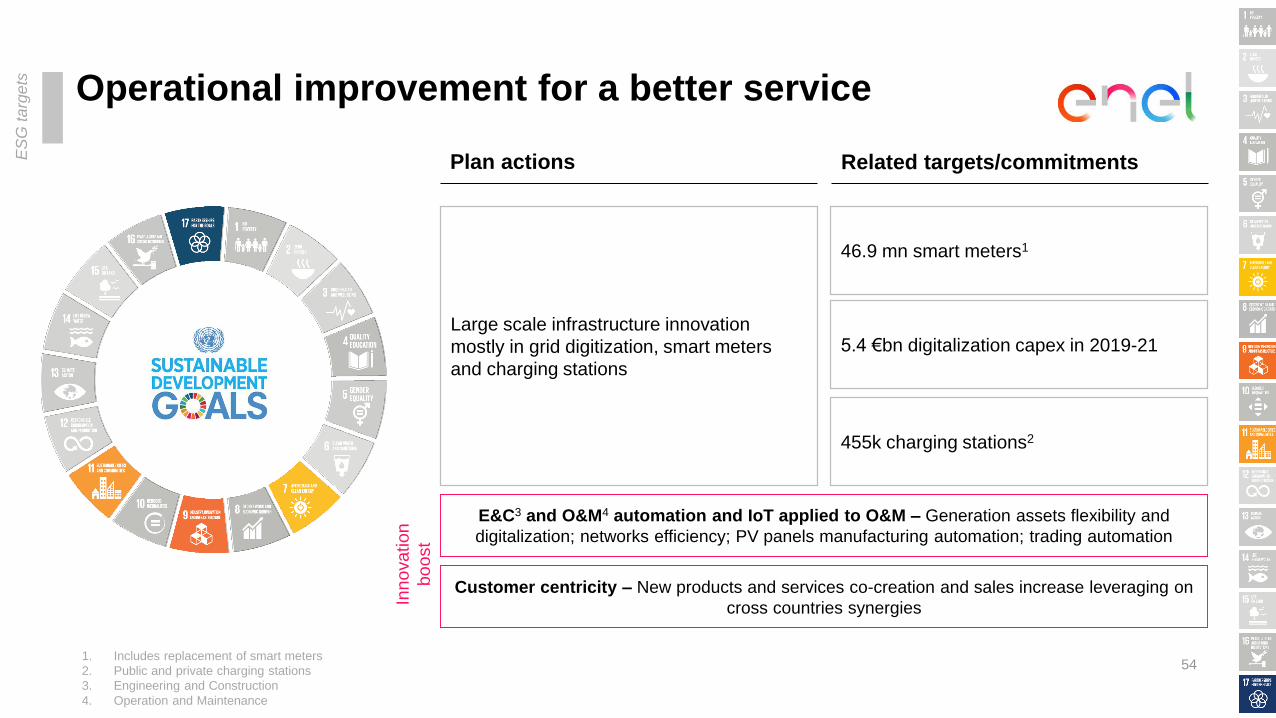
Operational improvement for a better service
Plan actions
Large scale infrastructure innovation
mostly in grid digitization, smart meters
and charging stations
Related targets/commitments
46.9 mn smart meters1
1. Includes replacement of smart meters
2. Public and private charging stations
3. Engineering and Construction
4. Operation and Maintenance
5.4 €bn digitalization capex in 2019-21
455k charging stations2
ES
G t
arg
ets
Inno
vation
bo
ost
E&C3 and O&M4 automation and IoT applied to O&M – Generation assets flexibility and
digitalization; networks efficiency; PV panels manufacturing automation; trading automation
Customer centricity – New products and services co-creation and sales increase leveraging on
cross countries synergies
54

Engaging local communities
Plan actions
Access to affordable and clean energy
High-quality, inclusive and fair education
Related targets/commitments1
2.5 mn beneficiaries in 20301
10.0 mn beneficiaries in 20301
1. Cumulated figures since 2015
Employment and sustainable and
inclusive economic growth8.0 mn beneficiaries in 20301
ES
G t
arg
ets
55

Engaging people we work with
Plan actions
Climate corporate survey1
Appraise performance of people we work
with1
Related targets/commitments
• 100% of people involved
• 99% of people appraised
• 100% of people involved
• 86% of people participating
1. Eligible and reachable people having worked in the Group for at least 3 months
Global implementation of the diversity and
inclusion policyRecruiting should ensure equal gender
splitting of the candidates (c. 50%)
Enable digital skills diffusion among people
we work with100% of people involved in digital skills
training
ES
G t
arg
ets
56
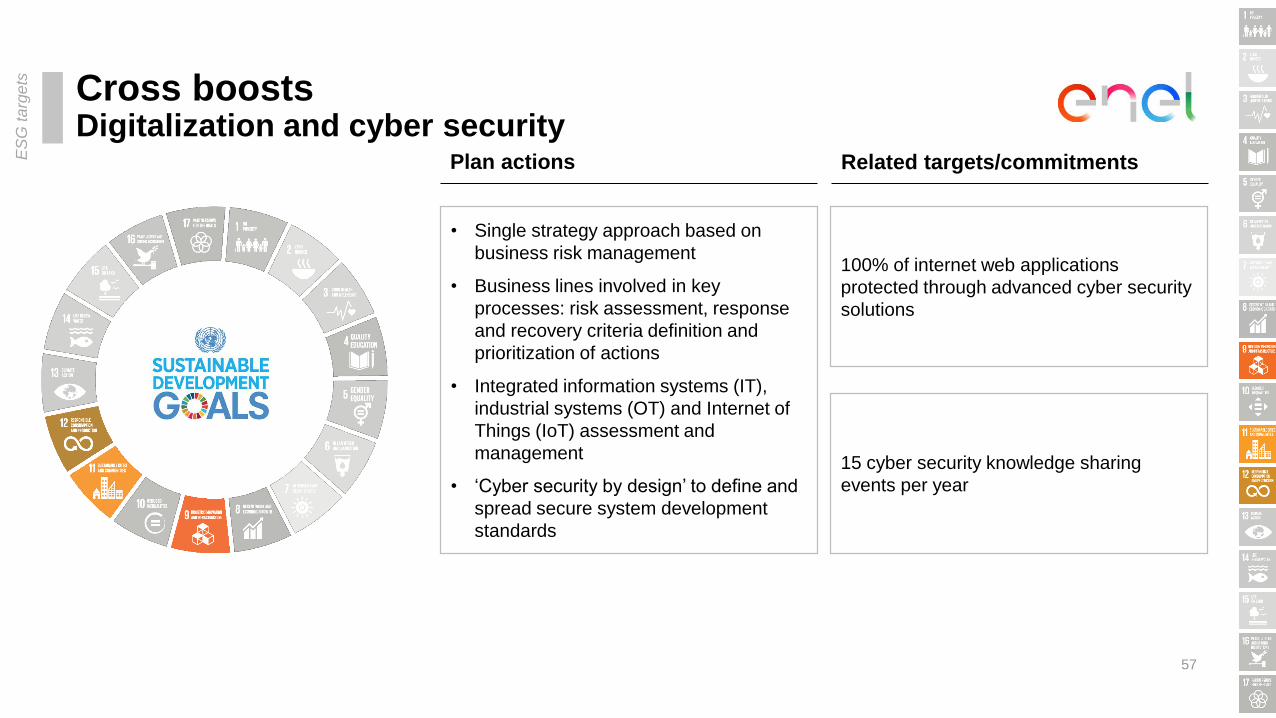
Cross boostsDigitalization and cyber security
Plan actions
• Single strategy approach based on
business risk management
• Business lines involved in key
processes: risk assessment, response
and recovery criteria definition and
prioritization of actions
• Integrated information systems (IT),
industrial systems (OT) and Internet of
Things (IoT) assessment and
management
• ‘Cyber security by design’ to define and
spread secure system development
standards
Related targets/commitments
100% of internet web applications
protected through advanced cyber security
solutions
15 cyber security knowledge sharing
events per year
ES
G t
arg
ets
57

Cross boostsInnovation
Plan actions
Boosting Group’s innovation through a
tools portfolio composed by innovation hub
network, crowdsourcing platforms,
intelligence, internal innovation
communities active on forefront topics,
internal entrepreneurship, innovation with
startups and larger companies, suppliers,
universities and research centers
Related targets/commitments
Implementation in the business of 60
projects with startups in 2019-21
Opening of a new Innovation Hub
in 2019-21
ES
G t
arg
ets
Inno
vation
bo
ost
58

Our Corporate governance

Control and Risks Committee
Corporate governance structure
Corp
ora
te g
ove
rnance
1. Chairperson can be considered independent in accordance with TUF criteria
2. Out of which 3 directors drawn from minority slates
Shareholders’ meeting Audit firm
Board of Directors1
(9 members2)
Board of StatutoryAuditors (3 members)
Nomination and
Compensation Committee
Related Parties Committee Corporate Governance and
Sustainability Committee
11%11%
78%
Executive
Non - executive
Independent
BoD’s
composition
60

3
2
5
5
1
4
Energy
Engineering
Expertise in international environments
Strategy and Finance
Cyber Security
Legal
Board composition
11%
22%67%
46-56 57-66 67-70
Age
diversity
BoD’s members
Non ex (Chairperson)
CGSC
Executive (CEO and
General Manager)
Independent
CGSC RPC
Independent
NCC RPC
Independent
NCC RPC
Independent
CRC NCC
Independent
CRC NCC
Independent
CRC RPC
Independent
CRC CGSC
P. Grieco
F. Starace
A. Antoniozzi
C. Calari
A. Bianchi
P. Girdinio
A. Pera
A. Svelto
A. Taraborrelli
BoD’s Diversity1
Skill
diversity
22%
67%
11%
1-3 years 4-6 years over 6 years
Office
seniority
diversity
67%
33%
Male Female
Gender
diversity
Corp
ora
te g
ove
rnance
61

Short-term variable remuneration1
1. Management by objectives (MBO) 2018
2. (%) Weight in the variable remuneration
3. FI: Work-related accident Frequency Index
4. FA: Number of Fatal Accidents during 2018, except for road events
Type of target
Economic
Financial
Economic
ESG
Macro objective
Profitability
Cash and debt
management
Efficiency
Safety
Objective
3.9 €bn
26%
11.5 €bn
FI3 2018 =1.17
&
FA4 <=9
4.1 €bn
27%
11.4 €bn
FI3 2018=1.15
&
FA4 <=9
4.2 €bn
28%
11.3 €bn
FI3 2018=1.11
&
FA4 <=9
Ordinary
consolidated net
income
FFO/Consolidated
net financial debt
Consolidated cash
cost
Safety in the
workplace
40%2
30%2
20%2
10%2
Entry level (50%) Target (100%) Over (120%)
Corp
ora
te g
ove
rnance
62

Long-term variable remuneration1
Type of target Macro objectiveObjective
Entry (50%) Target (100%) Over I (150%)
1. Long-Term Incentive Plan (LTI) 2018-2020. 30% payment (if any) in the 4th year. 70% payment (if any) in the 5th year (deferred payment)
2. Average TSR Enel compared to average TSR EUROSTOXX Utilities Index-EMU. In case of negative absolute TSR of Enel, the incentive (if any) is reduced – on the basis of
a regressive scale – of the same negative percentage of the absolute TSR of Enel share, multiplied for a constant value equal to 1.53. (%) Weight in the variable remuneration
4. Cumulative for the period 2018-2020
5. For the CEO/General manager. 180% for the other beneficiaries of the LTI Plan 2018-2020
6. In 2020
Over II (280%)5
Market Performance
Enel’s TSR
from 90% to
100% of
TSR Index
Enel’s TSR
from 100%
to 110% of
TSR Index
Enel’s TSR
from 110%
to 115% of
TSR Index
TSR2
50%3
Enel’s TSR
> 115% of
TSR Index
Financial ProfitabilityROACE4
40%3
36.4% 37.5% 38.0% >38.6%
ESG EnvironmentalCO2 emissions
reduction10%3
≤ 380
gCO2/KWheq6
≤ 350
gCO2/KWheq6
≤ 340
gCO2/KWheq6
≤ 330
gCO2/KWheq6
Corp
ora
te g
ove
rnance
63

H1 2019 consolidated results
Financial results

Key highlights of the period
65
Efficiencies accelerated reaching c.200 €mn in the semester
Exit from coal in Russia signed and approved by EGM Second swap on Enel Americas shares announced, AUCAP in progress
Ordinary Group net income +20% yoy
Ordinary EBITDA reached 8.8 €bn (+13% yoy)Development capex increased by more than 30% yoy
SDGSustainable Dev.
GoalsSDGs targets on track

Industrial growth: capexDevelopment capex increasing by more than 30% yoy
66
H1 2019 Capex by business and by nature
41%
44%
7%
3%5%
4.2 €bn
(+23% yoy)
H1 2019 Asset Development capex by business
2019E ~100%
2020E ~100%
2021E ~ 50%
Capex addressed
by year
29%
68%
1%2%
2.5 €bn
(+33% yoy)60%
18%
22%
Asset development Customers Asset management
4.2 €bn
(+23% yoy)
Retail
Conventional generation
Networks
Enel X
EGP

39.2 39.442.3
4.2 3.7
0.72.2
3.7
FY 2018 H1 2019 COD3Q 19
COD4Q 19
FY 2019E
Steady increase in EGP growth
671. Rounded figures,
2. Potential disposals not included
Renewable capacity evolution in 20191 (GW)
Consolidated capacity
Managed capacity
46.0Total
capacity43.4 43.1
48%48%
-% Managed & consolidated Renewable capacity on total
50%
2.9 GW
2,900 MW COD in H2, of which
700 MW already built
7,300 MW capacity
in execution
c. 85% of 2019-20 additional capacity
target in execution
2
2

Group’s infrastructure and services
230.7246.7
150 .00
170 .00
190 .00
210 .00
230 .00
250 .00
H1 2018 H1 2019
Electricity distributed (TWh)
+7%
13.8
14.7
10.0 0
10.5 0
11.0 0
11.5 0
12.0 0
12.5 0
13.0 0
13.5 0
14.0 0
14.5 0
15.0 0
H1 2018 H1 2019
Free market power customers3 (mn)
+0.9
1. Public & private charging points installed (public 2.1 k in H1 2018 and 8.5 k in H1 2019); 2. Including Italy for clusters A&B and C&D; 3. Including only Italy and Iberia figures; 4. Including BESS
(Renewables and Conventional) and customer storage
72.773.0
70.0 0
70.5 0
71.0 0
71.5 0
72.0 0
72.5 0
73.0 0
73.5 0
H1 2018 H1 2019
End users (mn)
3.8
10.1
-
2.00
4.00
6.00
8.00
10.0 0
H1 2018 H1 2019
Smart meters 2.0 (mn)
>2.5x +0.3
Infrastructure Customer services
H1 2018 H1 2019
2.5 2.4 Public lighting
(mn points)
37 63Charging points1 (k) +70%
3.1 6.0Fiber deployment
(Households passed mn)2 c. 2x
68
43.8 43.9 Total smart
meters (mn)
5.7 6.0Demand response (GW)
28.4 80.6 Storage (MW)4
H1 2018 H1 2019
+5%
c. 3x

4,216
206
(106) 4,316
(192)
36 84
4,244
H1 2018 Perimeter & Other IFRS 16 H1 2018pro forma
Efficiency CPI & FX Develop. &Customers
H1 2019
691. Rounded figures
+1%
Opex evolution1 (€mn)
Operational efficiencyEfficiencies accelerated reaching c.200 €mn in the semester
-2%

70
1. Net capacity
2. Approved by Enel Russia EGM on July 22, 2019
Portfolio management and simplificationAcceleration of decarbonisation strategy and minorities buyout
c. 300 €mn sale price
c. (75) €mn Recurring EBITDA
Exit from Coal in Russia2
3.6 GW1 coal capacity reduction
5% increase in ENIA shares
via first share swap
Second share swap
transaction announced
Expected increase in Enel’sstake up to c.62%
Enel Russia Reftinskaya sale process Enel Americas simplification process
AUCAP in progress

Progress on SDGs
711. Cumulated data and targets from 2015 (mn beneficiaries)
2. Including generation from nuclear and renewable managed capacity
Access to affordable and clean energy 7.1 10.0
Employment and sustainable and inclusive economic growth
2.0 8.0
High-quality, inclusive and fair education 1.1 2.5
Emission free production2 56% 62%
Engaging local communities (mn beneficiaries)1 H1 2019 2030
Climate change H1 2019 2021
SDGSustainable Dev.
Goals

H1 2019 consolidated results
Financial results

Financial highlights (€mn)
Reported EBITDA 7,8578,907 +13%
Net debt 41,089345,391 + 10%
FFO 4,3614,922 + 13%
H1 2018H1 2019 ∆ YoY
Ordinary Group net income2 1,892 2,277 + 20%
Ordinary EBITDA1 7,729 8,763 + 13%
Reported Group net income 2,0202,215 + 10%
1. Excludes extraordinary items in H1 2018 ( +128 €mn Rete Gas Earn Out) and H1 2019 ( +94 €mn Disposals of Mercure plant, +50 €mn second tranche Rete Gas Earn Out)
2. Excludes extraordinary items in H1 2018 ( +128 €mn Rete Gas Earn-Out) and H1 2019 ( +97 €mn Disposals Mercure plant, +49 €mn Rete Gas Earn-Out; -154 €mn Impairments
coal plants Bocamina 1 and Tarapaca; -54 €mn Impairment RGRES)
3. As of December 31st 2018. IFRS 16 impact from January 1, 2019
73

Ordinary EBITDA evolution1 (€bn)+13% increase in EBITDA in line with FY targets
741. Rounded figures
Asset development driven by EGP and I&N
Increased customers number and improving margins
Efficiencies driven by conventional generation and I&N
Positive regulatory changes in South America
Price recovery more than compensating lower volumes
Positive perimeter from consolidation of Enel Dx Sao Paulo
Fx devaluation mainly in Argentina
+13%
5.86.5
1.9
0.2 0.10.7
2.0
0.2
H1 2018 Assetdevelopment
Customers Assetmanagement
H1 2019
7.7
8.8

Ordinary EBITDA by business linePerformance supported by our integrated business model
751. Rounded figures. Including c.230 €mn regulatory adjustments in Argentina, c.160 €mn from PPA contract early termination, c.60 €mn earn out settlement Enel X
3.9
2.3
0.8
1.6
0.1
Networks EGP ConventionalGeneration
Retail Enel X
8.81 €bn
(+13% yoy)
Higher prices and asset rotation +6%
Efficiencies,
Constructive regulatory changes & perimeter +11%
Higher efficiencies and improving margins
on conventional Generation+78%
Better free market margins and efficiencies +4%
∆ YoY
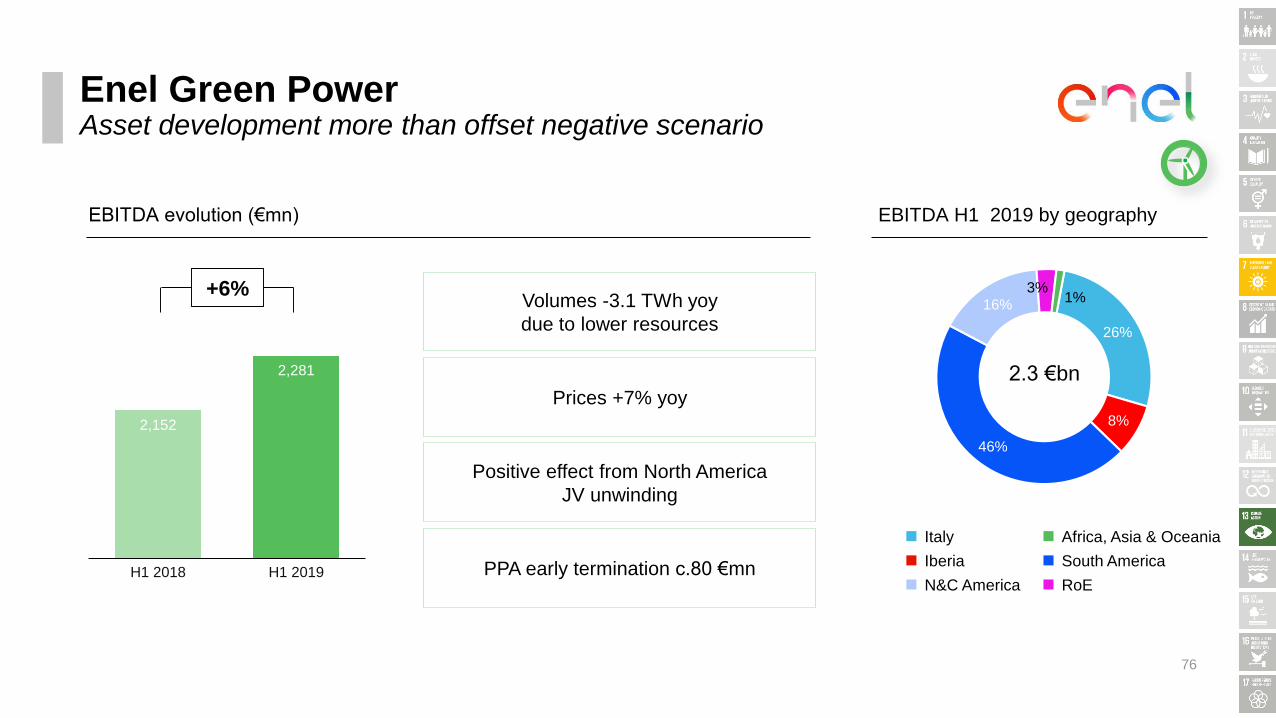
Enel Green PowerAsset development more than offset negative scenario
76
2,152
2,281
1,80 0.00
1,90 0.00
2,00 0.00
2,10 0.00
2,20 0.00
2,30 0.00
2,40 0.00
H1 2018 H1 2019
+6%
EBITDA evolution (€mn) EBITDA H1 2019 by geography
2.3 €bn
Italy
Iberia
N&C America
South America
RoE
Africa, Asia & Oceania
Volumes -3.1 TWh yoy
due to lower resources
Prices +7% yoy
PPA early termination c.80 €mn
Positive effect from North America
JV unwinding
26%
8%
46%
16%3%
1%

3,523
3,921
2,50 0.00
2,70 0.00
2,90 0.00
3,10 0.00
3,30 0.00
3,50 0.00
3,70 0.00
3,90 0.00
4,10 0.00
4,30 0.00
4,50 0.00
H1 2018 H1 2019
Infrastructure and NetworksEfficiencies, regulatory items and perimeter drive solid EBITDA growth
77
+11%
EBITDA evolution (€mn) EBITDA H1 2019 by geography
45%
25%
29%
1%
3.9 €bn
Italy
Iberia
South America
RoE
Efficiencies for c.80 €mn
Constructive regulatory changes
in Argentina and Brazil
More than 60% of
end users fully digitalised
Consolidation and outstanding
performance of Enel DX Sao Paulo

Free market: Higher margins and + 900k
new customers (Italy and Spain)
Regulated market: weak performance due
to a combination of lower prices and
declining volumes
Efficiencies for c.30 €mn
1,136 1,167
351 324
149
H1 2018 H1 2019
RetailImproving customers portfolio mix supports power margins
78
+4%
EBITDA evolution (€mn) Free market
1,5721,634
31.6 30.1
38.1 37.5
H1 2018 H1 2019
-3.1%
69.7 67.6
Energy
sold (TWh)
8.2 8.9
5.6 5.8
H1 2018 H1 2019
+0.9
13.8 14.7
Power
customers (mn)
IberiaItaly South America

468
831
100 .00
200 .00
300 .00
400 .00
500 .00
600 .00
700 .00
800 .00
900 .00
1,00 0.00
H1 2018 H1 2019
Conventional generation and Global tradingPerformance supported by efficiencies, higher output and prices
79
+78%
EBITDA evolution (€mn) EBITDA H1 2019 by geography
10%
37%40%
13%
0.8 €bn
Italy
Iberia
South America
RoE
c.90mn of efficiencies primarly
in Italy and Spain
Improved results on nuclear generation
(+1.4 TWh yoy; EBITDA +190 €mn yoy)
PPA early termination c.80 €mn

Profit & loss (€mn)
80
D&A
EBIT
Ordinary EBITDA
Financial expenses1
Income taxes
Minorities
EBT
Group net ordinary income
∆ yoy
+13%
+8%
+17%
+3%
+13%
+18%
+18%
+20%
(3,210)
5,553
8,763
H1 2019
(1,241)
(1,118)
(832)
4,227
2,277
(2,982)
4,747
7,729
H1 2018
(1,207)
(991)
(703)
3,586
1,892
1. Includes other financial expenses (-34 € mn for H1 2018, -77 € mn for H1 2019)
Results from equity investments n.m.(85) 46
Higher D&A mainly due to IFRS16 and
consolidation of Enel DX Sao Paulo
Cost of debt declining by 30 bps
Higher Financial expenses due to delta perimeter
Higher taxes, despite a lower tax rate, driven by higher
EBT
Equity investments negatively impacted
by North America JV unwinding
Higher minorities due to increasing
contribution of South America activities

8.8 ( 0.6 )
( 1.6 )( 0.6 )
( 1.1 )
4.9 ( 4.2 )
0.8 -
1.0
2.0
3.0
4.0
5.0
6.0
7.0
8.0
9.0
10.0
Ordinary EBITDA ∆ Provisions ∆Workingcapital& other
Incometaxes
Financialexpenses
FFO Capex FCF
Cash flow (€bn)23% increase in capex covered by FFO generation1
81
1. Rounded figures
2. Accruals, releases, utilizations of provisions in EBITDA (i.e. personnel related and risks and charges), accruals of bad debt
3. Includes dividends received from equity investments
4. Funds from operations
5. Gross of BSO capex HFS
1.0(3.4)54.4(1.4)(0.5)7.7 (0.9)(0.7)
( )
PY
2
3
4
-22%+23%+13%-21%+28%+13% +83%-13%Delta YoY
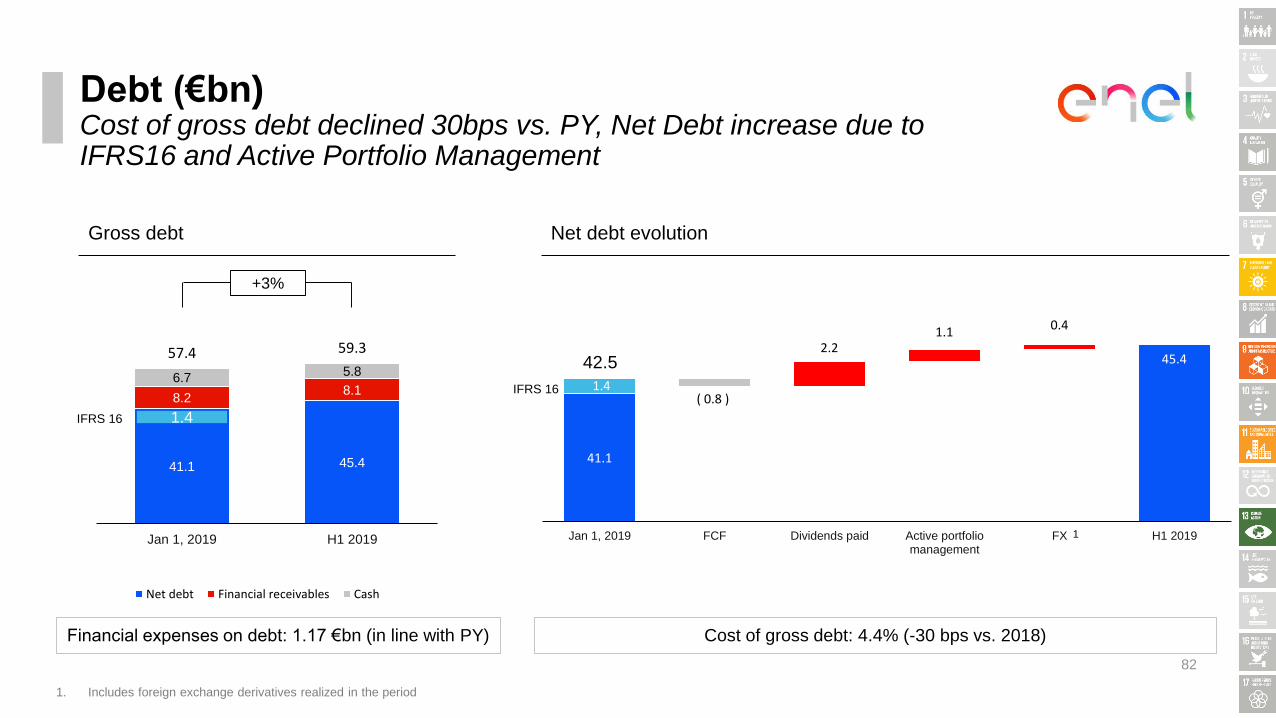
Debt (€bn)Cost of gross debt declined 30bps vs. PY, Net Debt increase due to IFRS16 and Active Portfolio Management
82
+3%
Gross debt Net debt evolution
Financial expenses on debt: 1.17 €bn (in line with PY) Cost of gross debt: 4.4% (-30 bps vs. 2018)
37,410 43,12237,302 43,122
41.1
1.4( 0.8 )
2.2 1.1 0.4
45.4
30
32
34
36
38
40
42
44
46
48
50
Jan 1, 2019 FCF Dividends paid Active portfoliomanagement
FX H1 2019
IFRS 16
42.5
41.1 45.4
8.28.1
6.75.8
57.4 59.3
-
10
20
30
40
50
60
Jan 1, 2019 H1 2019
Net debt Financial receivables Cash
1. Includes foreign exchange derivatives realized in the period
1
1.4IFRS 16
SDGSustainable Dev.
Goals
Closing remarks
83
Performance supported by operating growth and efficiencies
Acceleration in development capex sustained by growing cash flow generation
High visibility on medium term results thanks todelivery, efficiencies, regulation and assets under construction
FY targets confirmed

Contact us
Contacts
Email [email protected]
Phone +39 06 8305 7975
Monica GirardiHead of Group Investor Relations
Investor Relations teamFederico Baroncelli
Francisco Basauri
Serena Carioti
Alessia Di Ninno
Federica Dori
Fabrizio Ragnacci
Federica Todaro
Noemi Tomassi
Emanuele Toppi
Follow us
Website
Enel.com
Mobile App
Enel Investors
Channels
84