Investor presentation - Scatec
43
May 2021 Investor presentation
Transcript of Investor presentation - Scatec

May 2021
Investor presentation

The following presentation is being made only to, and is only directed at, persons to whom such presentation may lawfully be communicated (’relevant persons’). Any person who is not a relevant person should not rely, act or make assessment on the basis of this presentation or anything included therein.
The following presentation may include information related to investments made and key commercial terms thereof, including future returns. Such information cannot be relied upon as a guide to the future performance of such investments. The release, publication or distribution of this presentation in certain jurisdictions may be restricted by law, and therefore persons in such jurisdictions into which this presentation is released, published or distributed should inform themselves about, and observe, such restrictions. This presentation does not constitute an offering of securities or otherwise constitute an invitation or inducement to any person to underwrite, subscribe for or otherwise acquire securities in Scatec ASA or any company within the Scatec Group. This presentation contains statements regarding the future in connection with the Scatec Group’s growth initiatives, profit figures, outlook, strategies and objectives as well as forward looking statements and any such information or forward-looking statements regarding the future and/or the Scatec Group’s expectations are subject to inherent risks and uncertainties, and many factors can lead to actual profits and developments deviating substantially from what has been expressed or implied in such statements.
The following presentation contains unaudited pro forma financial information which has been prepared solely for illustrative purposes to show how the acquisition of SN Power might have affected the financials of the group if the acquisition had occurred at an earlier date. All pro forma financials in this presentation are unaudited.
Alternative performance measures (APM) used in this presentation are described and presented in the fourth quarter report of the group for 2020.
Disclaimer
2

Contents1. Introduction
2. The market and our pipeline
3. Our business model
4. Financials
5. Outlook and guidance

• Acquisition of SN Power completed – hydro assets contributing with strong growth
• Power production of 854 (349) GWh and Group EBITDA¹ of NOK 636 (346) million
• Power Production cash flow to equity of NOK 681² (105) million
• Started construction of 150 MW in Pakistan
• 2025 growth target: 15 GW installed - capex of NOK 100 billion
Q1’21 Strong growth and solid cash flow
4
1) EBITDA and other alternative performance measures (APMs) are defined and reconciled as a part of the APM section of the first quarter report on pages 37-40.
2) including refinancing proceeds of NOK 397 million
Power production (GWh)
349
854
Q1 2020 Q1 2021
2.4x

A broad and growing asset portfolio
Latin America
Africa & Middle East
Rest of Asia
1,450 MW
1,175 MW
506 MW
383 MW
Scatec in brief
Develop, build, own and operate renewable energy
3.5 GW in operation and under construction
More than 500 employees in 23 countries
Europe & Central Asia
2,053 MW
1,422 MW
39 MW
5

We continue to lead and are broadening our growth strategy
Build a global leader across solar, hydro, wind and storage
Focus on new and existing high growth markets
and a broader offering
Continue to adapt our business model to a
changing market

02
The market and our project pipeline
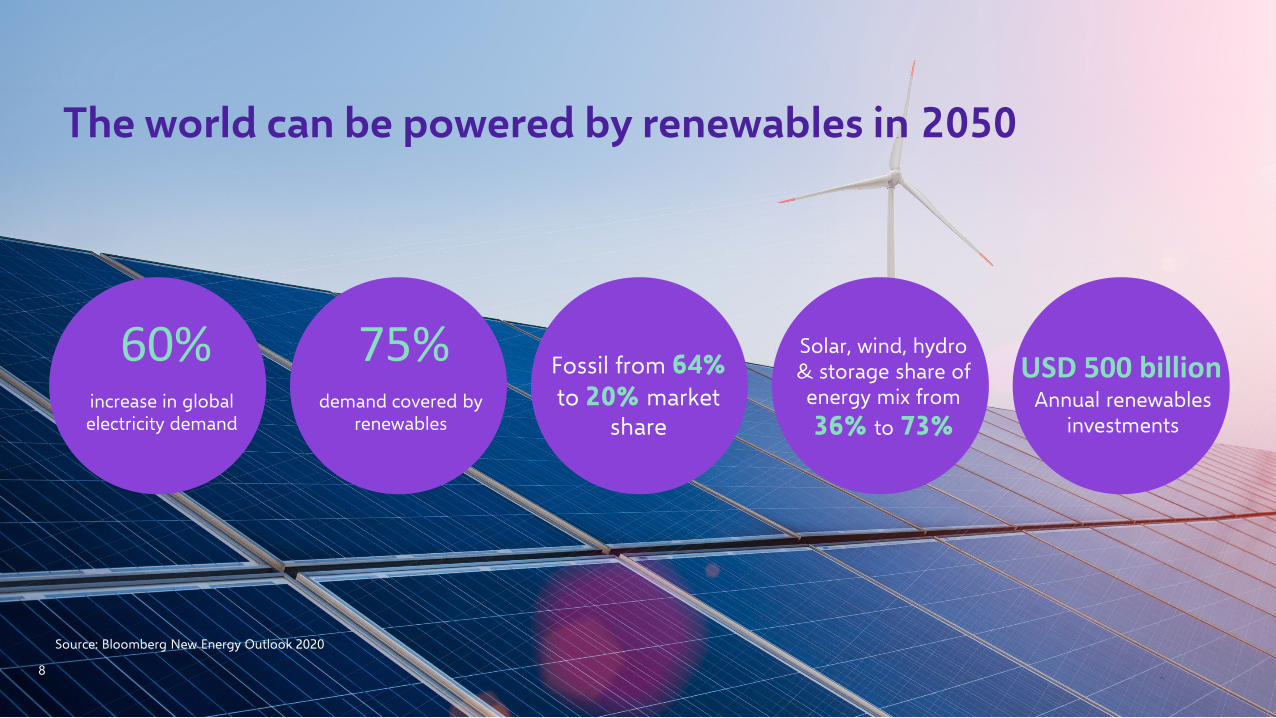
The world can be powered by renewables in 2050
60%increase in global electricity demand
75%demand covered by
renewables
Fossil from 64%to 20% market
share
Solar, wind, hydro& storage share ofenergy mix from 36% to 73%
USD 500 billionAnnual renewables
investments
Source: Bloomberg New Energy Outlook 2020
8

7%
15%
1%2%
7%
20%
38%
8%2%
20,391 GW2050
9
2019
14,885 GW
2050
2,723 GW
+447%Storage
Solar
WindHydro
Global installed capacity mix, 2019 and 2050
Solar, hydro, wind & storage covering 73% of installed capacity in 2050
28 %
23 %
4 %5 %
15 %
8 %
11 %
2 % 4 %
7,566 GW2019
Coal Gas Oil Nuclear Hydro Wind Solar Storage Other
Source: Bloomberg NEF

4.5 GW by end 2021 and 15 GW by end 2025
10
GW – In operation and under construction – 100% basis
Growth
1.4
Current
4.5
1.4
End 2021
9.1
Growth End 2025
3.5
5.9
15
2.4
2.1
2021Delivery of large solar projects in India, Brazil, Tunisia, South Africa & Pakistan
2025Continued growth in pipeline and conversion of projects across key regions and technologies
SN Power

Mature projects expected to start construction in 2021
Pakistan, 150 MW• Financial Close in Q1• 75% leverage• 75% equity stake• Construction started
in April
Tunisia*, 360 MW• Backlog• Tariff awarded• 75% leverage• 50-60% target equity
stake
* Tozeur and Sidi Bouzid, 60 MWp each and Tataouine, 240 MWp** RMIPP: Risk Mitigation IPP Procurement Program. REIPPP: Renewables IPP Procurement Program11
South Africa, 600 MW• Pipeline• Bid into RMIPP**• 80% leverage• 51% equity stake
India, 900 MW• Pipeline• Tariff awarded• 75% leverage• 50% equity stake• No EPC
Brazil, 530 MW• Pipeline• Equinor and Hydro
partners• Negotiating off-take• 70% leverage• 33% equity stake
Brazil, 101 MW• Backlog• Blended off-take• Kroma and Equinor
partners• 60% leverage• 40% equity stake

• Lease agreement with Torex Gold for a 8.5 MW solar plant for two projects in Mexico
• Initial contract of 10 years
• The plant can be expanded at any time, including adding battery storage
• Estimated completion in fourth quarter 2021
Milestone for Release8.5 MW flexible lease agreement
12
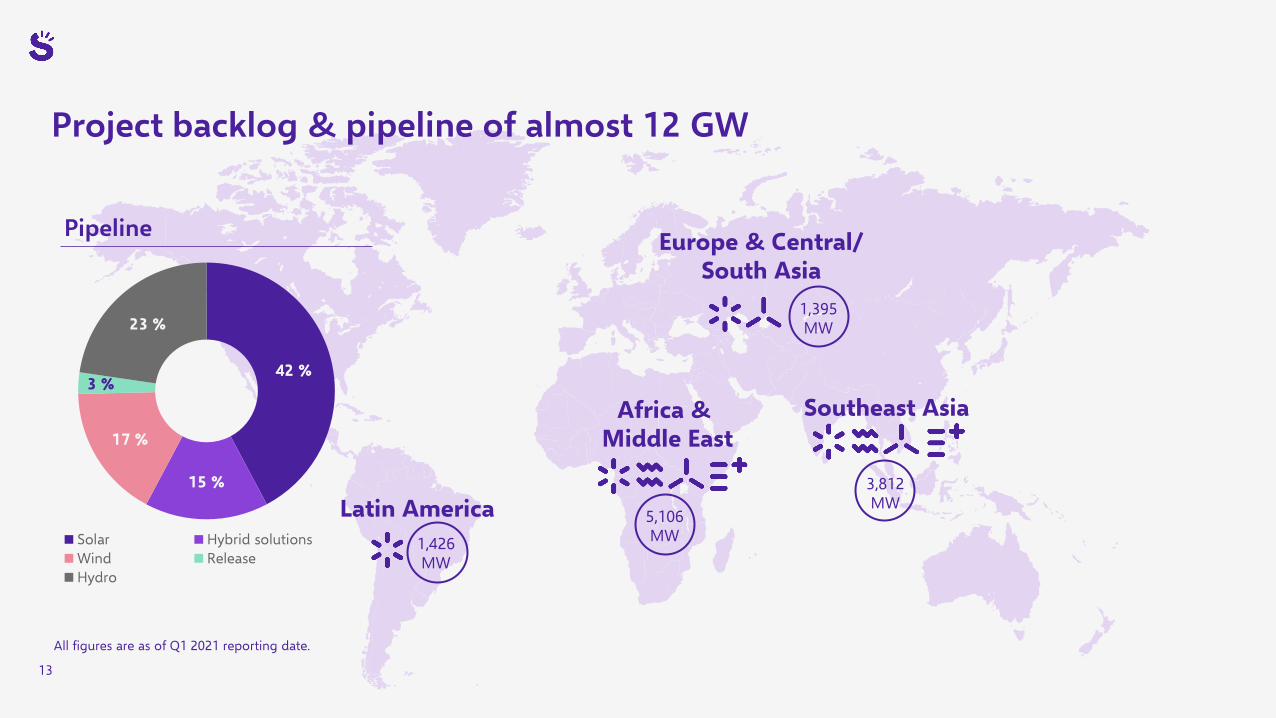
42 %
15 %
17 %
3 %
23 %
Solar Hybrid solutionsWind ReleaseHydro
Latin America
Africa &Middle East
Southeast Asia
Europe & Central/South Asia
Project backlog & pipeline of almost 12 GW
All figures are as of Q1 2021 reporting date.
1,426MW
5,106MW
3,812MW
1,395MW
13
Pipeline

Hydro project development focus:• Brownfield projects with upgrade potential• Greenfield with regulation capability• Hybridisation
Building on key strengths:• Hydropower competence
• Project development• Hydropower engineering and construction• Structuring and financing• Market operations
• Strong ESG focus and high HSSE standards• Applying Scatec’s integrated business model
Hydropower development– Building on key strengths from SN Power and Scatec
14
Project opportunity in Africa:Existing hydro portfolio of 260 MW
Opportunity to add 220 MW:Upgrade plant, add hydro capacity, and
add floating solar on reservoir

03
Our business model

Our value chain
Site development & permitting
System design
Business case development
PPA negotiation
Project development Financing OperationsConstruction
Debt/Equity structuring
Due diligence
Engineering and procurement
Construction management
Maximise performance and availability
Maintenance and repair
Asset management
Financial optimisation
Ownership (IPP)

Our success is based on our business model & strong entrepreneurial culture
PredictableWorking together
Driving resultsChangemakers
Business model People
Integrated – capturing full project value
Structuring & financingFinancial discipline
Partnerships
Agile & leanEntrepreneurial culture
Passionate & empowered peopleStrong and diversified talent pool
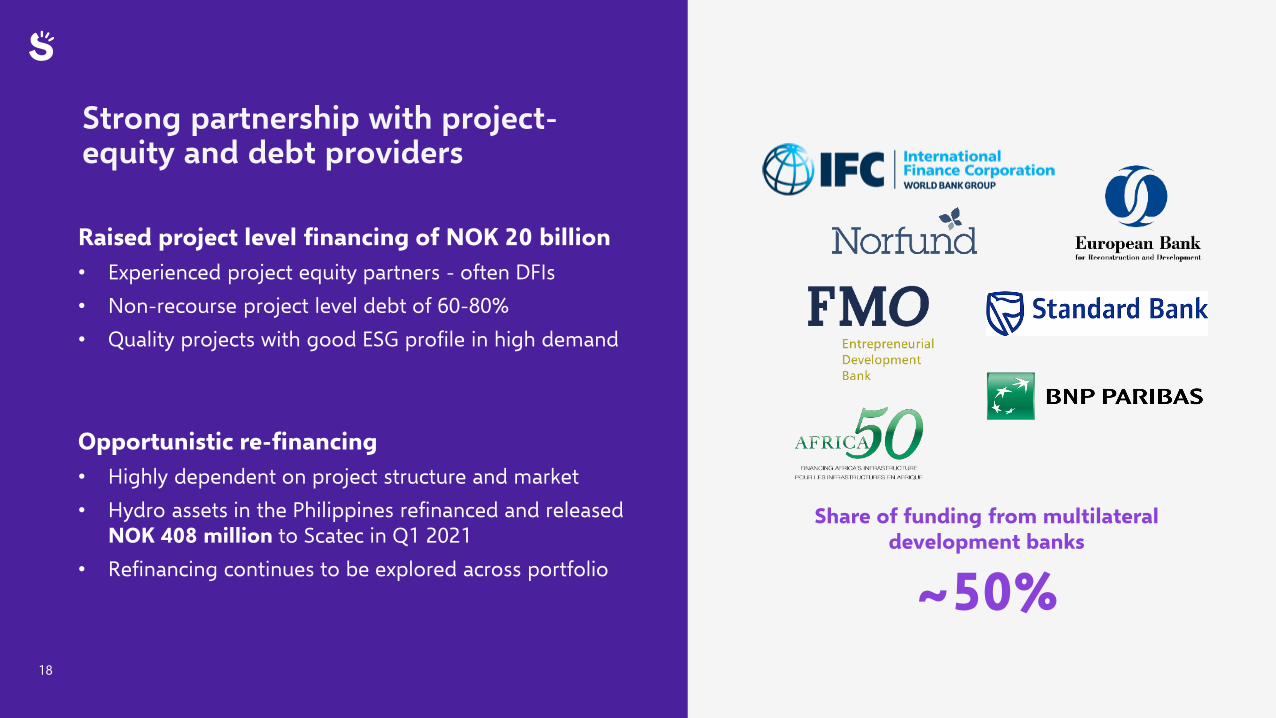
Strong partnership with project-equity and debt providers
18
Share of funding from multilateral development banks
~50%
Raised project level financing of NOK 20 billion• Experienced project equity partners - often DFIs• Non-recourse project level debt of 60-80%• Quality projects with good ESG profile in high demand
Opportunistic re-financing • Highly dependent on project structure and market • Hydro assets in the Philippines refinanced and released
NOK 408 million to Scatec in Q1 2021• Refinancing continues to be explored across portfolio
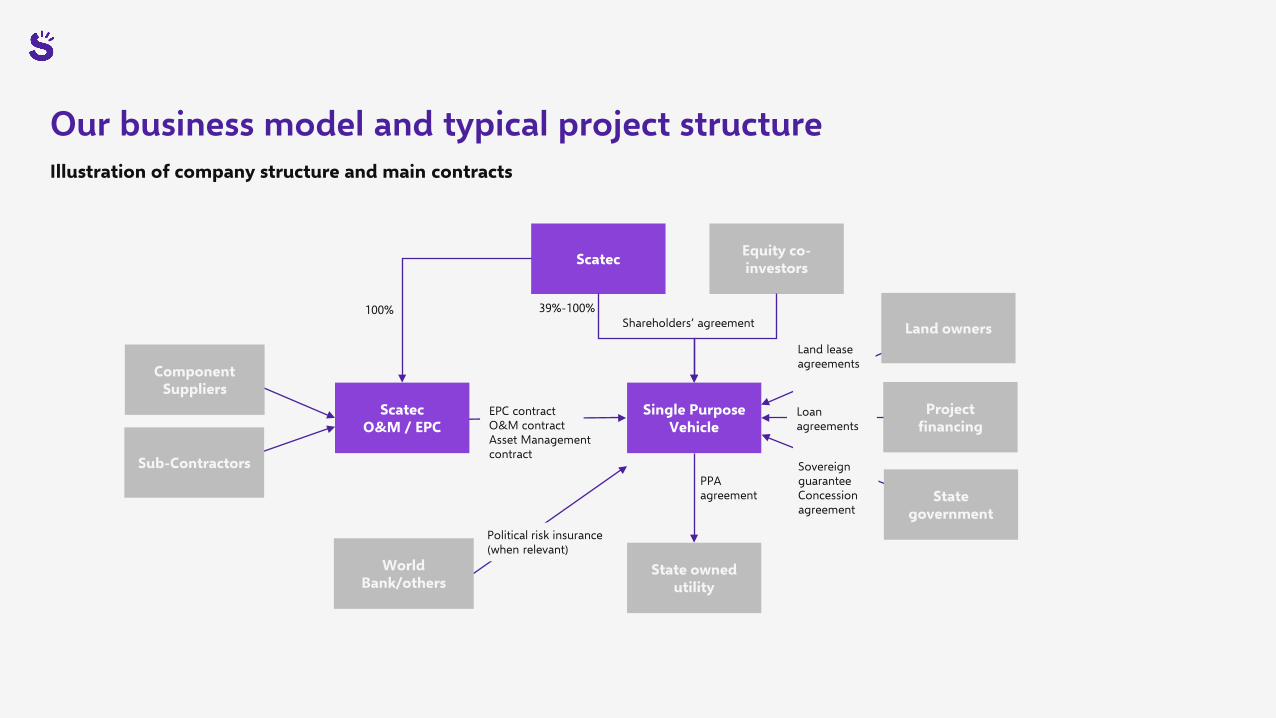
Our business model and typical project structureIllustration of company structure and main contracts
ScatecO&M / EPC
Single Purpose Vehicle
State owned utility
Project financing
Scatec Equity co-investors
State government
PPA agreement
Land ownersShareholders’ agreement
World Bank/others
100% 39%-100%
Component Suppliers
Sub-Contractors
EPC contract O&M contractAsset Management contract
Loan agreements
Sovereign guaranteeConcession agreement
Land lease agreements
Political risk insurance (when relevant)

A leading position in ESG
20
• Experience from navigating complex markets
• Identifies ESG project risks early with dedicated teams on the ground
• A net positive carbon footprint – and set targets for reductions in direct emissions
• Comprehensive ESG reporting and close monitoring of regulations (e.g. EU Taxonomy)
Rating summary: Low risk#1 of 450 – Utilities#1 of 48 – Renewable powerproducers
Rating: A- (excellent)Status: PrimePrime threshold: C+
Rating: AAA (top rating)Highest scoring range relative to global peers
Rating: A Carbon Disclosure ProjectTop score
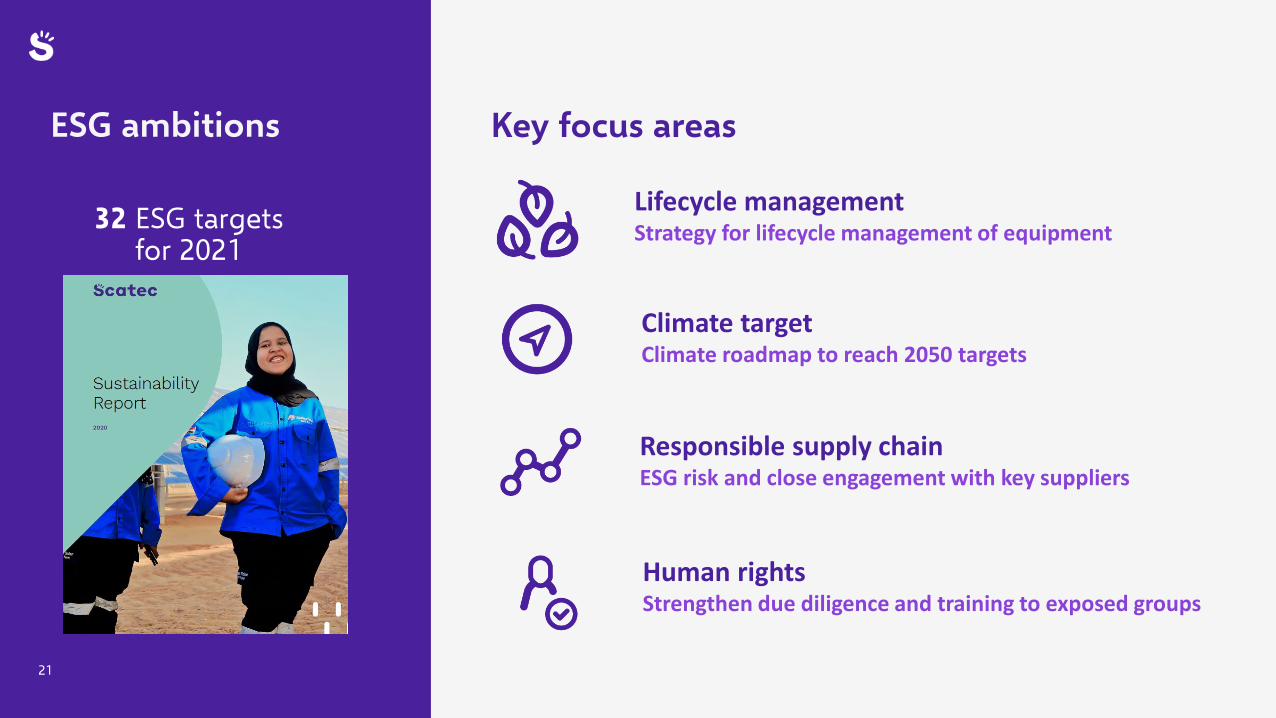
32 ESG targets for 2021
ESG ambitions
21
Key focus areas
Human rightsStrengthen due diligence and training to exposed groups
Responsible supply chainESG risk and close engagement with key suppliers
Lifecycle management Strategy for lifecycle management of equipment
Climate target Climate roadmap to reach 2050 targets
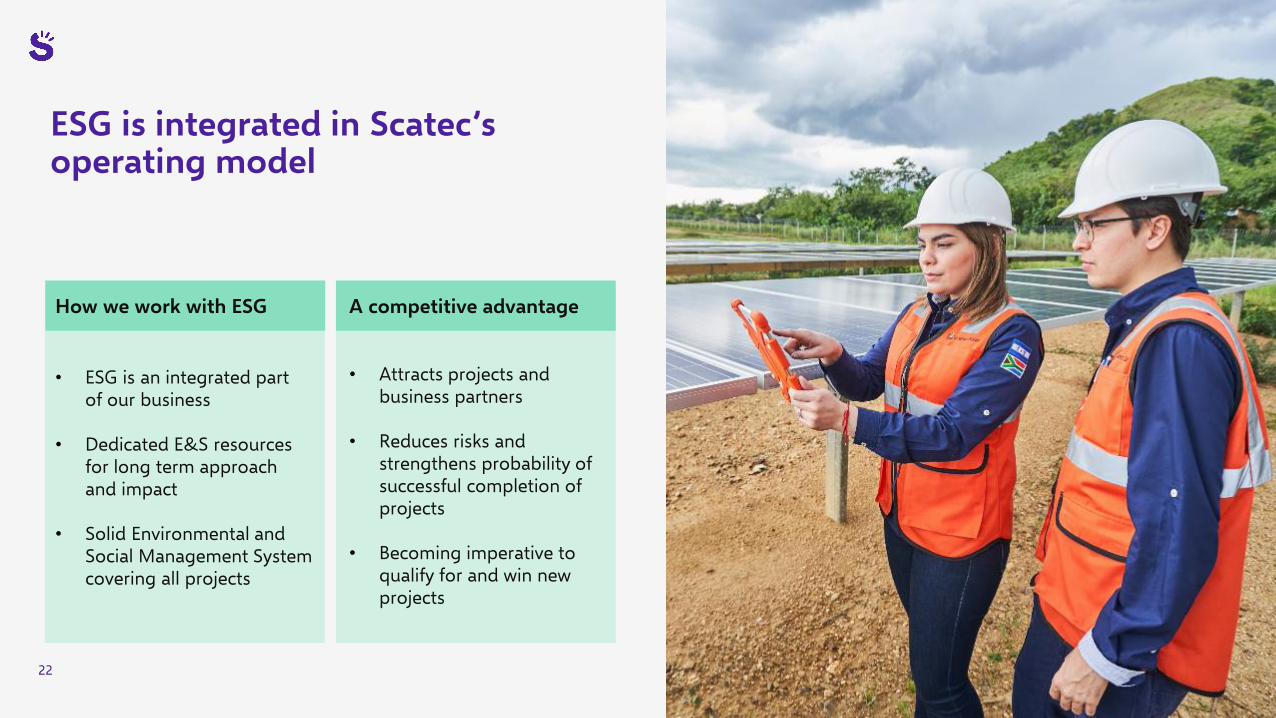
ESG is integrated in Scatec’s operating model
A competitive advantage
• Attracts projects and business partners
• Reduces risks and strengthens probability of successful completion of projects
• Becoming imperative to qualify for and win new projects
How we work with ESG
• ESG is an integrated part of our business
• Dedicated E&S resources for long term approach and impact
• Solid Environmental and Social Management System covering all projects
22

Stakeholder engagement, grievance mechanism & local developmentHealth & Safety
Opportunity Project Development Financing Delivery Power
Production
Environmental, Social & Governance aspects are integrated in our operating model
Investmentdecision
Responsible procurement
Calculate emissions
End of lifemanagement
Risk assessment & monitoringEnvironmental & social impacts

All Scatec projects must adhere to the IFC PS and Equator Principles
Defines IFC clients’ responsibilities for managing theirenvironmental and social risks
Risk management framework for determining, assessingand managingenvironmental and socialrisk in projects
Standards for responsible business conduct for issues suchas human rights, labourrights and theenvironment

Climate reporting and targets: Closer engagement with key suppliers
Climate targetin line with the Paris Agreement and 1.5°C scenario
Scope 1 and 2: • More than 50%
reduction by 2030• Net zero by 2050*
Scope 3: • Target to be set
2020 GHG emissions:
Scope 1 and 2: 6,442 tons
Diesel generators
Transformer stations
Vehicles Purchased ElectricityPurchasedHeating/Cooling
Scope 3: 1,368 tons
Estimated payback time for a 50 MW solar project: 1.5 years
Upstream transportation and distribution
Employee commuting
Purchased goods and services End of life
Business travel
*Base year is 201925

04
Financials

Strong growth in revenues and EBITDA
27
Proportionate financials
40% 63% 28% 53%
EBITDA Revenues
EBITDA margin
Quarterly (NOK million) Last 12 months (NOK million)
107
571
346
636
866
Q1 20 Q1 21
1,010
730 789
5,679
Q1 20
1,602
Q1 21
1,595
2,989
Cash Flow to Equity

Growth in Power Production partly offset by D&C
28
Proportionate financials
NOK millionRevenues Q1’21 Q1’20 FY2020
Power Production 924 391 1,708Services 56 52 232Development & Construction 24 414 873Corporate 6 8 33Total 1,010 866 2,844
EBITDAPower Production 704 331 1,404Services 17 16 82Development & Construction -60 15 -28Corporate -25 -16 -153Total 636 346 1,306
Comments• Strong growth in Power Production
after SN Power acquisition• Growth despite currency headwinds• Stable performance in Services• D&C revenues down with low
construction activity and opexincreased with development of large project pipeline
• Corporate cost increased moderately with the inclusion of SN Power

Quarterly (NOK million) Last 12 months (NOK million)
Power ProductionStrong increase in power production
84% 76% 84% 79%
EBITDA Revenues
EBITDAmargin
29
105
681
331
704
391
924
Q1 20 Q1 21
409
1,777
1,143
Q1 21Q1 20
1,357
1,003
2,241
Comments• New hydro assets adding NOK 367
million of EBITDA from last year• Strong performance on the
Philippines, EBITDA of NOK 243 million - up NOK 117 million from last year
• Solar assets with stable EBITDA generation year on year
• Debt refinancing on the Philippines released cash of NOK 397 million to Scatec
CF to equity

Power ProductionA well diversified power plant portfolio
30
2020 Pro forma Power Production:
(*) Perpetual concession for the hydro assets on the Philippines.
15%
11%
10%
29%
11%
7%
Honduras
Ukraine
Czech Republic
Brazil
South Africa
Jordan
Malaysia
Egypt
Philippines
Uganda
LaosRwanda Mozambique
Cash flow to Equity NOK 1,067 million
Remaining contract duration*
18+ yrs
EBITDA:NOK 2,706 million
Pro forma 2020 EBITDA distribution:
Quarterly (NOK million) Last 12 months (NOK million)
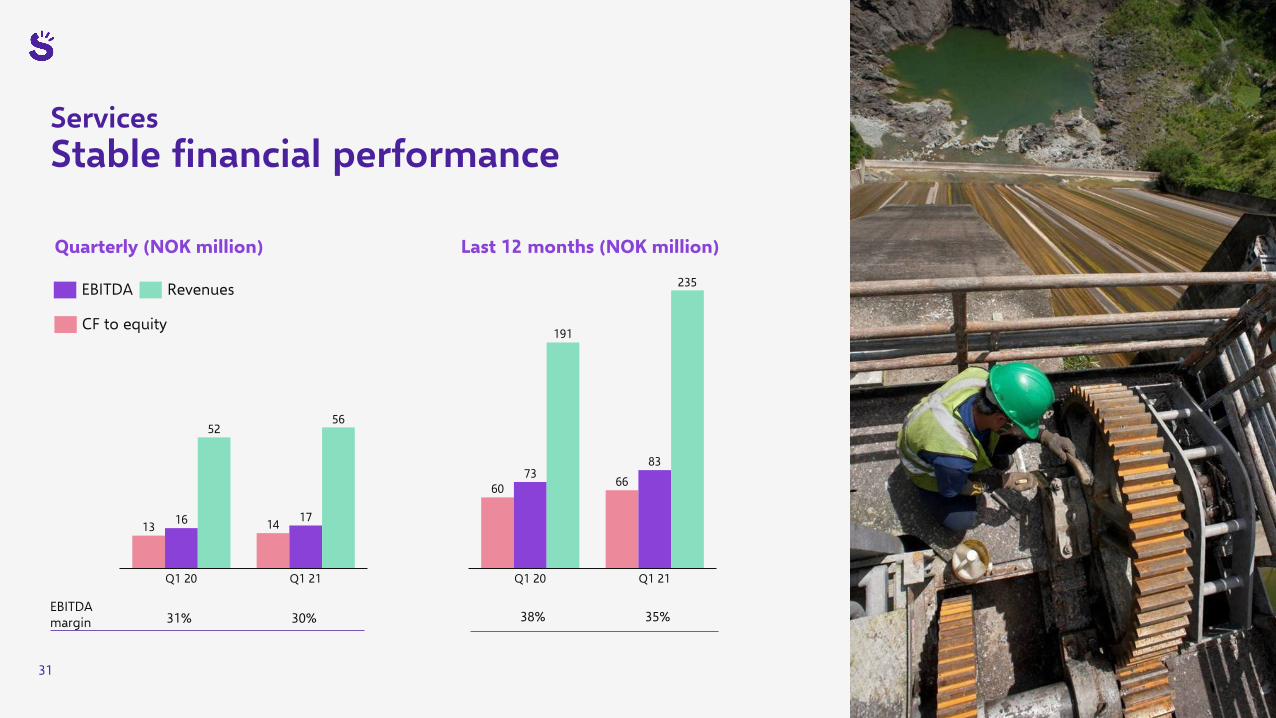
ServicesStable financial performance
31% 30% 38% 35%
EBITDA Revenues
31
EBITDAmargin
13 1416 17
5256
Q1 20 Q1 21
60 6673
83
191
235
Q1 21Q1 20
CF to equity

Quarterly (NOK million) Last 12 months (NOK million)
Development & ConstructionIncreased project development efforts
Gross margin
EBITDA margin
11% 1% 14% 13%
4% NA 11% NA
EBITDA Revenues
32
13
-51
15
-60
414
24
Q1 20 Q1 21
356
-50
445
-102
483
Q1 21Q1 20
4,097CF to equity

Bridging proportionate to consolidated P&L
33
Prop-ortionate
Residual Ownership
fully consolidated
entities
Elimination of equity
consolidated entities
Other Eliminations Consolidated
External revenues 925 279 -511 - 693 Internal revenues 85 6 -3 -88 -Net income from JV and associates - - 138 - 138 Total revenues and other income 1,010 284 -376 -87 831 Cost of sales -103 - 79 23 -
Gross profit 907 284 -295 -64 831 Personnel expenses -99 -2 12 7 -82 Other operating expenses -172 -50 43 60 -118 EBITDA 636 232 -240 3 631 Depreciation and impairment -230 -78 77 44 -187 EBIT 406 153 -162 47 444
Proportionate • Financials across operating segments – based
on Scatec’s ownership in power plants
Residual ownership• Adding financials of non-controlling interest for
fully consolidated power plants (solar & wind)
Elimination of equity consolidated entities• Deducting revenues, EBITDA and EBIT for equity
consolidated entities – and adding net income from the same
• Net income from hydro, in IFRS consolidated financials, is reported from 29 January 2021 -control transferred under IFRS
Other eliminations• Eliminating internal gross profit in D&C and
internal revenues and related opex in Services and Corporate segments
• Eliminating depreciation charges from historic internal gains – mostly related to D&C

A solid financial position
• Group free cash of NOK 2,918 million• Investments in JVs and associated companies of NOK 9,750
million, increased from NOK 612 million in 2020• Group* book equity of NOK 11,190 million
Consolidated financial position (NOK million)
34
(*) Defined as ‘recourse group’ in the corporate bond and loan agreements, where restricted cash is excluded.
34
6,369
33,553
27,184
9,637
Assets
4,156
19,760
Equity & Liabilities
33,553
Non-current liabilitiesCurrent assetsNon-current assets
EquityCurrent liabilities
Equity & Liabilities
9,074
17,59013,701
26,663
Assets
3,495
9,467
26,663
As of 31.12.2020 As of 31.03.2021
(NOK million) Consolidated Project
levelGroup level*
Total prop.
Cash 4,783 1,698 2,918 4,616
Debt -19,527 -11,277 -7,114 -18,392
Net debt -14,744 -9,580 -4,196 -13,776

723
14 491
Cash flow to equity Services
5,949
End Q1 21End Q4 20 Cash in acquired entities
-3,558-51
-359
-199
Distributions from operating power plants
Working Capital/other
Cash flow to equity D&C
2,918
-72
Project equityCash flow to equity Corporate
Net cash consideration
from acquistion of
SN Power
Project Development
capex
-20
NOK million
Movement of cash in ‘recourse group’ as defined in the corporate bond and loan agreements.
Q1’21 movement of the Group’s free cash
35

Staying selective when investing
36
• Power Production: Avg. Equity IRR on investments: 12-16%• 30-year cash flows • Average across technologies, regions & currencies
• Development & Construction gross margin: 10-12%• D&C revenues expected to average 50-70% of project
capex dependent on Scatec’s role in the project
• Focus on capital discipline

Target of 15 GW by end 2025 representing NOK 100 billion of capex
100
Capex
60-70
Project finance debt
Partner equity
15-20
Scatec equity
15-20
60-70% leverage based on long term contracts
Scatec Equity Available liquidity
Other
10-12
1-4
Cash flow
4.5
15-20
Cash Flow to Equity across all segments net of shareholder dividends
Cash & credit lines
50-60% Scatec ownership in new assets
Capital structure for 12 GW new capacity towards 2025NOK billion
Scatec Equity funded by cash & operating cash flowNOK billion
37
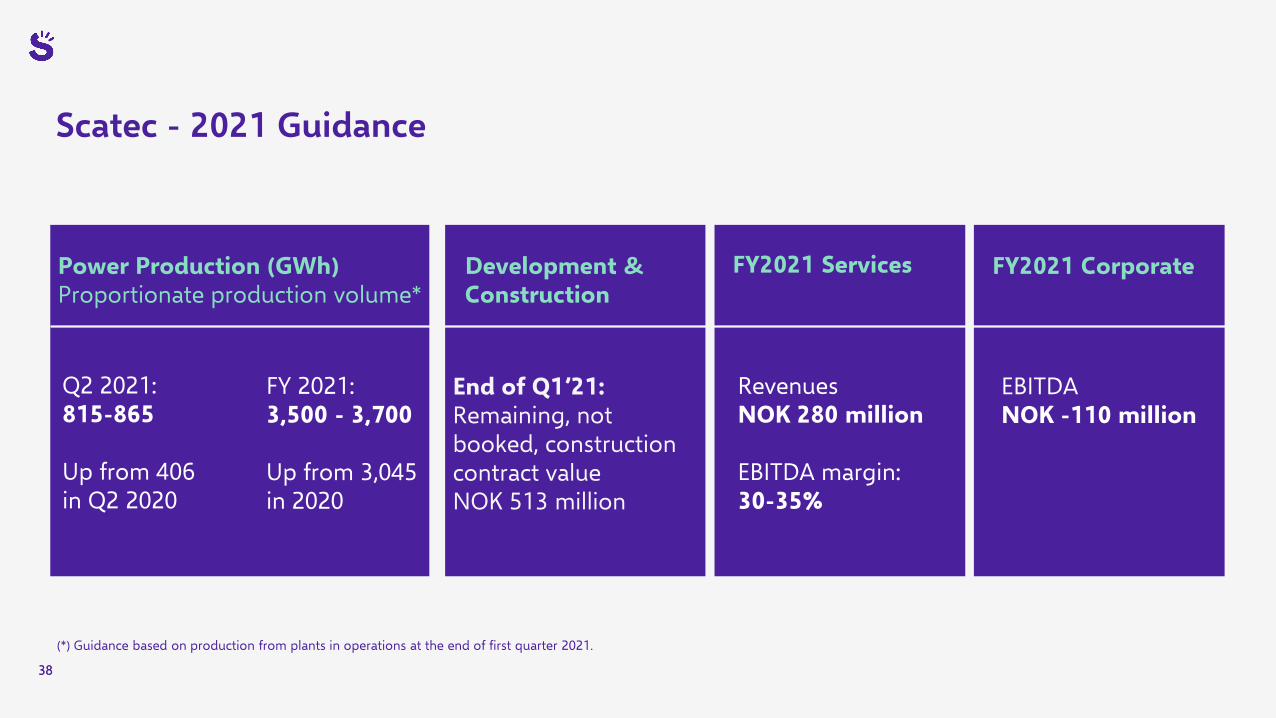
Scatec - 2021 Guidance
3838
Power Production (GWh)Proportionate production volume*
Development &Construction
FY2021 Corporate
Q2 2021:815-865
Up from 406 in Q2 2020
End of Q1’21: Remaining, not booked, construction contract value NOK 513 million
EBITDA NOK -110 million
(*) Guidance based on production from plants in operations at the end of first quarter 2021.
FY 2021:3,500 - 3,700
Up from 3,045 in 2020
FY2021 Services
Revenues NOK 280 million
EBITDA margin: 30-35%

05
Summary

Building a global leader in renewable energy
Global top-tier developer/IPP
Where we are now
A global multi-technology renewables developer/IPP
Where we are going
Regional solar developer/IPP Where we come from
Solar Solar Solar
Hydro Hydro
Wind Wind
Storage Storage

A NOK 100 billion business plan towards 2025- Building on our key strengths
41(*) In operation or under construction..
15 GW capacity* by end of 2025
Renewables in high growth markets
A proven business model
Agile organisation with a growth track record
Leading in ESGFinancial discipline and solid cash flow
Strong partnerships

Our asset portfolio
Capacity EconomicMW interest
Sukkur, Pakistan 150 75%Progressovka, Ukraine 148 100%Guanizuil IIA, Argentina 117 50%Chigirin, Ukraine 55 100%Torex Gold, Mexico 9 100%Total 479 78%
Capacity EconomicMW interest
Tunisia 360 55%Brazil 101 40%Ukraine 65 65%Bangladesh 62 65%Mali 33 64%Lesotho 20 48%Total 641 55%
Under construction
Project backlog
Capacity Share in %MW
Solar 4,686 42%Hydro 2,516 23%Wind 1,871 17%Hybrid solutions 1,726 15%Release 300 3%Total 11,098 100%
Project pipeline
Capacity EconomicMW interest
Theun Hinboun, Laos 525 20%Magat, Philippines 388 50%Benban, Egypt 380 51%Upington, South Africa 258 46%Bujagali, Uganda 255 28%Quantum Solar Park, Malaysia 197 100%Apodi, Brazil 162 44%Binga, Philippines 140 50%Ambuklao, Philippines 105 50%Kalkbult, South Africa 75 45%Dreunberg, South Africa 75 45%Agua Fria, Honduras 60 40%Boguslav, Ukraine 54 100%Rengy, Ukraine 47 51%Redsol, Malaysia 47 100%Jordan, Jordan 43 62%Linde, South Africa 40 45%Mocuba, Mozambique 40 53%Dam Nai, Vietnam 39 100%Los Prados, Honduras 35 70%Kamianka, Ukraine 32 61%Czech, Czech Republic 20 100%Maris Hydro, Philippines 9 50%Asyv, Rwanda 9 54%Total 3,035 48%
Plants in operation