Investor Presentation - s2.q4cdn.com · Investor Presentation. Safe Harbor. This presentation...
18
February 2017 Investor Presentation
Transcript of Investor Presentation - s2.q4cdn.com · Investor Presentation. Safe Harbor. This presentation...

February 2017
Investor Presentation

Safe HarborThis presentation contains, or may be deemed to contain, "forward-looking statements" (as defined in the US Private Securities Litigation Reform Act of 1995) which reflect our current views with respect to future events and financial performance. We use words such as "anticipates,", “projection”, “outlook”, “forecast”, "believes," "plan," "expect," "future,"' "intends," "may," "will," "estimates," "predicts," and similar expressions to identify these forward-looking statements. Forward looking statements included in this presentation include our expectations about achieving our longer-term revenue and profitability goals and with respect to our first quarter 2017 outlook. All forward-looking statements address matters that involve risks and uncertainties. Accordingly, the Company’s actual results may differ materially from the results predicted or implied by these forward-looking statements. These risks, uncertainties and other factors also include, among others, those identified in "Risk Factors”, "Management's Discussion and Analysis of Financial Condition and Results of Operations'' and elsewhere in our annual report on Form 10-K for the year ended December 25, 2015 as filed with the Securities and Exchange Commission and subsequently filed quarterly reports on Form 10-Q. Additional information will also be set forth in our annual report on Form 10-K for the year ended December 30, 2016. Ultra Clean Holdings, Inc. undertakes no obligation to publicly update or review any forward-looking statements, whether as a result of new information, future developments or otherwise unless required by law.
Management uses non-GAAP net income and non-GAAP net income per diluted share to evaluate the Company's operating and financial results. The Company believes the presentation of non-GAAP results is useful to investors for analyzing our core business and business trends and comparing performance to prior periods, along with enhancing investors' ability to view the Company's results frommanagement's perspective. The presentation of this additional information should not be considered a substitute for results prepared in accordance with GAAP. Tables presenting reconciliations of non-GAAP results to U.S. GAAP results are included in the Appendix.
2
Non-GAAP

3 Main Drivers for 2017– 2017 WFE spending to increase on 3D NAND & node transitions in 10nm Logic & 1x DRAM
– Our primary customers are concentrated in Deposition & Etch; fastest growing areas of WFE
– High OEM factory capacity utilization is driving a strong push for expanded outsourcing
• Share gain opportunities for the strongest suppliers with the broadest capabilities
• Ability to manufacture major modules across the customer’s entire tool is fueling strong growth
3
UCT Highlights
Leading outsourcing manufacturer for the semiconductor capital equipment industry
Source: Gartner Oct 2016, SEMI WSEMS and UCT estimates
20152016(F)
2017(F)2018(F)
$31.5
$34.0
$36.0 $36.2
4
Wafer Fab Equipment Spending Reaching New Highs
($B)
8%
6%
Source: Gartner Jan 2017

Deposition & Etch Outperforming WFE Market
2016 WFE Estimate: $34.0B
>80%of UCT Semi
Sales
Dep & Etch CapEx Spend 9-10% CAGR 2013 - 2018
Total CapExSpend~6% CAGR 2013 - 2018
Thermal & Implant
5% Deposition23%
Removal27%
Lithography27%
Metrology & Inspection
12%
Other6%
Source: Gartner Oct 2016, SEMI WSEMS and UCT estimates5

OEM Component Suppliers
34%
OEM Integration In-Sourcing
44%
UCT5%
For example: Flex, Celestica, Benchmark, etc.
Specialty Contract Manufacturers
6
Inflection:OEM Outsourcing Accelerating Dramatically
Source: UCT estimates as of Nov 2016.

7
Winning StrategyPrimary Focus on Semiconductors
Broaden CriticalProcess Capabilities
Make StrategicInvestments
Increase UCT Content on Platforms
Deepen Engagementwith Existing Customers & Add New Customers
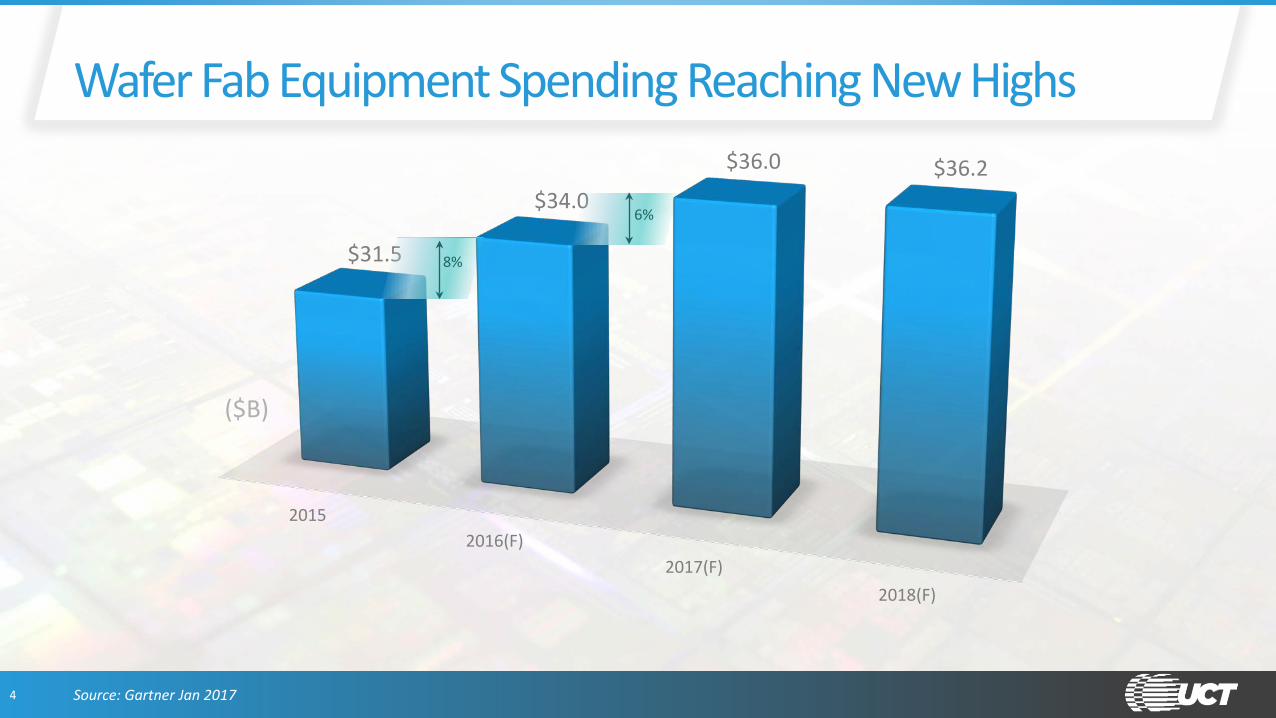
GAS
FOUNDING CAPABILITY
8
Expanding Critical Capabilities to Capture New Opportunities
Chemical Delivery Sub-Systems
Complete Assemblies
LIQUID DELIVERY
ASSEMBLYINTEGRATION
& TEST
ManufacturedComponents
FRAMES PROTOTYPE MACHINING
MACHININGMETALS
PLASTICMODULES
SHEET METAL FORMING
THERMAL PRODUCTS

9
UCT Expert Outsourcing Partner
MANUFACTURING
INTEGRATION & TESTPROTOTYPING/ DEVELOPMENT
MANUFACTURINGENGINEERING
SUPPLY CHAIN MANAGEMENT
Design for manufacturability (DFM) Partnering with customers for new product requirements Network of global, strategic suppliers Comprehensive new product introduction process Sub-system through full tool integration

External Use10
Now Addressing Major Modules in Semiconductor Equipment
Wafer transfer: 10 – 20% 15 – 30%Factory InterfaceVacuum Transfer
Process Chamber: 55 – 70% 50 – 75%
Gas Panel: 15 – 20% 0 – 10%
TYPICAL CVD & ETCH TOOL COST OTHER PROCESS TOOL TYPES
Source: UCT estimates.

11
UCT Strong Growth in Semiconductor Equipment
Strategy to focus on semiconductor successful• 20% revenue increase in 2016
– New module wins – Strong Etch & CVD markets
• Semi revenue currently represents 90%• In addition to strong gas panel core business,
new modules driving further growth
Non-semi now dominated by Display• Resurgence in display due to OLED and going
forward Gen 10+20122013
20142015
2016
$345$390
$423 $433
$508
(in $M)

12
Select 2016 YTD Financial Data
* Non-GAAP results exclude intangible asset amortization and non-recurring expense items
($M) Q1’16 Q2’16 Q3’16 Q4’16
Revenue $112.2 $129.8 $146.2 $174.5
Gross Margin 13.0% 14.7% 16.1% 17.0%
GAAP Net Income ($3.2) $0.7 $2.6 $10.0
GAAP Basic & Diluted EPS ($.10) $0.02 $0.08 $0.30
Non-GAAP* Net Income ($0.0) $3.2 $5.7 $12.0
Non-GAAP* Diluted EPS ($0.0) $0.10 $0.17 $0.36
Cash $45.5 $44.1 $47.3 $52.5

Revenue Range $145M $165M $185M
Gross Margins 14% - 16% 15% - 17% 16% - 18%
Operating Margins(Non-GAAP*)
4% - 6% 6% - 7% 8% - 10%
13
Leveraging Our Model
* Excludes intangible amortization expense and non-recurring items.

• Outperforming a growing Semiconductor WFE market
• Rapidly expanding opportunities in customer’s major modules
• Delivering what customers need (OTD, quality, cost)
• Industry trends reinforce leading position as potential supply chain consolidator
• Key partner to top customers
14
Compelling UCT Opportunity
WinningStrategy
StrongMargins
Improving Profitability
Solid Cash Generation

Thank You

(in thousands)Three months ended:
Dec. 25, 2015Three months ended:
Mar 25, 2016Three months ended:
June 24, 2016Three months ended:
Sept. 23, 2016Three months ended:
Dec. 30, 2016
Reported net income on a GAAP basis $15,788 $(3,239) $723 $2,614 $9,953Amortization of intangible assets (1) $2,170 $1,440 $1,440 $1,438 $1,439Executive transition costs (2) $421 - - $925 -Restructuring charges (3) $245 $177 $70 $(105) $109Acquisition costs (4) - - - - -Impairment of “Held for Sale” Assets (5) - - - - $666Termination of Contractual Obligation (6) - - - - $438Income tax effect of non-GAAP adjustments (7) $(794) $(385) $(406) $(574) $(549)Income tax effect of valuation allowance (8) $13,424 $1,876 $1,384 $1,391 $(49)Non-GAAP net income $(322) $(131) $3,211 $5,689 $12,007
16
Reconciliation: GAAP Net Income to Non-GAAP Net Income
(1) Amortization of intangible assets related to the Company's acquisitions of AIT, Marchi and Miconex(2) Represents expense for termination benefits paid to former executives of the Company(3) Adjustment to previous restructuring reserve related to the abandonment of one of the Company's facilities(4) Costs incurred related to the acquisition of Marchi and Miconex
(5) Impairment of assets classified as “held for sale” related to our 3D printing business in Singapore(6) Amount paid related to the termination of a long-term contractual obligation to our 3D printing business in Singapore(7) Tax effect on amortization of intangible assets, executive transition costs, restructuring charges, acquisition costs, impairment charges, and buy-out costs based on the non-GAAP tax rate(8) The Company's GAAP tax expense is substantially higher than the Company's non-GAAP tax expense, primarily due to losses in the U.S. with full federal and state valuation allowances. The Company's non-
GAAP tax rate and resulting non-GAAP tax expense considers the tax implications as if there was no federal or state valuation allowance position in effect

(in thousands)Three months ended:
Dec. 25, 2015Three months ended:
Mar 25, 2016Three months ended:
June 24, 2016Three months ended:
Sept. 23, 2016Three months ended:
Dec. 30, 2016
Reported income from operations on a GAAP basis $(3,314) $(698) $3,719 $6,700 $12,670
Amortization of intangible assets (1) $2,170 $1,440 $1,440 $1,438 $1,439
Executive transition costs (2) $421 - - $925 -
Restructuring charges (3) $245 $177 $70 $(105) $109
Acquisition costs (4) - - - - -
Impairment of “Held for Sale” Assets (5) - - - - $666
Termination of Contractual Obligation (6) - - - - $438
Non-GAAP income from operations $(478) $919 $5,229 $8,958 $15,322
17
Reconciliation: GAAP Income from Operations to Non-GAAP Income from Operations
(1) Amortization of intangible assets related to the Company's acquisitions of AIT, Marchi and Miconex(2) Represents expense for termination benefits paid to former executives of the Company(3) Adjustment to previous restructuring reserve related to the abandonment of one of the Company's facilities(4) Costs incurred related to the acquisition of Marchi and Miconex(5) Impairment of assets classified as “held for sale” related to our 3D printing business in Singapore(6) Amount paid related to the termination of a long-term contractual obligation to our 3D printing business in Singapore

Three months ended:
Dec. 25, 2015Three months ended:
March 25, 2016Three months ended:
June 24, 2016Three months ended:
Sept. 23, 2016Three months ended:
Dec. 30, 2016
Reported net income on a GAAP basis $(0.49) $(0.10) $0.02 $0.08 $0.30Amortization of intangible assets (1) $0.07 $0.04 $0.05 $0.04 $0.04Executive transition costs (2) $0.01 - - $0.03 -Restructuring charges (3) $0.01 $0.01 $0.00 $0.00 -Acquisition costs (4) - - - - -Impairment of “Held for Sale” Assets (5) - - - - $0.02Termination of Contractual Obligation (6) - - - - $0.01Income tax effect of non-GAAP adjustments (7) $(0.03) $(0.01) $(0.01) $(0.02) $(0.01)Income tax effect of valuation allowance (8) $0.42 $0.06 $0.04 $0.04 -Non-GAAP net income $(0.01) $(0.00) $0.10 $0.17 $0.36Weighted average number of diluted shares (k) 32,212 32,309 32,792 33,100 33,526
18
Reconciliation: GAAP Earnings Per Diluted Share to Non-GAAP Earnings Per Diluted Share
(1) Amortization of intangible assets related to the Company's acquisitions of AIT, Marchi and Miconex(2) Represents expense for termination benefits paid to former executives of the Company(3) Adjustment to previous restructuring reserve related to the abandonment of one of the Company's facilities(4) Costs incurred related to the acquisition of Marchi and Miconex
(5) Impairment of assets classified as “held for sale” related to our 3D printing business in Singapore(6) Amount paid related to the termination of a long-term contractual obligation to our 3D printing business in Singapore(7) Tax effect on amortization of intangible assets, executive transition costs, restructuring charges, acquisition costs, impairment charges, and buy-out costs based on the non-GAAP tax rate(8) The Company's GAAP tax expense is substantially higher than the Company's non-GAAP tax expense, primarily due to losses in the U.S. with full federal and state valuation allowances. The Company's non-
GAAP tax rate and resulting non-GAAP tax expense considers the tax implications as if there was no federal or state valuation allowance position in effect