Investor Presentation - s2.q4cdn.com . Lightsquared . NII Holdings . ... J.C. Penney . Genco...
30
Investor Presentation March 2016
Transcript of Investor Presentation - s2.q4cdn.com . Lightsquared . NII Holdings . ... J.C. Penney . Genco...

Investor Presentation
March 2016

Forward-Looking Statements This presentation contains forward-looking statements within the meaning of Section 27A of the Securities Act of 1933, as amended, and Section 21E of the Securities Exchange Act of 1934, as amended. Forward-looking statements include the information concerning PJT Partners Inc.’s possible or assumed future results of operations, business strategies, financing plans, competitive position, potential growth opportunities, potential operating performance improvements, benefits resulting from the separation of PJT Partners from Blackstone and its combination with PJT Capital LP, the effects of competition and the effects of future legislation or regulations. Forward-looking statements include all statements that are not historical facts and can be identified by the use of forward-looking terminology such as the words “believe,” “expect,” “plan,” “intend,” “anticipate,” “estimate,” “predict,” “potential,” “continue,” “may,” “might,” “should,” “could” or the negative of these terms or similar expressions. Forward-looking statements involve risks, uncertainties and assumptions. Actual results may differ materially from those expressed in such forward-looking statements. You should not put undue reliance on any forward-looking statements contained herein. PJT Partners undertakes no obligation to publicly update or review any forward-looking statement, whether as a result of new information, future developments or otherwise. The risk factors discussed in the “Risk Factors” section of our Annual Report or Form 10-K for the year ended December 31, 2015, as well as the other filings of PJT Partners with the SEC, could cause the results of PJT Partners to differ materially from those expressed in forward-looking statements. There may be other risks and uncertainties that PJT Partners is unable to predict at this time or that are not currently expected to have a material adverse effect on its business. Any such risks could cause the results of PJT Partners to differ materially from those expressed in forward-looking statements. Non-GAAP Financial Measures This presentation contains certain non-GAAP financial measures. A “non-GAAP financial measure” is defined as a numerical measure of a company’s financial performance that excludes or includes amounts so as to be different than the most directly comparable measure calculated and presented in accordance with generally accepted accounting principles in the United States of America (“GAAP”) in the statements of operations, financial condition or statements of cash flow of the company. The Company has provided a reconciliation of Adjusted Pre-Tax Income, a non-GAAP financial measure, to GAAP Income (Loss) Before Provision for Taxes in the Appendix to this presentation. Adjusted Pre-Tax Income is presented because management believes that such a financial measure, when viewed with the Company’s results of operations in accordance with GAAP and the reconciliation of Adjusted Pre-Tax Income to Income (Loss) Before Provision for Taxes, provides additional information to investors about certain transaction-related charges arising from the spin-off related transactions. You should not consider Adjusted Pre-Tax Income in isolation, or as a substitute for analysis of results as reported under GAAP. Our calculation of Adjusted Pre-Tax Income may not be comparable to that reported by other companies. For additional information about our non-GAAP financial measures, see our filings with the Securities and Exchange Commission. Disclaimers This document is “as is” and is based, in part, on information obtained from other sources. Our use of such information does not imply that we have independently verified or necessarily agree with any of such information, and we have assumed and relied upon the accuracy and completeness of such information for purposes of this document. Neither we nor any of our affiliates or agents, make any representation or warranty, express or implied, in relation to the accuracy or completeness of the information contained in this document or any oral information provided in connection herewith, or any data it generates and expressly disclaim any and all liability (whether direct or indirect, in contract, tort or otherwise) in relation to any of such information or any errors or omissions therein. Any views or terms contained herein are preliminary, and are based on financial, economic, market and other conditions prevailing as of the date of this document and are subject to change. We undertake no obligations or responsibility to update any of the information contained in this document. Past performance does not guarantee or predict future performance. This document does not constitute an offer to sell or the solicitation of an offer to buy any security, nor does it constitute an offer or commitment to lend, syndicate or arrange a financing, underwrite or purchase or act as an agent or advisor or in any other capacity with respect to any transaction, or commit capital, or to participate in any trading strategies, and does not constitute legal, regulatory, accounting or tax advice to the recipient. This document does not constitute and should not be considered as any form of financial opinion or recommendation by us or any of our affiliates. This document is not a research report nor should it be construed as such. Presentation of Information All facts, metrics and other information provided herein are presented as of 12/31/15 unless otherwise stated.
Copyright © 2016, PJT Partners Inc. (and its affiliates, as applicable).
Notices and Disclaimers
1

A Powerful Beginning
> 30-years new: proven track record with start-up feel
> Premier destination for best-in-class talent
> Unshackled from constraints to better pursue opportunities
> Bringing together relationships and capabilities to better serve clients
2
Built to be an alpha play
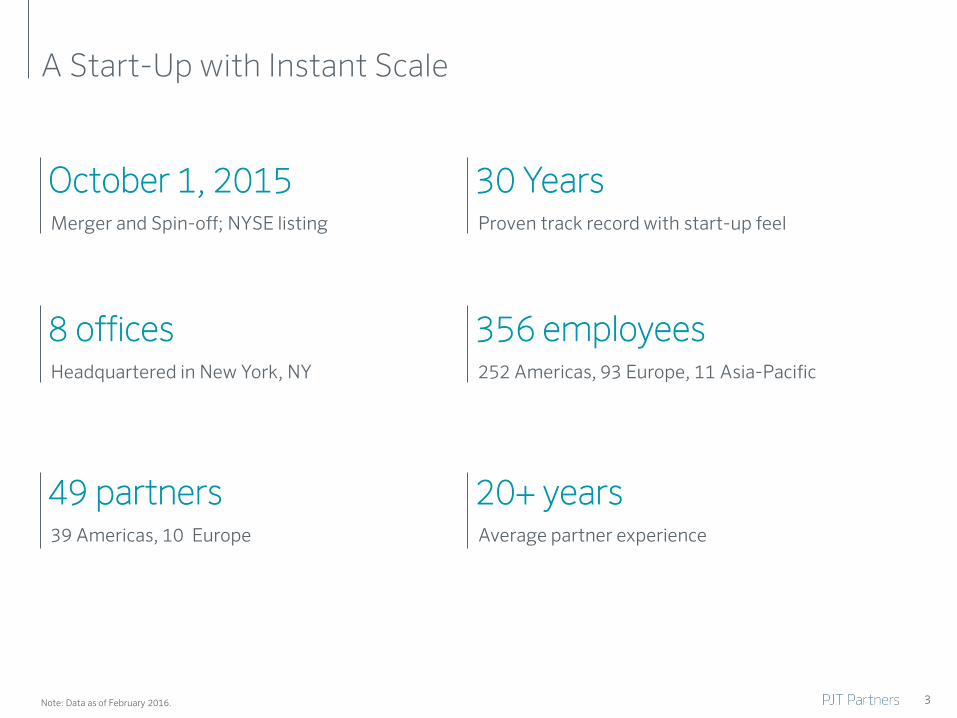
A Start-Up with Instant Scale
Note: Data as of February 2016.
8 offices Headquartered in New York, NY
49 partners
39 Americas, 10 Europe
356 employees
252 Americas, 93 Europe, 11 Asia-Pacific
20+ years Average partner experience
October 1, 2015 Merger and Spin-off; NYSE listing
30 Years
Proven track record with start-up feel
3
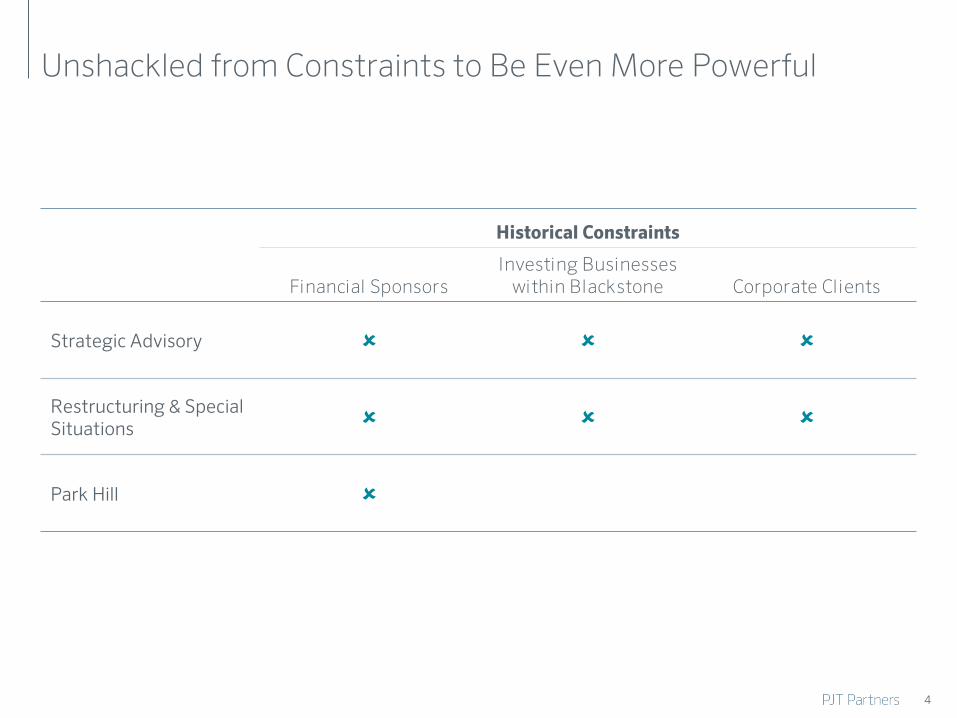
Unshackled from Constraints to Be Even More Powerful
Historical Constraints
Financial Sponsors Investing Businesses
within Blackstone Corporate Clients
Strategic Advisory
Restructuring & Special Situations
Park Hill
4
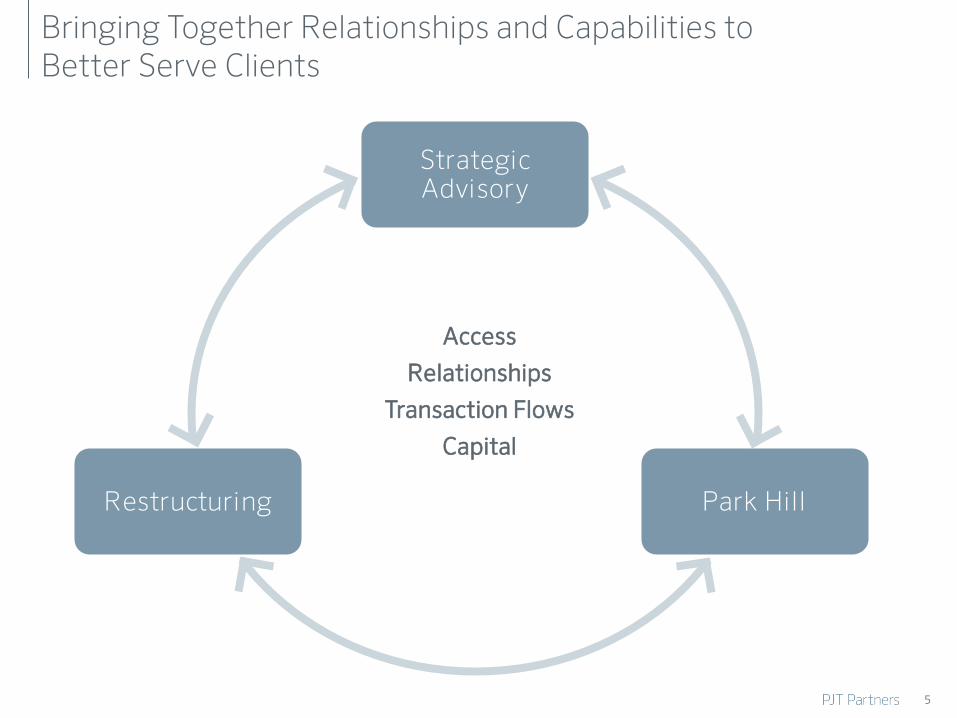
Bringing Together Relationships and Capabilities to Better Serve Clients
Strategic Advisory
Park Hill Restructuring
Access
Relationships
Transaction Flows
Capital
5

Create long-term value
Make a difference
Be part of a premier franchise
Be surrounded by leading talent
Client relationships
Collaboration
Premier Destination for Best-in-Class Talent
WHAT WE OFFER WHAT WE VALUE
Alpha players with:
Content
Character
6
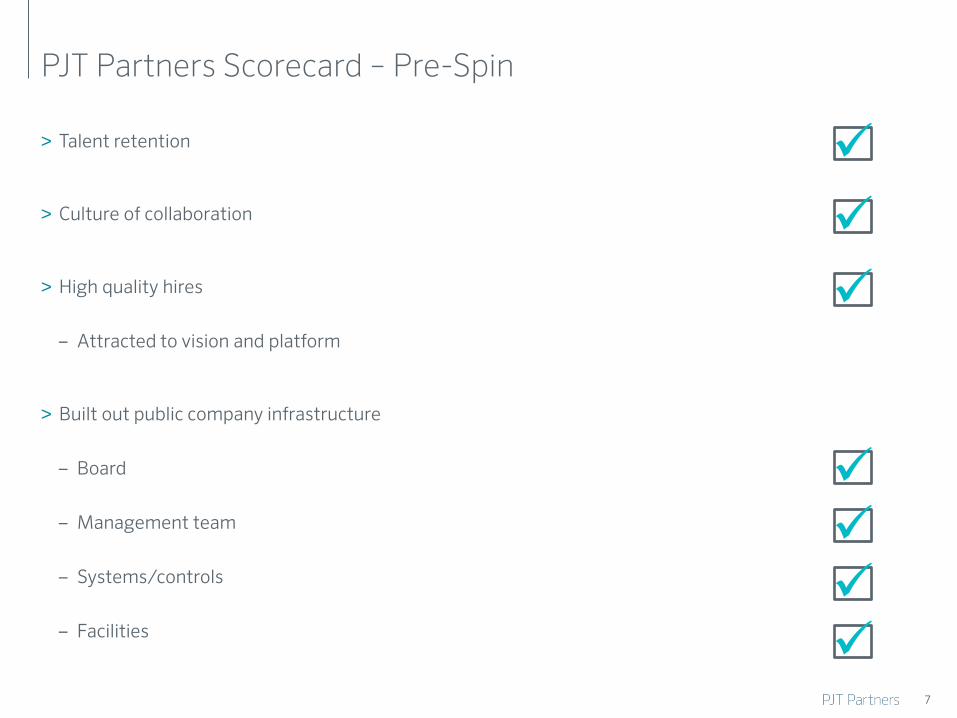
PJT Partners Scorecard – Pre-Spin
> Talent retention
> Culture of collaboration
> High quality hires
‒ Attracted to vision and platform
> Built out public company infrastructure
‒ Board
‒ Management team
‒ Systems/controls
‒ Facilities
7
8
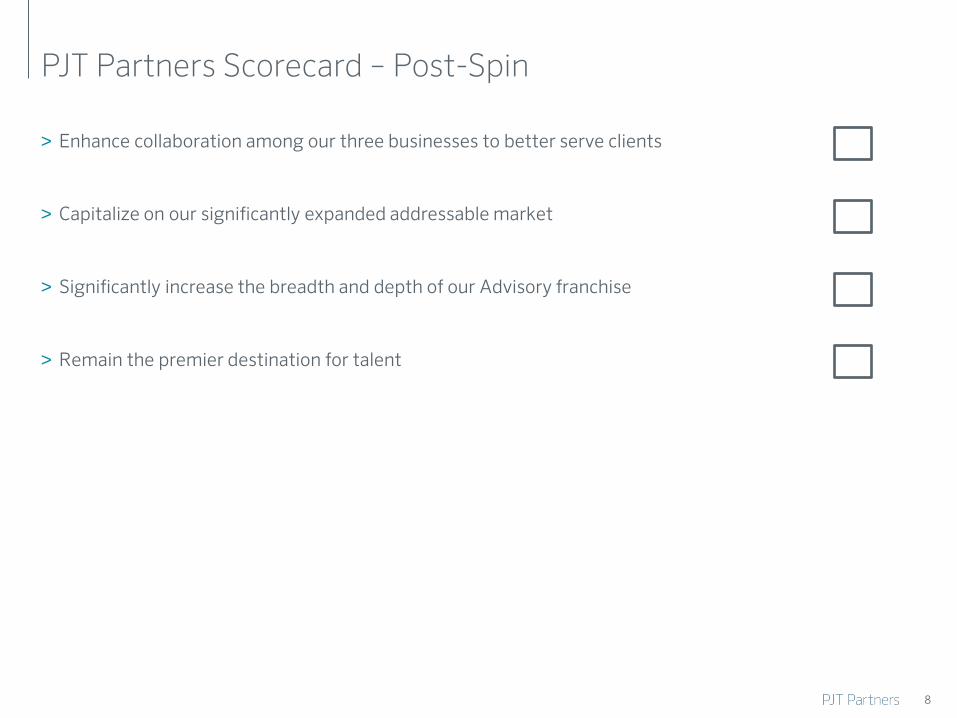
PJT Partners Scorecard – Post-Spin
> Enhance collaboration among our three businesses to better serve clients
> Capitalize on our significantly expanded addressable market
> Significantly increase the breadth and depth of our Advisory franchise
> Remain the premier destination for talent
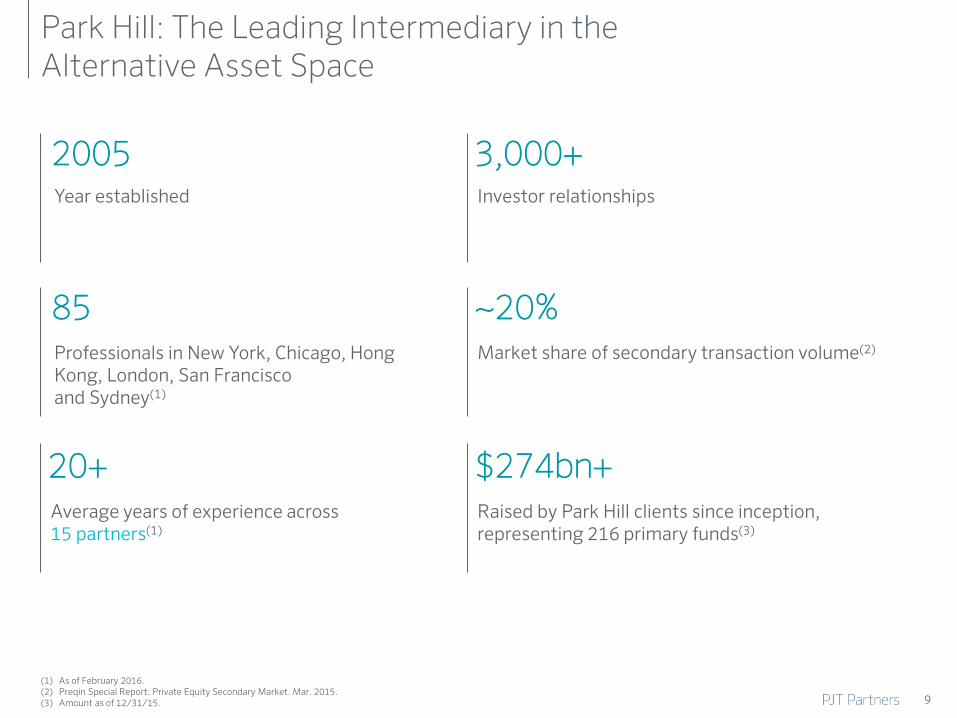
Park Hill: The Leading Intermediary in the Alternative Asset Space
(1) As of February 2016. (2) Preqin Special Report: Private Equity Secondary Market. Mar. 2015. (3) Amount as of 12/31/15.
2005 Year established
85 Professionals in New York, Chicago, Hong Kong, London, San Francisco and Sydney(1)
3,000+ Investor relationships
20+ Average years of experience across 15 partners(1)
~20% Market share of secondary transaction volume(2)
$274bn+ Raised by Park Hill clients since inception, representing 216 primary funds(3)
9
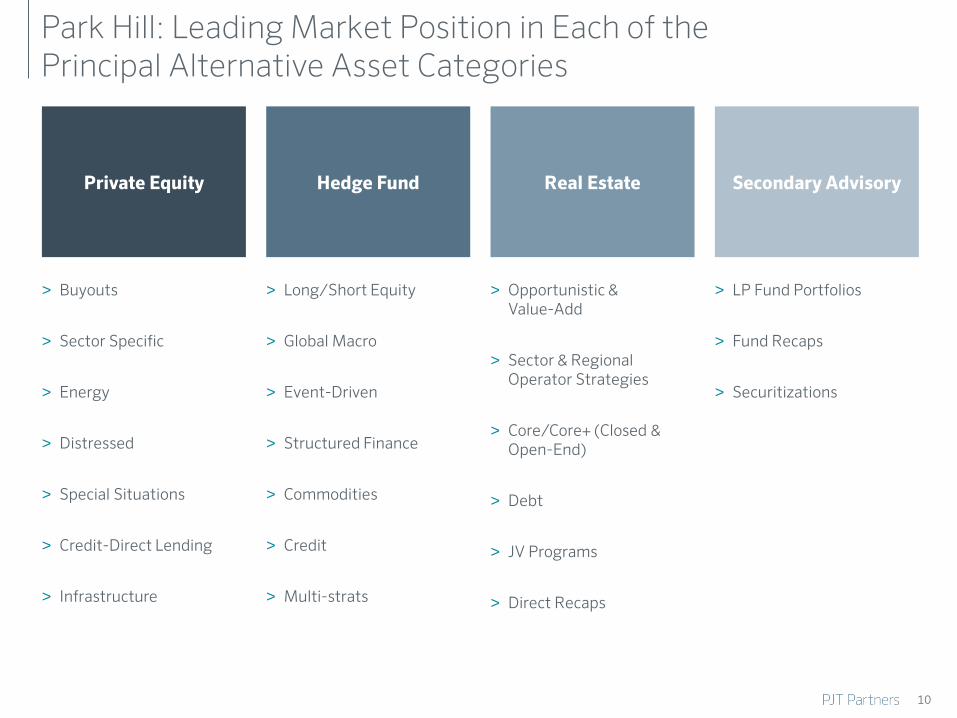
Park Hill: Leading Market Position in Each of the Principal Alternative Asset Categories
10
Private Equity Hedge Fund Real Estate Secondary Advisory
> Buyouts
> Sector Specific
> Energy
> Distressed
> Special Situations
> Credit-Direct Lending
> Infrastructure
> Long/Short Equity
> Global Macro
> Event-Driven
> Structured Finance
> Commodities
> Credit
> Multi-strats
> Opportunistic & Value-Add
> Sector & Regional Operator Strategies
> Core/Core+ (Closed & Open-End)
> Debt
> JV Programs
> Direct Recaps
> LP Fund Portfolios
> Fund Recaps
> Securitizations
11
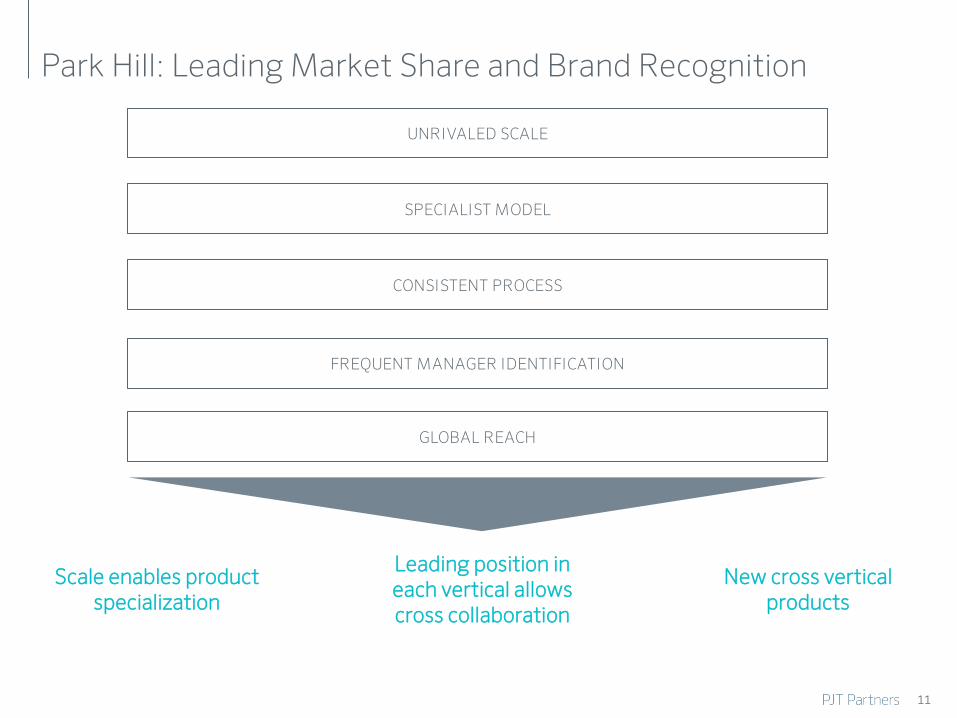
Park Hill: Leading Market Share and Brand Recognition
Scale enables product specialization
SPECIALIST MODEL
CONSISTENT PROCESS
GLOBAL REACH
Leading position in each vertical allows cross collaboration
New cross vertical products
UNRIVALED SCALE
FREQUENT MANAGER IDENTIFICATION
12
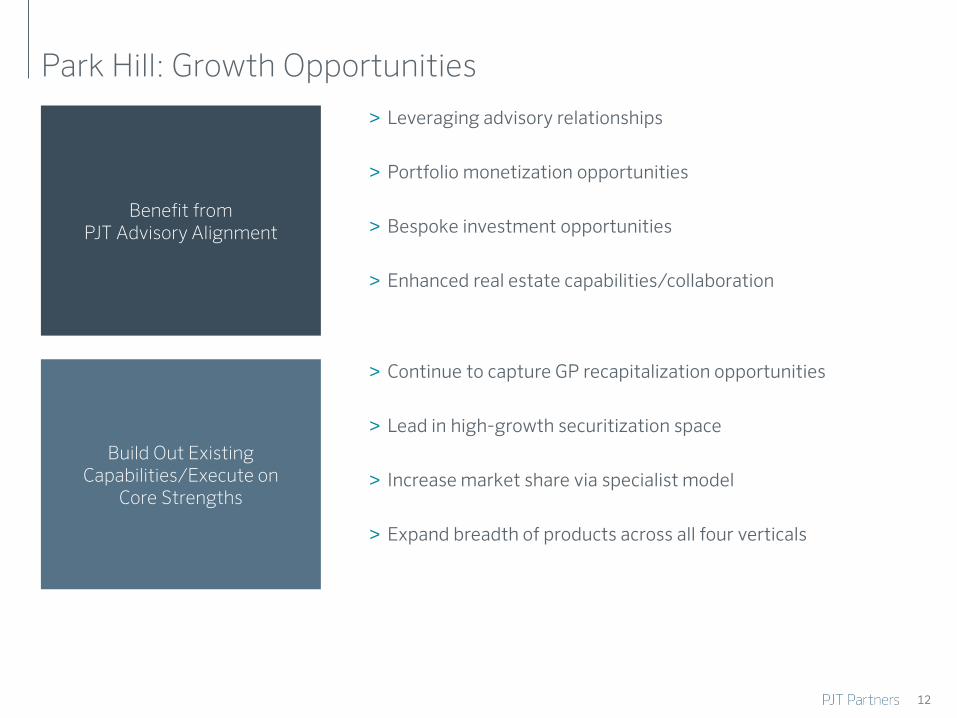
Park Hill: Growth Opportunities
Benefit from PJT Advisory Alignment
> Leveraging advisory relationships
> Portfolio monetization opportunities
> Bespoke investment opportunities
> Enhanced real estate capabilities/collaboration
Build Out Existing Capabilities/Execute on
Core Strengths
> Continue to capture GP recapitalization opportunities
> Lead in high-growth securitization space
> Increase market share via specialist model
> Expand breadth of products across all four verticals
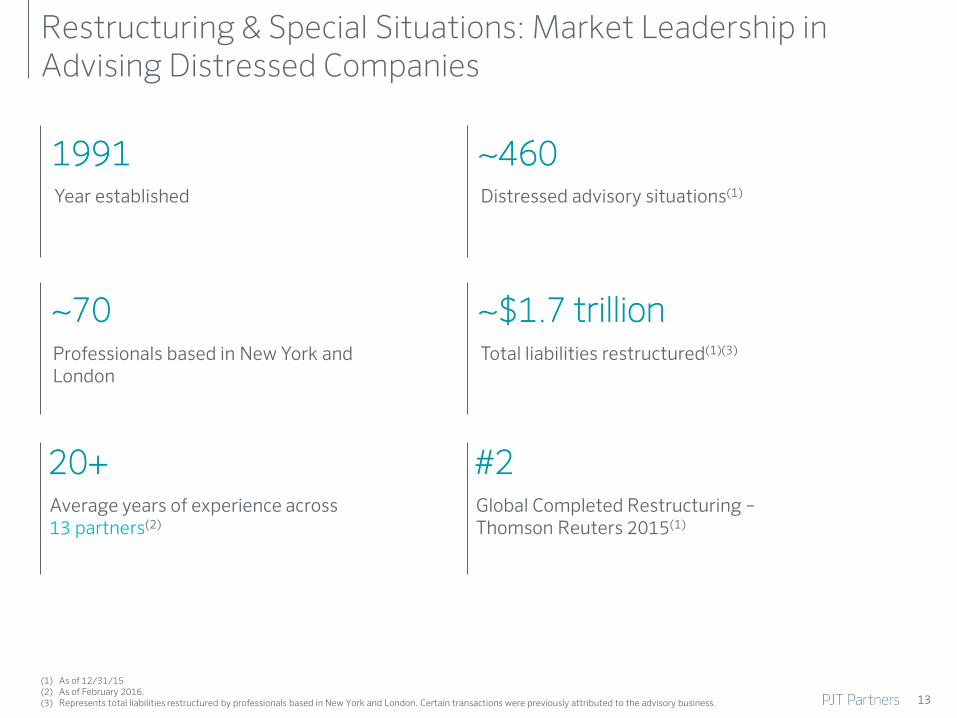
Restructuring & Special Situations: Market Leadership in Advising Distressed Companies
(1) As of 12/31/15 (2) As of February 2016. (3) Represents total liabilities restructured by professionals based in New York and London. Certain transactions were previously attributed to the advisory business.
1991 Year established
~70 Professionals based in New York and London
~460 Distressed advisory situations(1)
#2 Global Completed Restructuring – Thomson Reuters 2015(1)
20+ Average years of experience across 13 partners(2)
~$1.7 trillion Total liabilities restructured(1)(3)
13
14
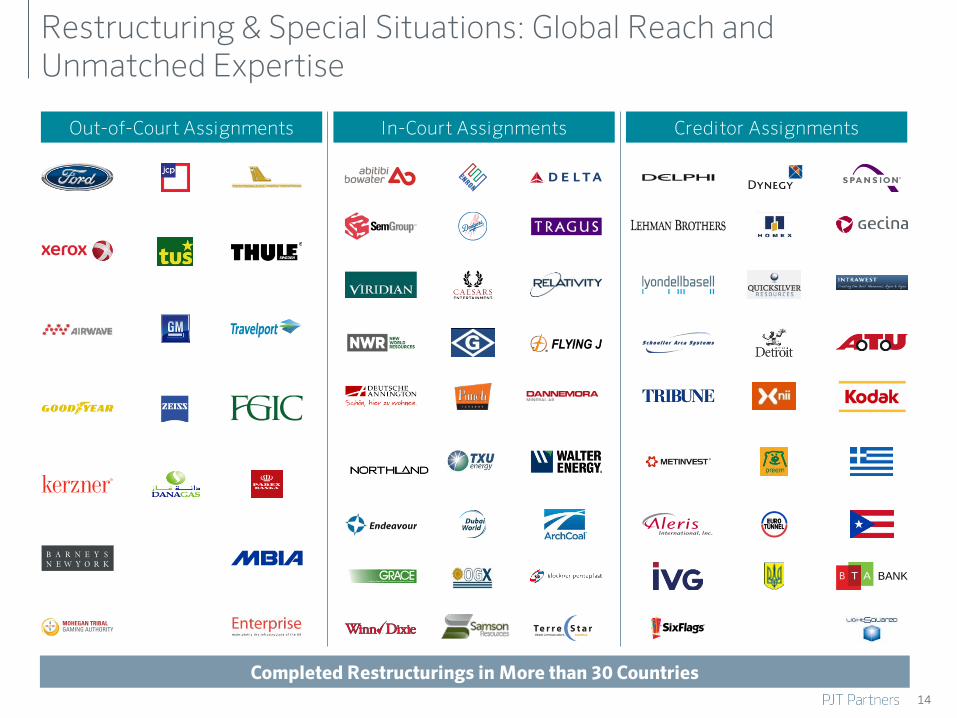
Restructuring & Special Situations: Global Reach and Unmatched Expertise
B T A BANK
Completed Restructurings in More than 30 Countries
In-Court Assignments Creditor Assignments Out-of-Court Assignments
Caesars Entertainment
Foxwoods Casino
Mohegan Tribal Gaming
New World Resources
Arch Coal
Walter Energy
Dow Corning
Specialty Products Holding
W.R. Grace & Co.
CEDC
Eastman Kodak
Hostess Brands
Dynegy
Edison Mission Energy
Energy Future Holdings
Ambac Financial Group
MBIA re: Bank of America
Northern Rock
Cengage Learning
Houghton Mifflin
GateHouse Media
15
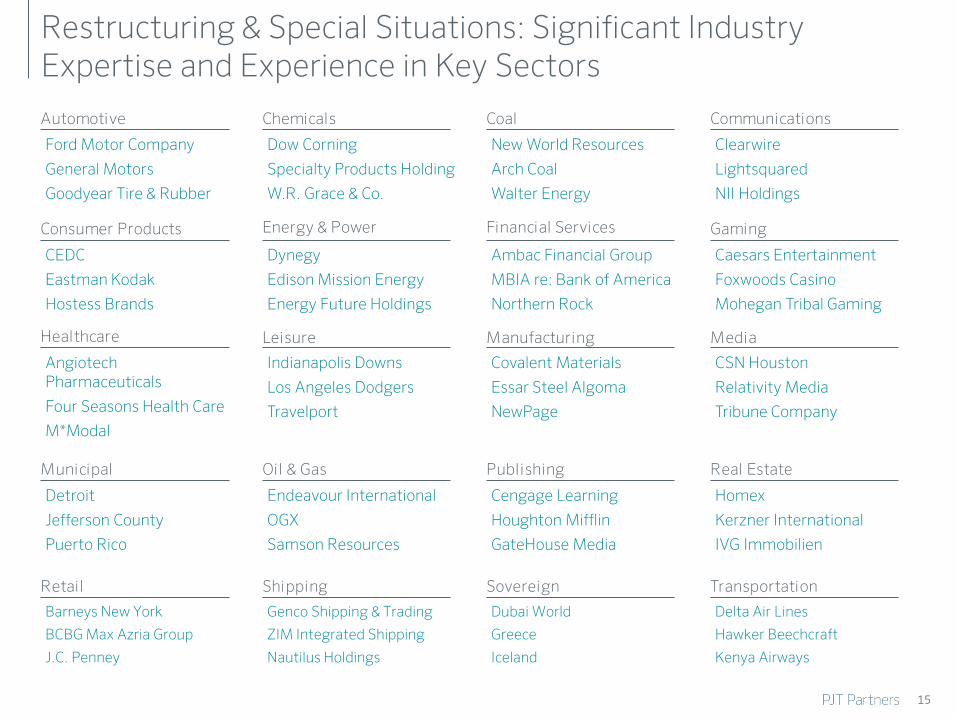
Restructuring & Special Situations: Significant Industry Expertise and Experience in Key Sectors
Gaming
Chemicals Coal Communications
Consumer Products Energy & Power Financial Services
Healthcare Leisure Manufacturing Media
Municipal Oil & Gas Publishing Real Estate
Retail Shipping Sovereign Transportation
Clearwire
Lightsquared
NII Holdings
Angiotech Pharmaceuticals
Four Seasons Health Care
M*Modal
Indianapolis Downs
Los Angeles Dodgers
Travelport
Covalent Materials
Essar Steel Algoma
NewPage
CSN Houston
Relativity Media
Tribune Company
Detroit
Jefferson County
Puerto Rico
Endeavour International
OGX
Samson Resources
Homex
Kerzner International
IVG Immobilien
Barneys New York
BCBG Max Azria Group
J.C. Penney
Genco Shipping & Trading
ZIM Integrated Shipping
Nautilus Holdings
Dubai World
Greece
Iceland
Delta Air Lines
Hawker Beechcraft
Kenya Airways
Ford Motor Company
General Motors
Goodyear Tire & Rubber
Automotive
16
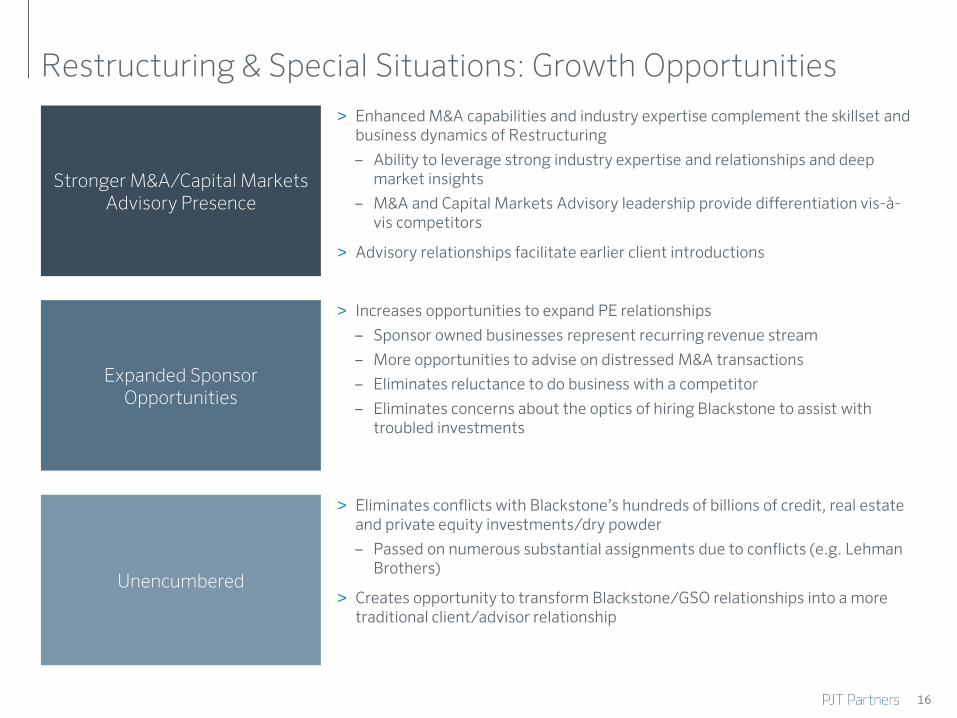
Restructuring & Special Situations: Growth Opportunities
Stronger M&A/Capital Markets Advisory Presence
> Enhanced M&A capabilities and industry expertise complement the skillset and business dynamics of Restructuring
‒ Ability to leverage strong industry expertise and relationships and deep market insights
‒ M&A and Capital Markets Advisory leadership provide differentiation vis-à-vis competitors
> Advisory relationships facilitate earlier client introductions
Expanded Sponsor Opportunities
> Increases opportunities to expand PE relationships
‒ Sponsor owned businesses represent recurring revenue stream
‒ More opportunities to advise on distressed M&A transactions
‒ Eliminates reluctance to do business with a competitor
‒ Eliminates concerns about the optics of hiring Blackstone to assist with troubled investments
Unencumbered
> Eliminates conflicts with Blackstone’s hundreds of billions of credit, real estate and private equity investments/dry powder
‒ Passed on numerous substantial assignments due to conflicts (e.g. Lehman Brothers)
> Creates opportunity to transform Blackstone/GSO relationships into a more traditional client/advisor relationship
Strategic Advisory: Transition and Transform
> Historically the most constrained of the three businesses
‒ Most significant growth opportunities
> Exceeded expectations in ability to attract senior talent
‒ 13 new advisory partners added…and counting
> 20% more advisory partners today than at time of spin/merge announcement
> Continued build-out of advisory team
‒ Focus on talent not organization chart
17
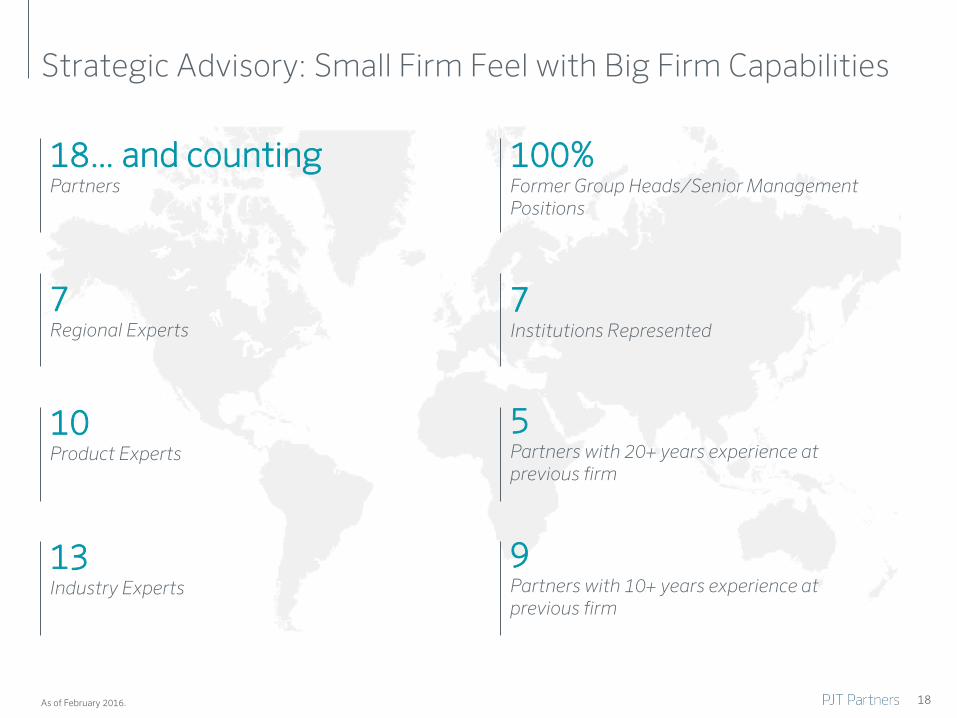
Strategic Advisory: Small Firm Feel with Big Firm Capabilities
As of February 2016. 18
10 Product Experts
5 Partners with 20+ years experience at previous firm
7 Regional Experts
7 Institutions Represented
13 Industry Experts
9 Partners with 10+ years experience at previous firm
18… and counting Partners
100% Former Group Heads/Senior Management Positions
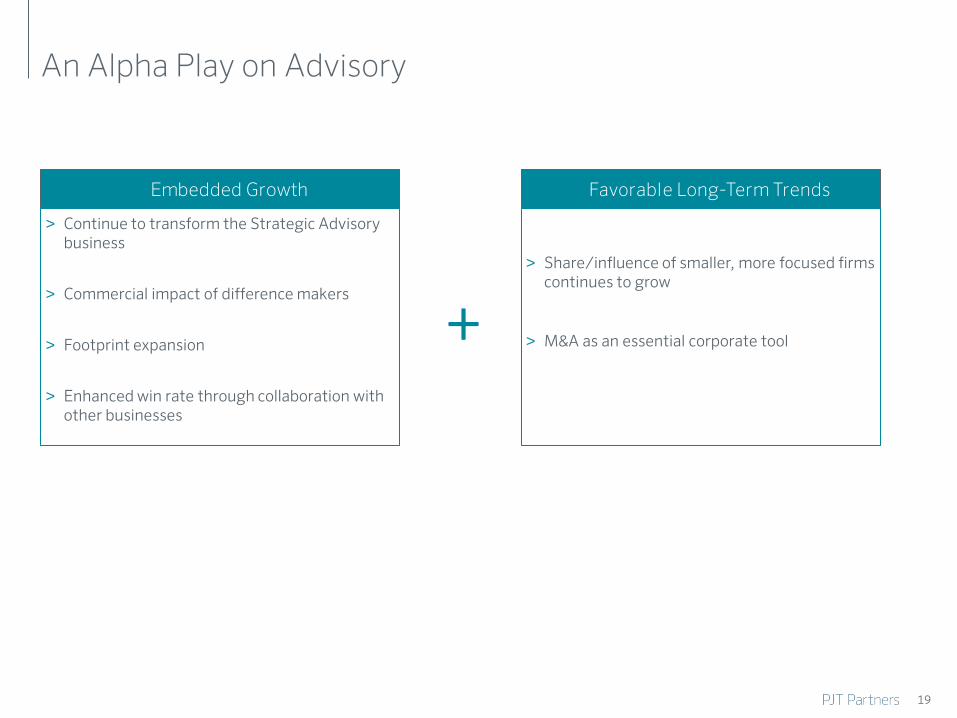
An Alpha Play on Advisory
> Continue to transform the Strategic Advisory business
> Commercial impact of difference makers
> Footprint expansion
> Enhanced win rate through collaboration with other businesses
> Share/influence of smaller, more focused firms continues to grow
> M&A as an essential corporate tool
MACRO
Embedded Growth Favorable Long-Term Trends
+
19
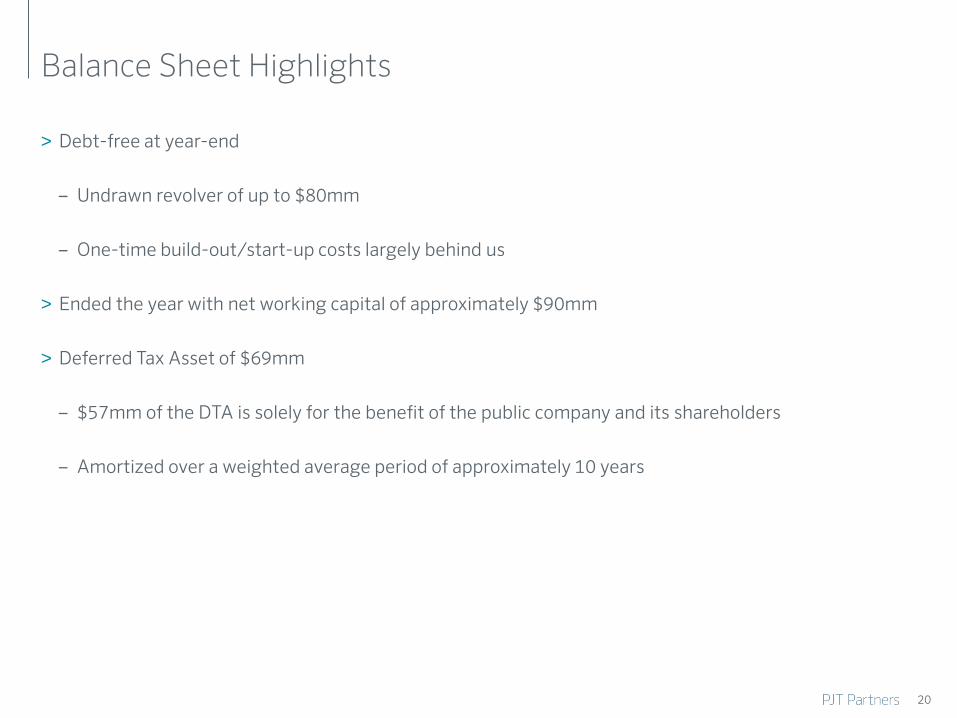
Balance Sheet Highlights
> Debt-free at year-end
‒ Undrawn revolver of up to $80mm
‒ One-time build-out/start-up costs largely behind us
> Ended the year with net working capital of approximately $90mm
> Deferred Tax Asset of $69mm
‒ $57mm of the DTA is solely for the benefit of the public company and its shareholders
‒ Amortized over a weighted average period of approximately 10 years
20
21
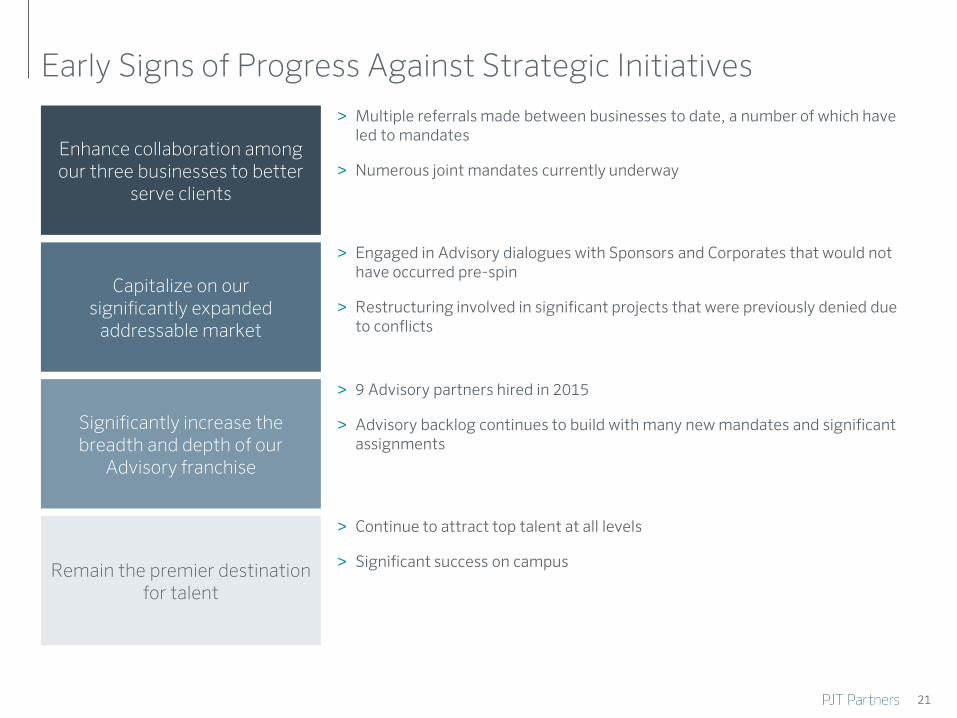
Early Signs of Progress Against Strategic Initiatives
Enhance collaboration among our three businesses to better
serve clients
> Multiple referrals made between businesses to date, a number of which have led to mandates
> Numerous joint mandates currently underway
Capitalize on our significantly expanded
addressable market
> Engaged in Advisory dialogues with Sponsors and Corporates that would not have occurred pre-spin
> Restructuring involved in significant projects that were previously denied due to conflicts
Significantly increase the breadth and depth of our
Advisory franchise
> 9 Advisory partners hired in 2015
> Advisory backlog continues to build with many new mandates and significant assignments
Remain the premier destination for talent
> Continue to attract top talent at all levels
> Significant success on campus
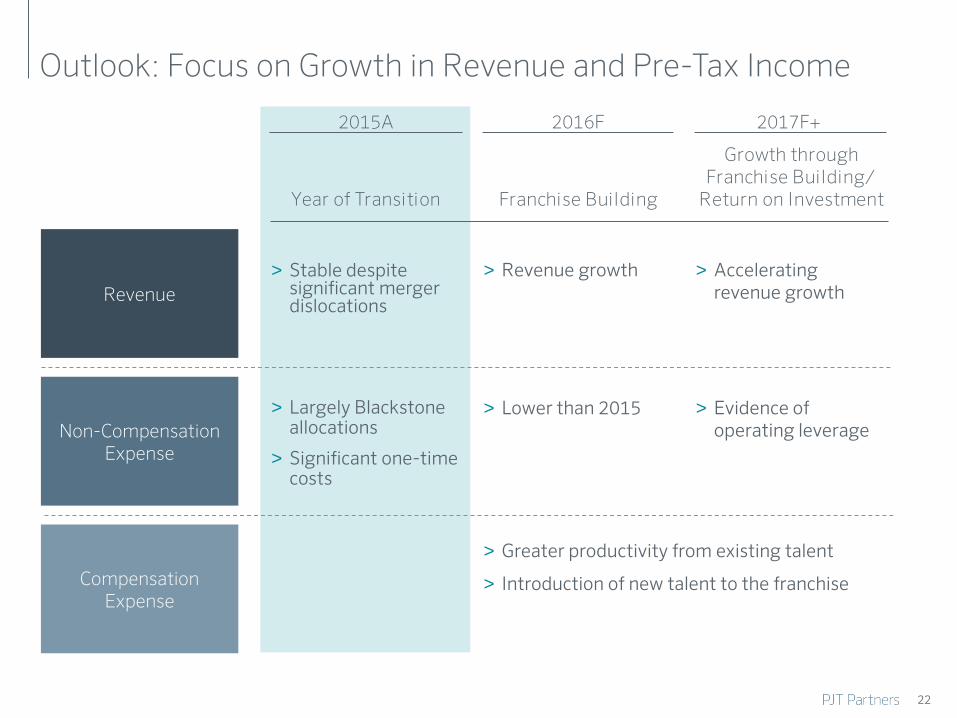
> Stable despite significant merger dislocations
> Largely Blackstone allocations
> Significant one-time costs
Outlook: Focus on Growth in Revenue and Pre-Tax Income
> Revenue growth
> Lower than 2015
> Greater productivity from existing talent
> Introduction of new talent to the franchise
> Accelerating revenue growth
> Evidence of operating leverage
2015A 2016F 2017F+
Year of Transition
Franchise Building
Growth through Franchise Building/
Return on Investment
22
Revenue
Non-Compensation Expense
Compensation Expense
23
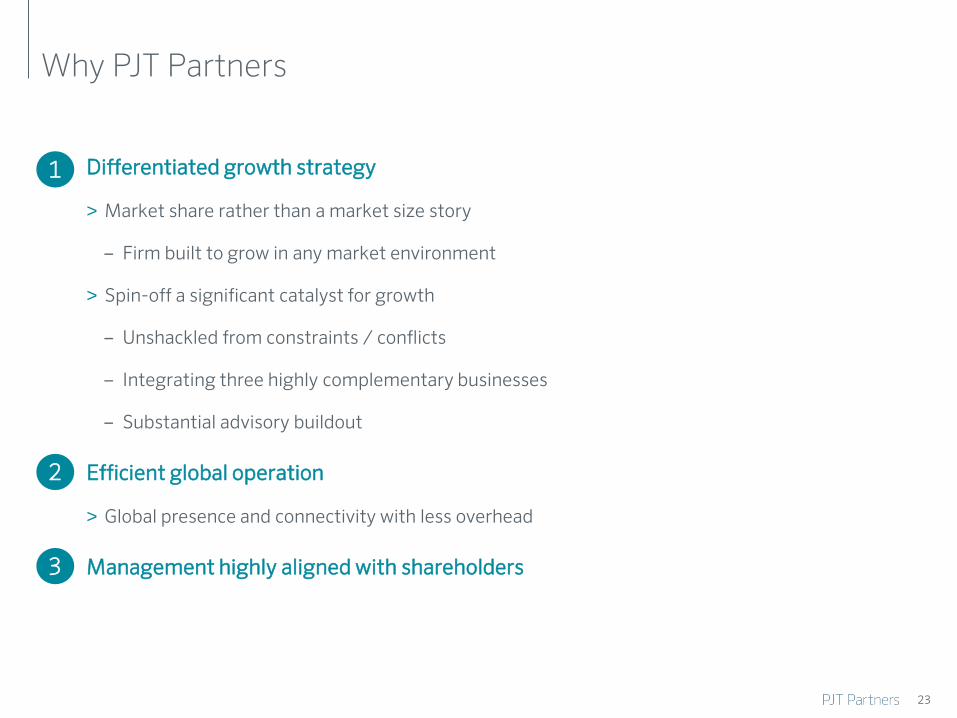
Why PJT Partners
Differentiated growth strategy
> Market share rather than a market size story
‒ Firm built to grow in any market environment
> Spin-off a significant catalyst for growth
‒ Unshackled from constraints / conflicts
‒ Integrating three highly complementary businesses
‒ Substantial advisory buildout
Efficient global operation
> Global presence and connectivity with less overhead
Management highly aligned with shareholders
1
2
3

Your Results Are Our Reputation
24

Financials
25
26
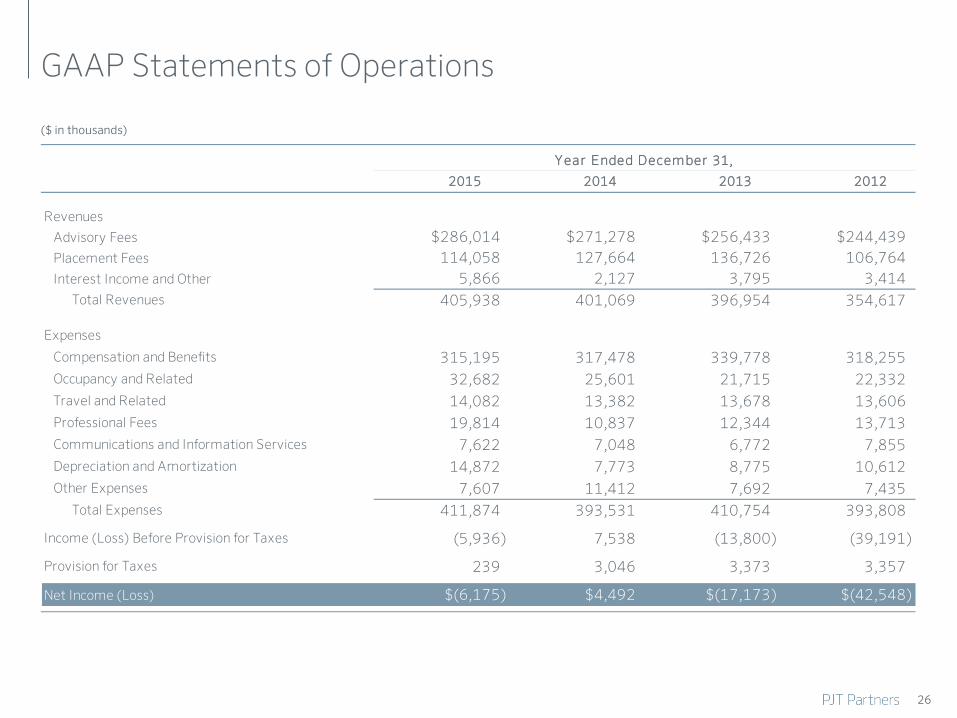
GAAP Statements of Operations
($ in thousands)
Year Ended Decem ber 31,
2015 2014 2013 2012
Revenues
Advisory Fees $286,014 $271,278 $256,433 $244,439Placement Fees 114,058 127,664 136,726 106,764Interest Income and Other 5,866 2,127 3,795 3,414
Total Revenues 405,938 401,069 396,954 354,617
Expenses
Compensation and Benefits 315,195 317,478 339,778 318,255Occupancy and Related 32,682 25,601 21,715 22,332Travel and Related 14,082 13,382 13,678 13,606Professional Fees 19,814 10,837 12,344 13,713Communications and Information Services 7,622 7,048 6,772 7,855Depreciation and Amortization 14,872 7,773 8,775 10,612Other Expenses 7,607 11,412 7,692 7,435
Total Expenses 411,874 393,531 410,754 393,808
Income (Loss) Before Provision for Taxes (5,936) 7,538 (13,800) (39,191)
Provision for Taxes 239 3,046 3,373 3,357
Net Income (Loss) $(6,175) $4,492 $(17,173) $(42,548)
27
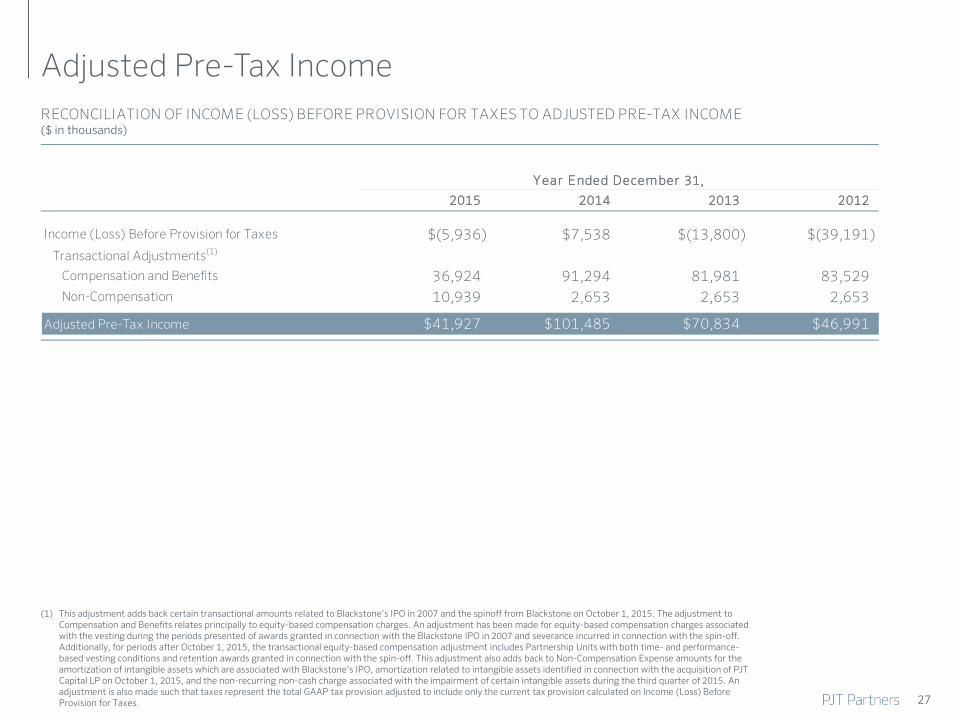
Adjusted Pre-Tax Income RECONCILIATION OF INCOME (LOSS) BEFORE PROVISION FOR TAXES TO ADJUSTED PRE-TAX INCOME ($ in thousands)
(1) This adjustment adds back certain transactional amounts related to Blackstone’s IPO in 2007 and the spinoff from Blackstone on October 1, 2015. The adjustment to Compensation and Benefits relates principally to equity-based compensation charges. An adjustment has been made for equity-based compensation charges associated with the vesting during the periods presented of awards granted in connection with the Blackstone IPO in 2007 and severance incurred in connection with the spin-off. Additionally, for periods after October 1, 2015, the transactional equity-based compensation adjustment includes Partnership Units with both time- and performance-based vesting conditions and retention awards granted in connection with the spin-off. This adjustment also adds back to Non-Compensation Expense amounts for the amortization of intangible assets which are associated with Blackstone’s IPO, amortization related to intangible assets identified in connection with the acquisition of PJT Capital LP on October 1, 2015, and the non-recurring non-cash charge associated with the impairment of certain intangible assets during the third quarter of 2015. An adjustment is also made such that taxes represent the total GAAP tax provision adjusted to include only the current tax provision calculated on Income (Loss) Before Provision for Taxes.
Year Ended Decem ber 31,
2015 2014 2013 2012
Income (Loss) Before Provision for Taxes $(5,936) $7,538 $(13,800) $(39,191)Transactional Adjustments(1)
Compensation and Benefits 36,924 91,294 81,981 83,529Non-Compensation 10,939 2,653 2,653 2,653
Adjusted Pre-Tax Income $41,927 $101,485 $70,834 $46,991
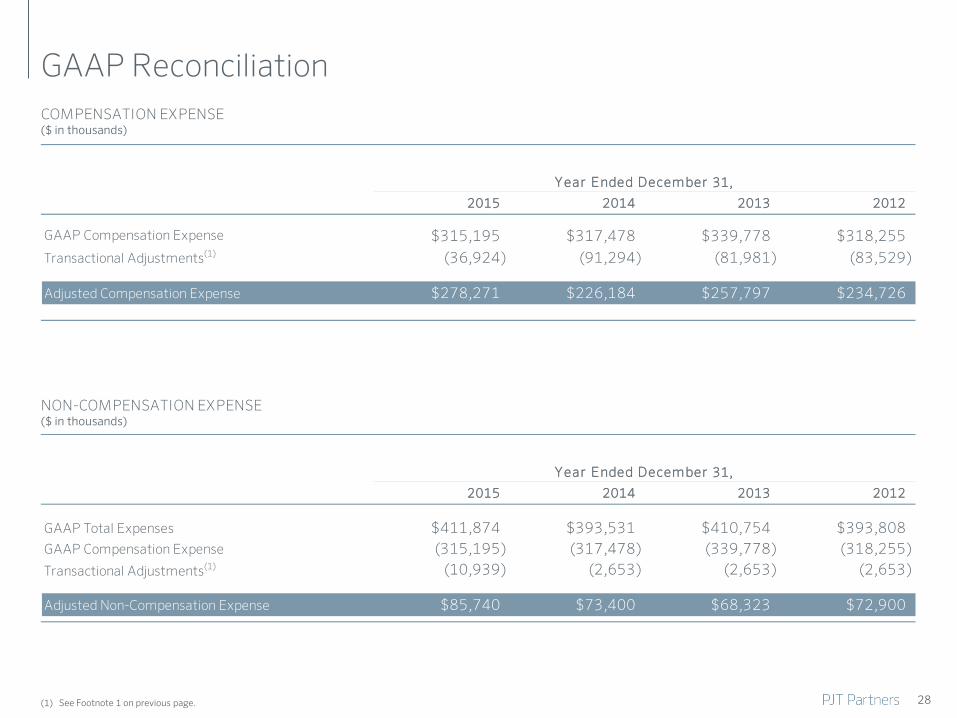
NON-COMPENSATION EXPENSE ($ in thousands)
COMPENSATION EXPENSE ($ in thousands)
GAAP Reconciliation
(1) See Footnote 1 on previous page. 28
Year Ended Decem ber 31,
2015 2014 2013 2012
GAAP Compensation Expense $315,195 $317,478 $339,778 $318,255Transactional Adjustments(1) (36,924) (91,294) (81,981) (83,529)
Adjusted Compensation Expense $278,271 $226,184 $257,797 $234,726
Year Ended Decem ber 31,
2015 2014 2013 2012
GAAP Total Expenses $411,874 $393,531 $410,754 $393,808GAAP Compensation Expense (315,195) (317,478) (339,778) (318,255)Transactional Adjustments(1) (10,939) (2,653) (2,653) (2,653)
Adjusted Non-Compensation Expense $85,740 $73,400 $68,323 $72,900
29
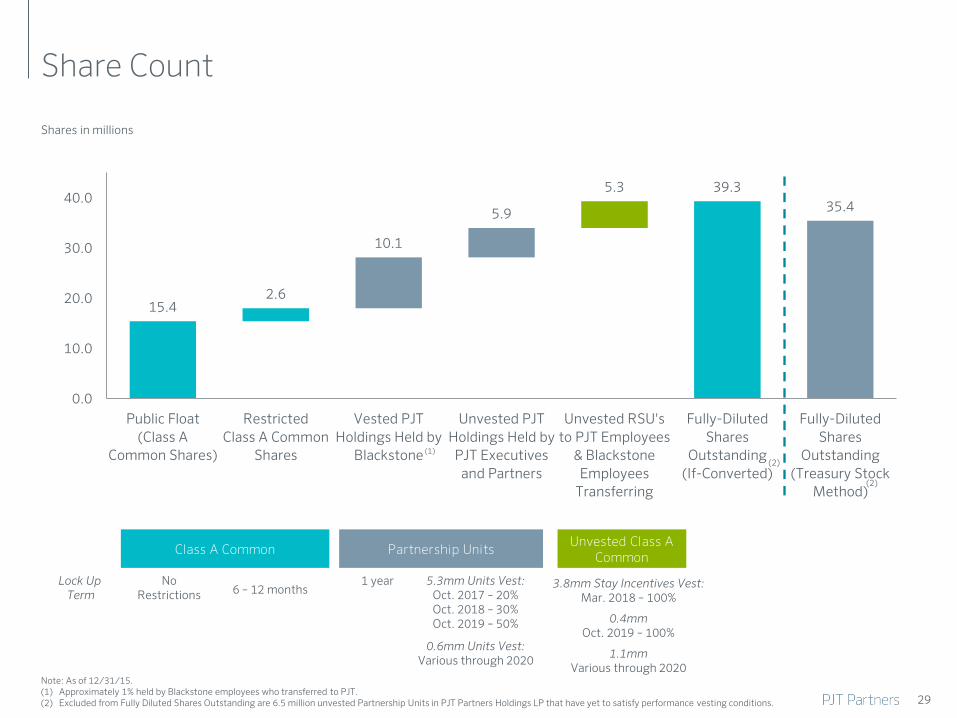
Share Count
Shares in millions
15.42.6
10.1
5.9
5.3 39.335.4
0.0
10.0
20.0
30.0
40.0
Public Float(Class A
Common Shares)
RestrictedClass A Common
Shares
Vested PJTHoldings Held by
Blackstone
Unvested PJTHoldings Held by
PJT Executivesand Partners
Unvested RSU'sto PJT Employees
& BlackstoneEmployees
Transferring
Fully-DilutedShares
Outstanding(If-Converted)
Fully-DilutedShares
Outstanding(Treasury Stock
Method)
Note: As of 12/31/15. (1) Approximately 1% held by Blackstone employees who transferred to PJT. (2) Excluded from Fully Diluted Shares Outstanding are 6.5 million unvested Partnership Units in PJT Partners Holdings LP that have yet to satisfy performance vesting conditions.
6 – 12 months 1 year 5.3mm Units Vest:
Oct. 2017 – 20% Oct. 2018 – 30% Oct. 2019 – 50%
0.6mm Units Vest: Various through 2020
3.8mm Stay Incentives Vest: Mar. 2018 – 100%
0.4mm Oct. 2019 – 100%
1.1mm Various through 2020
Lock Up Term
No Restrictions
Class A Common Partnership Units Unvested Class A
Common
(1)
(2)
(2)