Investor Presentation -...
34
Care.com 2016 | Proprietary Information Page 1 Investor Presentation NOVEMBER 2016
-
Upload
duongquynh -
Category
Documents
-
view
216 -
download
3
Transcript of Investor Presentation -...

Care.com 2016 | Proprietary Information Page 1
Investor PresentationNOVEMBER 2016

Care.com 2016 | Proprietary Information Page 2
This supplemental information contains "forward-looking statements" within the meaningof the "safe harbor" provisions of the Private Securities Litigation Reform Act of 1995,including but not limited to, the Company’s financial guidance for the fourth quarter of2016 and full year 2016. These forward-looking statements are made as of the date theywere first issued and were based on current expectations, estimates, forecasts andprojections as well as the beliefs and assumptions of management. The Company's actualresults could differ materially from those stated or implied in forward-looking statements.The Company undertakes no intention or obligation to update or revise any forward-looking statements, whether as a result of new information, future events orotherwise. These forward-looking statements should not be relied upon as representingthe Company's views as of any date subsequent to November 1, 2016.
CAUTIONARY LANGUAGE CONCERNING FORWARD-LOOKING STATEMENTS

Care.com 2016 | Proprietary Information Page 3
Sheila Lirio MarceloFOUNDER, CHAIRWOMAN & CEO
Care.com 2015 | Proprietary & ConfidentialCare.com 2016 | Proprietary Information Page 3

Care.com 2016 | Proprietary Information Page 4
Travel Services
Home Services
Education
Financial Services
Automotive
Entertainment
CareCare for family members - the most important decision in people’s lives
Care.com 2016 | Proprietary Information

Care.com 2016 | Proprietary Information Page 5
Heal
th
Utili
ties
Food
Tran
spor
tatio
n
Col
lege
Tui
tion
Hous
ing
Child
care
$3K$4K
$6K
$8K$9K
$17K$18K
Care is a Top Budgetary Item for Families
Source: Child Care Aware of America 2013 Report "Parents and the High Cost of Child Care". Based on unweighted averages across regions.Childcare costs are based on 2012 costs for an infant and 4-year old in full-time care in a center.

Care.com 2016 | Proprietary Information Page 6
Our Mission
IN-HOME CAREGIVERS CARING COMPANIES
Families

Care.com 2016 | Proprietary Information Page 7
Company Overview
Profitable growth
Market
Leader
Model
Network Effects
Long Runway
Financials
Massive fragmented market
Disruptive online marketplace
Powerful economic model
Strong NPS and Word of Mouth
Multiple growth opportunities

Care.com 2016 | Proprietary Information Page 8
Enormous, fragmented
market44 MM Target
U.S. HHs
4% US Matching Penetration
WE’RE EARLY
$280 B spend on care in U.S.
$8-10B total addressable spending US Matching & Payments
$8-10B Total Addressable market assumes a 3.0 - 3.5% take-rate on $280 B spend on care. Source: U.S. Census on HH data, IBIS 2014 on annual spending, Care.com Internal Data as of December 2015 of families paying to date

Care.com 2016 | Proprietary Information Page 9
Disruptive Solution To A Huge Problem
Accessible &Affordable
Agencies Expensive, limited selection
Online ClassifiedsLack of trust and quality
NewspapersNo search or scale
Trust &Quality
Scale &Breadth
Referrals from friendsReluctance to share favorite caregivers; trust and quality anecdotal
CommunityRecommendations
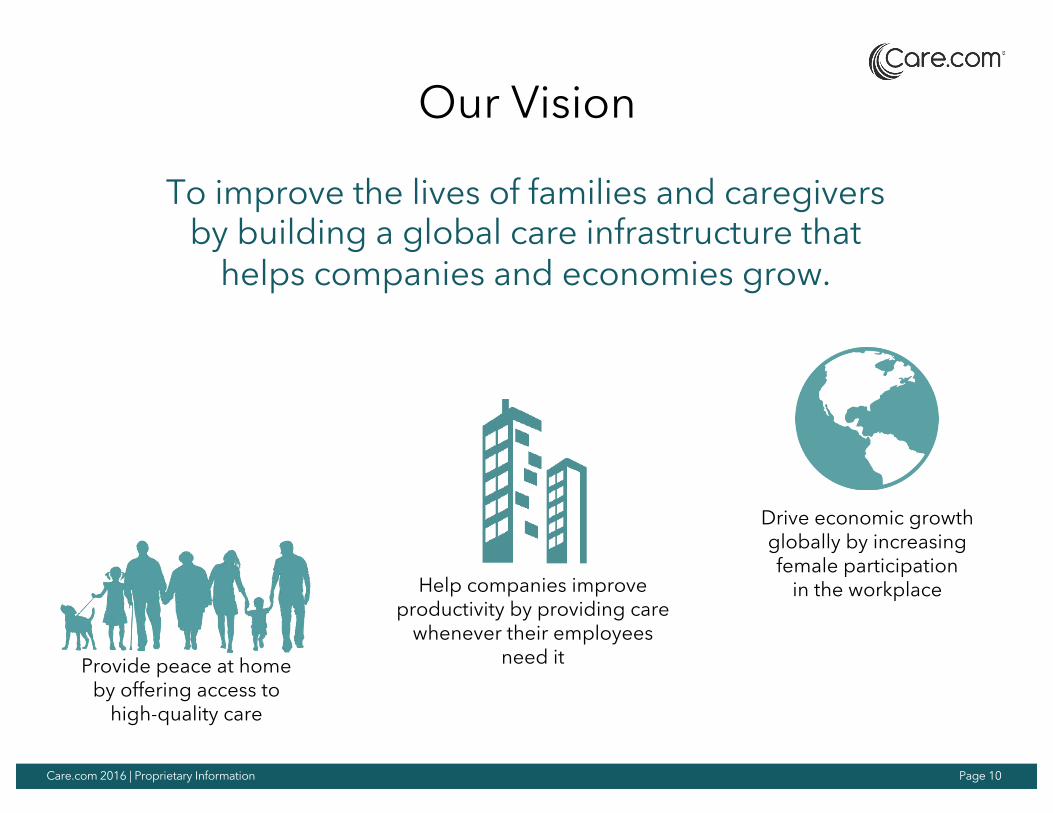
Care.com 2016 | Proprietary Information Page 10
Provide peace at home by offering access to
high-quality care
Help companies improve productivity by providing care
whenever their employees need it
Drive economic growth globally by increasing female participation
in the workplace
To improve the lives of families and caregivers by building a global care infrastructure that
helps companies and economies grow.
Our Vision

Care.com 2016 | Proprietary Information Page 11
How We Think About Our Business
International: 19 Countries
B to C: Families and Caregivers
B to B: Care service companies, Employers

Care.com 2016 | Proprietary Information Page 12
Largest Care Marketplace PlatformPOWERFUL NETWORK EFFECTS
Source: Care.com internal data as of September 2016

Care.com 2016 | Proprietary Information Page 13
Breadth Of Coverage
Caregiver Density
89% Coverage of U.S. ZIP Codes
5000+ Caregivers w/in 10 miles of 95% of ZIP codes of top 20 metro areas
8.1M U.S. Caregivers
Source: Care.com internal data as of September 2016
1,000+ 500 – 1,000 250 – 500 100 – 250 1 - 100

Care.com 2016 | Proprietary Information Page 14
Affordable For Mass Market
*Based on median income by ZIP code and Care.com internal data
**Care.com internal data from January – December 2015
63%Dual-income or
single parent HH
59%Seek part-time
care**
20%<$50K HH Income*
Avg. Agency Fees per Placement
Avg. Care.com Fees per Year
$3,000 - $4,000
$200

Care.com 2016 | Proprietary Information Page 15
• Basic caregiver screening
• Third-party background check options
• Member reviews and references
• Social verification options
• Ongoing monitoringBackground Check Options✓ Social Security Verification✓ Criminal Records Check✓ Sex Offender Registry✓ Motor Vehicle Records Check
Investment In Trust & Quality

Care.com 2016 | Proprietary Information Page 16
Mobile: Access and Convenience
5.8M Average unique mobile visitors per month in Q3’16
70% Of all unique visitors to Care.com on mobile platforms Q3’16
Source: Care.com internal data as of September 2016; US only *As of October 2016
3rd Top Grossing App in Lifestyle Category on iPhone App Store*

Care.com 2016 | Proprietary Information Page 17
Nanny Premium,Mobile client experience
CONVENIENCE PAYMENTS FULL PAYROLL & TAX SERVICE
Supports Bookings, Date Night App, Pet Care App and other
transactional use cases
Full Suite of Payments Products

Care.com 2016 | Proprietary Information Page 18
High Member Satisfaction
match rate
satisfied with their caregiver
85%78%
Source: Care.com survey results from January – December 2015. Methodology will evolve with business model and data capture capability.

Care.com 2016 | Proprietary Information Page 19
3% 10%
87%
Detractors Passives Promoters
9%
28%
63%
Detractors Passives Promoters
High Net Promoter Score
NPS 54%
Likely to recommend service to a friend?
Based on 483K customer survey responses from members who found care through Care.com
Based on 2010-2015 customer satisfaction survey data
NPS 84%
CONSUMER MATCHING CONSUMER PAYMENTS
US customers only

Care.com 2016 | Proprietary Information Page 20
77%
70% 67%
71%
62%
50%
9% 9% 12%
21%
13%
39%
Care.com is the Leading and Preferred Online Service for Care
Part-time Child Care
Full-timeChild Care
Senior Care HouseKeeping
Pet Care Tutoring
Source: Simon-Kucher analysis of Care.com offline seeker research survey 2015. (n= 1,555) Analysis of Q26 BYO “Who would you like to provide the ideal package that you created?” Assumes package & price are the same.
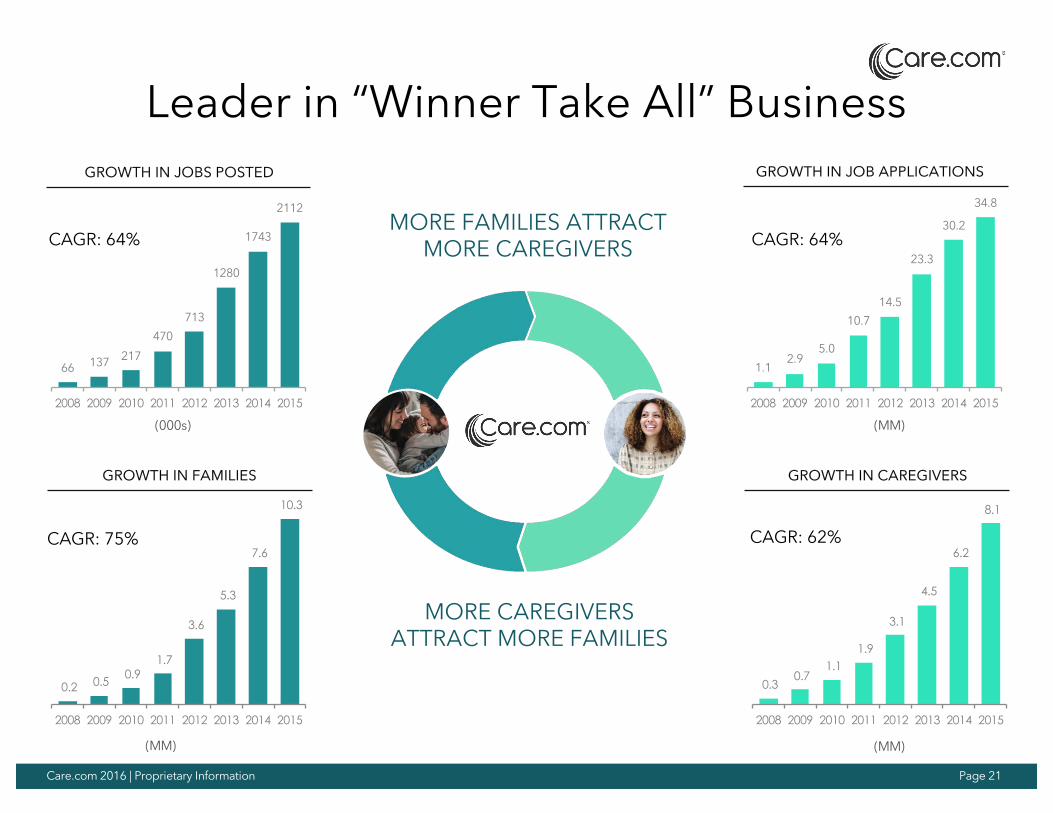
Care.com 2016 | Proprietary Information Page 21
66 137 217
470
713
1280
1743
2112
2008 2009 2010 2011 2012 2013 2014 2015
0.2 0.5 0.9 1.7
3.6
5.3
7.6
10.3
2008 2009 2010 2011 2012 2013 2014 2015
CAGR: 75%
(000s)
GROWTH IN JOBS POSTED
GROWTH IN FAMILIES
(MM)
GROWTH IN JOB APPLICATIONS
GROWTH IN CAREGIVERS
(MM)
Leader in “Winner Take All” Business
CAGR: 64% CAGR: 64%MORE FAMILIES ATTRACT
MORE CAREGIVERS
MORE CAREGIVERSATTRACT MORE FAMILIES
1.12.9
5.0
10.7
14.5
23.3
30.2
34.8
2008 2009 2010 2011 2012 2013 2014 2015
0.3 0.7
1.1 1.9
3.1
4.5
6.2
8.1
2008 2009 2010 2011 2012 2013 2014 2015
CAGR: 62%
(MM)

Care.com 2016 | Proprietary Information Page 22
Our 2016 Top Product Priorities
1. Pre-Match: Care.com Community
2. Match: Merchandising & Mobile Transactional
3. Post-Match: Care.com Benefits and Other Services
4. Care@Work: Enterprise Mobile & Ramping Sales

Care.com 2016 | Proprietary Information Page 23
PRE-MATCHCare.com Community Platform
CARE SMARTS BIG TENT KINSIGHTS
Community-driven question & answer
platform
Parenting group management platform
Community powered by data insights
CARE.COMMUNITY - Unified Community PlatformTraffic from Care Smarts & Big Tent, Powered by Kinsights Technology
• Significant traffic growth
• Low-intent users
• Minimal traffic growth• Solid conversion rates• Strong engagement
• Solid engagement• Leverage data science
and personalization for monetization

Care.com 2016 | Proprietary Information Page 24
MATCH: Merchandising and Mobile
CHILDCAREBabysitter & NannyPre-schoolsDaycareLessons / ActivitiesCampsTutors
SENIOR CARECompanionsHome CareAssisted LivingTransportation
PETCAREDog WalkersBoardingGroomingTraining
HOMEHousekeepersErrandsChefs
SUBSCRIPTION MODEL
Offer breadth and depth in all verticals
Targeted products with varied pricing models
Provide free value to drive organic growth
Care.com Community
Current pay for success matching product for high involvement products and services
MOBILE TRANSACTION
New business models for recurring needs
• Date Night with complete end to end planning and booking
• After-school care including transportation and part-time care
• Full-time Nanny premium with bundled product with HomePay

Care.com 2016 | Proprietary Information Page 25
POST-MATCH: Care.com Benefits and more
ü Long term relationship building withcaregiver with Care.com Benefits
ü Sticky features for transactionalproducts
ü Future expansion of benefits to protectworkforce

Care.com 2016 | Proprietary Information Page 26
26
HIGH-TECH SOLUTIONS. HIGH-TOUCH SERVICE.
Net Promoter Score 2015
Revenue Retention 2015
76%100%+ 61%Revenue Growth
Q3’16 (Y/Y)Backup Care Fulfillment Rate
2015
90%+
Care@Work: Corporate Benefit Program
Sample Clients:
“Care.com is a one-stop shop for families. LinkedIn employees use the service
successfully to address a range of needs”Pat Wadors, VP of Talent
“Care.com’s broad range of services help ensure that eBay employees have access
to quality care”John Donahoe, CEO

Care.com 2016 | Proprietary Information Page 27
Key Financial Highlights
Strong revenue growth
Leveraging operating expenses and S&M spend
Compelling unit economics
Profitable expectation of sustained profitability

Care.com 2016 | Proprietary Information Page 28
$9$10
$14$16
$18$19
$22$23
$25$26
$30$30$32
$33
$36$38
$39$38
$41
Q1 Q2 Q3 Q4 Q1 Q2 Q3 Q4 Q1 Q2 Q3 Q4 Q1 Q2 Q3 Q4 Q1 Q2 Q3
Strong Revenue Growth
$13
$26
$48
$81
$111
$139
2010 2011 2012 2013 2014 2015
2012
Total Company Revenue ($MM)
2013 2014 2015 2016
Care.com 2016 | Proprietary Information Page 29
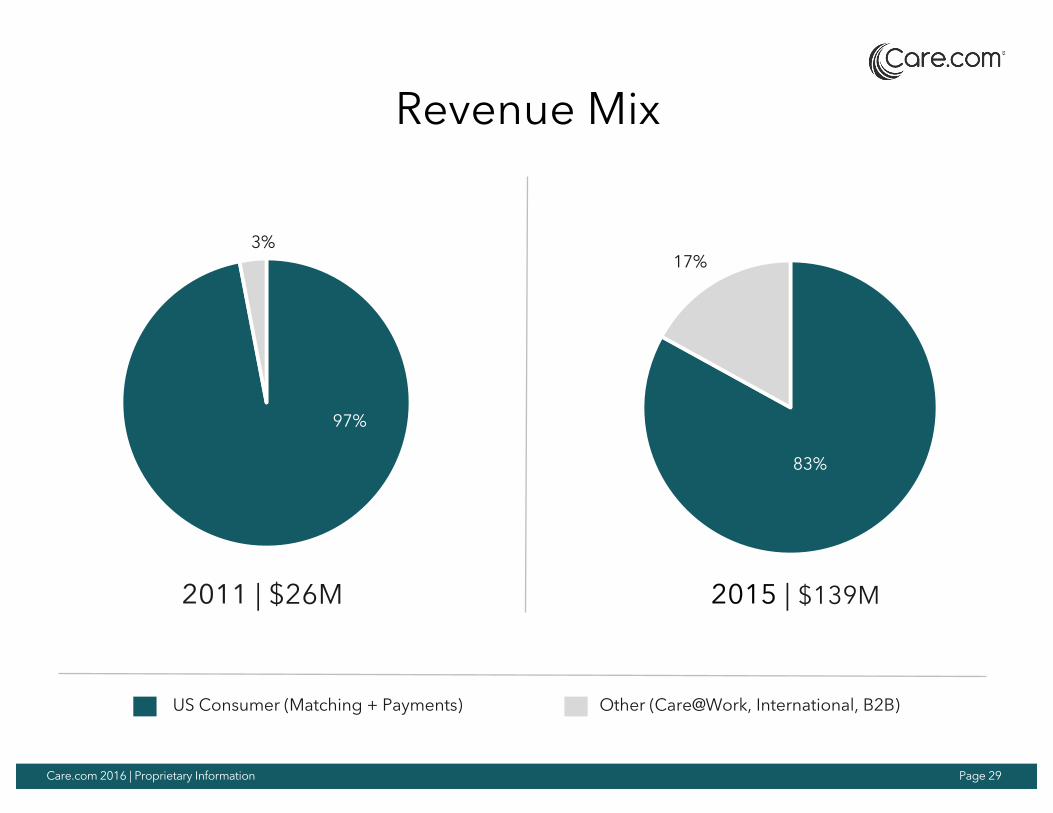
83%
17%
Consumer Matching Other
97%
3%
Revenue Mix
2011 | $26M 2015 | $139M
82%12%
US Consumer (Matching + Payments) Other (Care@Work, International, B2B)

Care.com 2016 | Proprietary Information Page 30
Powerful Consumer Business ModelUS Consumer (Matching + Payments) – H1’16
$455Lifetime Value
(Gross Profit Basis)$39per month
13.7 months
84% Average Revenue per
User per Month (ARPU)Length of Paid Time
(LOPT)Gross Margin
3.4xROI (given $135 CAC)

Care.com 2016 | Proprietary Information Page 31
Leveraging Sales & Marketing
SALES AND MARKETING ($M)% of Revenue
$25 $30 $39 $35 $39 $35 $38
H1'13 H2'13 H1'14 H2'14 H1'15 H2'15 H1'16
68% 68% 75% 59% 59%
48% 49%
Percent of Revenue Marketing Spend
CUSTOMER ACQUISITION COST (CAC)*
Excludes impact of Citrus Lane *Excludes Re-Users
Y-Y % Growth
$111 $131 $163 $146 $135 $116 $135
H1'13 H2'13 H1'14 H2'14 H1'15 H2'15 H1'16
34%
46%
47%
12%(17%)
(21%)
0%

Care.com 2016 | Proprietary Information Page 32
Operating Expense Leverage
21% 23% 21% 19%
28% 23% 25% 22%
16% 14% 15%
14%
2012 2013 2014 2015
COR G&A R&D($M) |
% REVENUE
65% 61% 61%
55%
Care.com 2016 | Proprietary Information Page 33
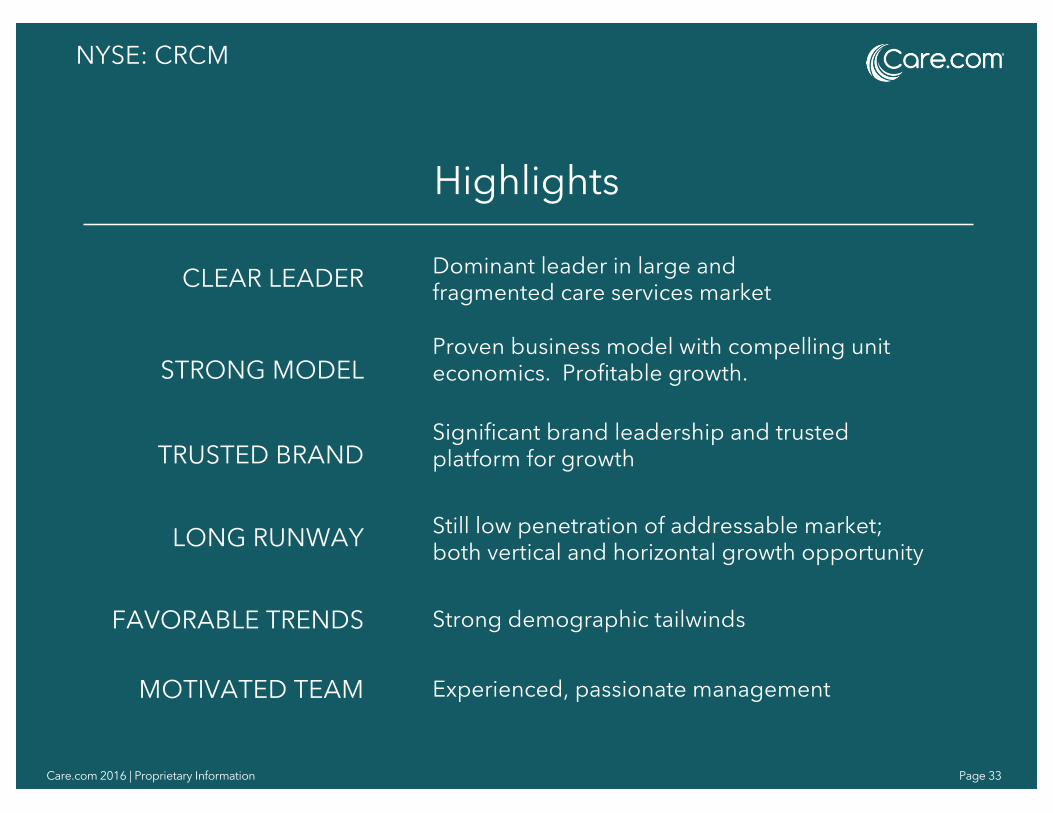
Highlights
Dominant leader in large and fragmented care services market
Proven business model with compelling unit economics. Profitable growth.
NYSE: CRCM
CLEAR LEADER
STRONG MODEL
TRUSTED BRANDSignificant brand leadership and trusted platform for growth
LONG RUNWAY Still low penetration of addressable market; both vertical and horizontal growth opportunity
MOTIVATED TEAM Experienced, passionate management
FAVORABLE TRENDS Strong demographic tailwinds

Thank you