Investor Presentation Q3-FY2020 · 2020-05-25 · defined by IFRS and cannot be formally presented...
24
1 Investor Presentation Q3-FY2020 Frédéric Dugré, CEO & President Marc Blanchet, CFO May 13, 2020
Transcript of Investor Presentation Q3-FY2020 · 2020-05-25 · defined by IFRS and cannot be formally presented...

1
Investor Presentation Q3-FY2020Frédéric Dugré, CEO & President
Marc Blanchet, CFO
May 13, 2020

Forward Looking Statement
• Certain statements set forth in this presentation regarding the operations and activities of H2O Innovation as well as other communications by the
Corporation to the public that describe more generally management objectives, projections, estimates, expectations or forecasts may constitute
forward-looking statements within the meaning of securities legislation. Forward-looking statements concern analysis and other information based
on forecast future results and the estimate of amounts that cannot yet be determined. Forward-looking statements include the use of the words
such as “anticipate”, “if”, “believe”, “continue”, “could”, “estimate”, “expect”, “intend”, “may”, “plan”, “potential”, “predict”, “project”, “should” or “will”
and other similar terms as well as those usually used in the future and the conditional, notably regarding certain assumptions as to the success of a
venture. Those forward-looking statements involve a number of risks and uncertainties, which may result in actual and future results of the
Corporation to be materially different than those indicated. Information about the risk factors to which the Corporation is exposed is provided in the
Annual Information Form dated September 24, 2019 available on SEDAR (www.sedar.com). Unless required to do so pursuant to applicable
securities legislation, H2O Innovation assumes no obligation to update or revise forward-looking statements contained in this MD&A or in other
communications as a result of new information, future events and other changes.
• Cautionary Note Regarding United States Securities Laws
This presentation does not constitute an offer to sell or the solicitation of an offer to buy, nor shall there be any sale of the securities in any
jurisdiction in which such offer, solicitation or sale would be unlawful prior to registration or qualification under the securities laws of such
jurisdiction. The securities of H20 Innovation have not been and will not be registered under the United States Securities Act of 1933, as amended
(the "U.S. Securities Act"), or any state securities laws and may not be offered or sold within the United States or to, or for the account or benefit of,
"U.S. persons," as such term is defined in Regulation S under the U.S. Securities Act, unless an exemption from such registration is available.
2

Non-IFRS Financial Measurement• In this presentation, the Corporation’s management uses measurements that are not in accordance with IFRS. The measurements “Adjusted earnings before
interest, tax, depreciation and amortization (adjusted EBITDA)”, “Net debt”, “Recurring revenue” and “Earnings before administrative expenses” are not
defined by IFRS and cannot be formally presented in consolidated financial statements. These non-IFRS measures are presented as additional information
and should be used in conjunction with the IFRS financial measurements presented in this report.
• EBITDA means earnings before finance costs – net, income taxes, depreciation and amortization. The definition of adjusted EBITDA excludes expenses
otherwise considered in net earnings (loss) according to Generally Accepted Accounting Principles (“GAAP”), namely the unrealized exchange (gains) losses,
the change in fair value of contingent consideration and the stock-based compensation costs. These items are non-cash items and do not have an impact
on the operating and financial performance of the Corporation. Management has also elected to exclude the acquisition costs, integration costs and other
costs, as they are not directly linked to the operations. The reader can establish the link between adjusted EBITDA and net loss based on the reconciliation
presented below. The definition of adjusted EBITDA used by the Corporation may differ from those used by other companies. Even though adjusted EBITDA
is a non-IFRS measure, it is used by management to make operational and strategic decisions. Providing this information to the stakeholders, in addition to
the GAAP measures, allows them to see the Corporation’s results through the eyes of management, and to better understand the financial performance,
notwithstanding the impact of GAAP measures.
• The definition of net debt consists of bank loans and long-term debt less cash. The definition of net debt used by the Corporation may differ from those
used by other companies.
• Recurring revenue by nature is a non-IFRS measure and is defined by the management as the portion of the Corporation's revenue coming from customers
with whom the Corporation has established a long-term relationship and/or has a recurring sales pattern. Corporation’s recurring revenues are coming from
the following business lines: Aftermarket, Specialty Products and O&M.
• The definition of Earnings before administrative expenses (‘’EBAC’’) means the gross profit before operating costs, depreciation and amortization reduced
by the operating and selling expenses. EBAC is a non-IFRS measure and it is used by management to make operational and strategic decisions.
• Earnings (loss) before impairment is defined as the net earnings (loss) before the impairment charges taken following the impairment test performed during
the third quarter of fiscal year 2020. This non-IFRS measure is used by management to evaluate the results of the Corporation before this non-recurring
item.
3

Business HighlightsQ3-FY2020
• Revenue growth of 11.6 % reaching $36.1:
➢ Specialty Products presented impressive growth of 60% boosted by Genesys’ acquisition and by the sustained organic growth of Piedmont, PWT and Maple Equipment business lines.
• Genesys business line is delivering according to plan:
➢ Genesys integration plan is moving along – 60% completion;
➢ Captured first cost and sales synergies for an amount of ≈$200k.
4

Business HighlightsQ3-FY2020
• O&M business pillar showed 7.1 % of organic growth :
➢ Scope expansion on multiple existing contracts;
➢ New MUD customers related to Hays South.
• Gross profit margin increased to 28.7 % compared to 23.3 %, supported by strong Specialty Products sales;
• Adjusted EBITDA reached $3.8 M, or 10.5 % of revenues – an historical record-high performance for a single quarter;
• Earnings reached $1.6 M, before impairment of $5.3 M related to Project & Aftermarket business pillar, a non-cash and non-recurring expense.
5

Evolution of Our Business Model Focused on Recurring Sales and Margin Improvement
Water & Wastewater
Projects, and ServicesSpecialty Products Operation & Maintenance
Key Drivers:
1. Acquisition of Genesys;
2. Sustained growth of Piedmont;
3. Come-back from the Maple
Equipment;
4. Addition of new PWT’s
distributors;
5. Organic growth of O&M;
6. Projects impacted by delays
and cancellation;
7. Combined backlog remains
strong at $136.2 M.
24.8% 60.5% 7.1%

Our Business Facing the COVID-19 CrisisQ3-FY2020
• Water is essential;
• Our business model is resilient and recession-proof with 88.0 % of recurring revenues;
• With pro-active sanitation measures and physical distancing, we have ensured the continuity of all operations since the beginning of the Pandemic:
➢ Only the Projects & Aftermarket business pillar faced a slowdown due to construction sites’ suspension.
• Our cash-flow remains positive and sustained;
• All bank covenants are respected.
7

Continuity of Operations During the Pandemic
• Manufactured specialty products while maintaining physical distancing;
• Crossed a landmark by synthesizing its 3000th batch of dendrimer molecule, which equates to over 34 million kg of ready-for-use antiscalant used globally;
• Processed a record-high number of customers orders in a single month in Cheshire Plant;
8
(Vista, CA) (Cheshire, UK)
• Conducted multiple webinar sales training to many water treatment professionals in the industry.
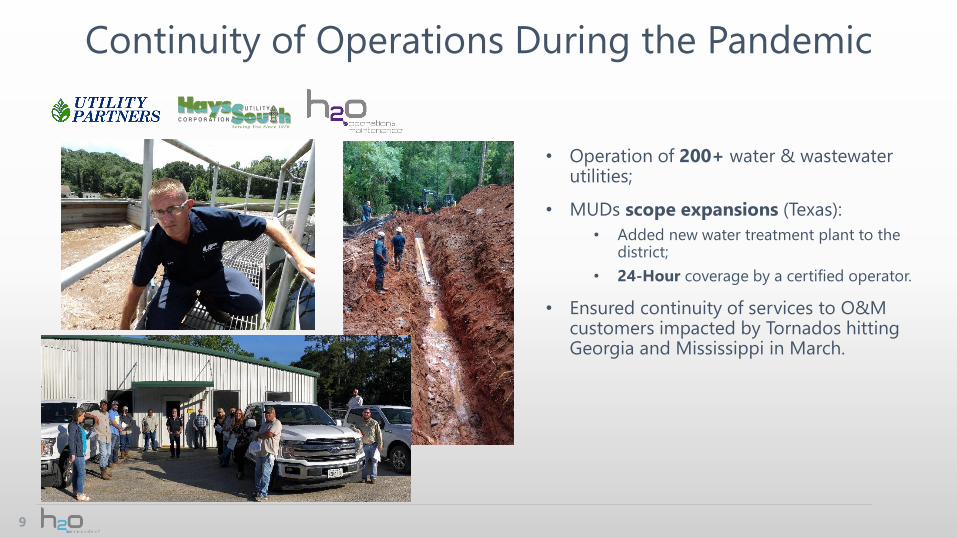
Continuity of Operations During the Pandemic
• Operation of 200+ water & wastewater utilities;
• MUDs scope expansions (Texas):
• Added new water treatment plant to the district;
• 24-Hour coverage by a certified operator.
• Ensured continuity of services to O&M customers impacted by Tornados hitting Georgia and Mississippi in March.
9

49
42
55
76
70
76
80
84
88
FY14 FY15 FY16 FY17 FY18 FY19 FY20 - Q1 FY20 - Q2 FY20 - Q3
Recurring RevenuesAftermarket, Specialty Products and O&M
10
Our business model promotes
and encourages strong
customer retention
translating into high
recurring revenues.

Revenue & Business Mix
Revenue & Adjusted EBITDA In CAD million $
11
• Business mix & Specialty Products
growth are allowing us to improve our
adjusted EBITDA and GPM.
$129.5 M
$-
$2.0
$4.0
$6.0
$8.0
$10.0
$12.0
- $
20.0 $
40.0 $
60.0 $
80.0 $
100.0 $
120.0 $
140.0 $O&M
Specialty Products
Projects & Aftermarket
Adjusted EBITDA
19%
36%
45%
Q3 - FY2020 - Revenues
Projects &Aftermarket
SpecialtyProducts
O&M

TSXV:HEO
Financial Overview Q3-FY2020
12
TSXV:HEO
13
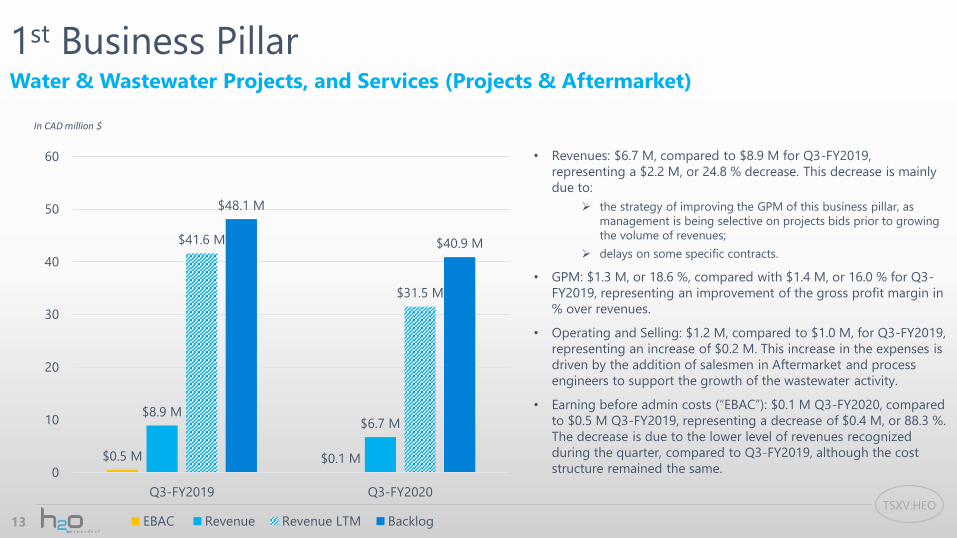
1st Business PillarWater & Wastewater Projects, and Services (Projects & Aftermarket)
• Revenues: $6.7 M, compared to $8.9 M for Q3-FY2019,
representing a $2.2 M, or 24.8 % decrease. This decrease is mainly
due to:
➢ the strategy of improving the GPM of this business pillar, as
management is being selective on projects bids prior to growing
the volume of revenues;
➢ delays on some specific contracts.
• GPM: $1.3 M, or 18.6 %, compared with $1.4 M, or 16.0 % for Q3-
FY2019, representing an improvement of the gross profit margin in
% over revenues.
• Operating and Selling: $1.2 M, compared to $1.0 M, for Q3-FY2019,
representing an increase of $0.2 M. This increase in the expenses is
driven by the addition of salesmen in Aftermarket and process
engineers to support the growth of the wastewater activity.
• Earning before admin costs (“EBAC”): $0.1 M Q3-FY2020, compared
to $0.5 M Q3-FY2019, representing a decrease of $0.4 M, or 88.3 %.
The decrease is due to the lower level of revenues recognized
during the quarter, compared to Q3-FY2019, although the cost
structure remained the same.
In CAD million $
$0.5 M $0.1 M
$8.9 M$6.7 M
$41.6 M
$31.5 M
$48.1 M
$40.9 M
0
10
20
30
40
50
60
Q3-FY2019 Q3-FY2020
EBAC Revenue Revenue LTM Backlog

TSXV:HEO
14
In CAD million $
2nd Business PillarSpecialty Products
• Revenues: $12.9 M, compared to $8.0 M for Q3-FY2019,
representing an increase of $4.9 M, or 60.5 %.➢ Of this $4.9 M revenue increase, $3.1 M is attributable to
the acquisition of Genesys;
➢ This increase in revenues for this business pillar is also
supported by significant orders delivered during this
quarter for our Piedmont’s business line.
• GPM: $5.9 M, or 45.4 %, compared with $3.1 M, or 38.8 % for
Q3-FY2019, representing an increase of $2.8 M in dollar, as
well as an increase of the GPM in %. The GPM increased by
88.0% while the revenues increased by 60.5 %;
• Operating and Selling: $2.3 M, compared to $1.5 M, for Q3-
FY2019. The acquisition of Genesys contributed to $0.6 M of
this increase;
• EBAC: $3.6 M, compared to $1.7 M for Q3-FY2019,
representing an increase of $1.9 M, or 114.6 %.
$1.7 M$3.6 M
$8.0 M
$12.9 M
$22.4 M
$35.3 M
0
5
10
15
20
25
30
35
40
Q3-FY2019 Q3-FY2020
EBAC Revenue Revenue LTM

TSXV:HEO
15
3rd Business PillarOperation & Maintenance (O&M)
• Revenues : $16.4 M, compared to $15.3 M for Q3-FY2019,
representing an increase of $1.1 M, or 7.1 %. This increase is due to
organic growth seen in both Utility Partners and Hays;
• GPM: $3.2 M, or 19.6 %, compared with $3.0 M, or 19.5 % for Q3-
FY2019, representing an increase of $0.2 M, or 7.6 %;
• Operating and Selling: $1.0 M, compared to $1.1 M, for Q3-FY2019,
representing a decrease of $0.1 M;
• EBAC: $2.2 M, compared to $1.9 M for Q3-FY2019, representing an
increase of $0.3 M, or 15.4 %.
In CAD million $
$1.9 M $2.2 M
$15.3 M $16.4 M
$46.7 M
$62.7 M
$90.6 M
$102.9 M
0
20
40
60
80
100
120
Q3-FY2019 Q3-FY2020
EBAC Revenue Revenue LTM Backlog

TSXV:HEO
• Revenues : $36.1 M, compared to $32.3 M for the Q3-
FY2019, representing an increase of $3.8 M, or 11.6 %.
➢ Acquisition of Genesys during the Q2-FY2020, contributed
to $3.1 M in revenues during this quarter;
➢ Organic growth of $1.8 M from Specialty Products and
$1.1 M from O&M, partly offset by the decrease in
revenues of $2.2 M from the Projects;
➢ In line with our business plan to grow the Specialty
Products and O&M, as well as prioritize projects with
higher profit margins.
• GPM: 28.7%, compare to 23.3% Q3-FY2019:
➢ Revenue increase of the Specialty Products, characterized
with higher GPM;
➢ Improvement of the GPM coming from the Projects &
Aftermarket;
➢ IFRS 16 – Leases resulting in a decrease of the COGS
expenses of $0.1 M for the Q3-FY2020.
Financial HighlightsQ3-FY2020 vs Q3-FY2019
16
Three-month periods
ended March 31,
Nine-month periods
ended March 31,
2020 2019 2020 2019
Revenues $36.1 M $32.3 M $97.6 M $86.1 MProjects & Aftermarket $6.7 M $8.9 M $22.3 M $31.1 MSpecialty Products $12.9 M $8.0 M $28.5 M $18.1 MOperation & Maintenance $16.4 M $15.3 M $46.8 M $36.9 M
Gross profit before depreciation
and amortization (%)28.7% 23.3% 25.9% 22.4%
SG&A $6.8 M $5.5 M $17.7 M $14.8 M% SG&A 18.8% 17.0% 18.2% 17.2%Earnings (loss) before impairment $1.6 M $0.5 M ($0.3 M) ($1.0 M)Net earnings (loss) ($3.1 M) $0.5 M ($5.0 M) ($1.0 M)Adjusted EBITDA $3.8 M $2.2 M $7.7 M $4.8 MAdjusted EBITDA over revenues
(%)10.5% 6.8% 7.9% 5.6%
Reconciliation of net earnings (loss) to
earnings (loss) before impairment
Three-month periods ended
March 31,
Nine-month periods ended
March 31,
2020 2019 2020 2019
$ $ $ $
Net earnings (loss) for the period ($3.1 M) $0.5 M ($5.0 M) ($1.0 M)
Impairment of intangible assets and
goodwill $5.3 M - $5.3 M -
Deferred tax impact on impairment ($0.6 M) - ($0.6 M) -
Earnings (loss) before impairment $1.6 M $0.5 M ($0.3 M) ($1.0 M)
• Earnings (loss) before impairment is defined as the net
earnings (loss) before the impairment charges taken
following the impairment test performed during the third
quarter of fiscal year 2020. This non-IFRS measure is used
by management to evaluate the results of the
Corporation before this non-cash and non-recurring item.

TSXV:HEO
SG&A Expenses
17
• SG&A : $6.8 M, compared to $5.5 M for Q3-2019, increase
of $1.3 M, or 23.2 %.
➢ Acquisition of Genesys in Q2-2020 contributed to
$0.7 M, or 50% of this increase;
➢ Sales costs: hiring in Piedmont and Aftermarket;
➢ Administrative expenses : $2.3 M during Q3-FY2020,
compared to $2.0 M for the previous fiscal year,
representing an increase of $0.3 M, or 14.2 %
coming from hiring and professional fees;
➢ IFRS 16 – Leases resulted in a decrease of the SG&A
expenses of $0.2 M for Q3-FY2020, as lease
expenses were reclassified to depreciation and
amortization.
In CAD million $
$5.5 M
$6.8 M
0
1
2
3
4
5
6
7
8
Q3-FY2019 Q3-FY2020
18.8%
17.0%

TSXV:HEO
Adjusted EBITDA
18
Three-month periods
ended March 31,
Nine-month periods
ended March 31,
2020 2019 2020 2019
Net earnings (loss) for the period ($3.1 M) $0.5 M ($5.0 M) ($1.0 M)
Finance costs – net $0.5 M $0.4 M $1.5 M $1.9 M
Income taxes ($0.6 M) ($0.2 M) ($0.9 M) ($0.2 M)Depreciation of property, plant and
equipment $0.7 M $0.3 M $2.1M $0.9 M
Amortization of intangible assets $1.1 M $1.0 M $3.1 M $2.5 MImpairment of intangible assets and
goodwill $5.3 M - $5.3 M -
EBITDA before impairment $3.9 M $1.9 M $6.0 M $4.0 M
Unrealized exchange (gain) loss ($0.3 M) ($0.05 M) ($0.6 M) $0.1 M
Stock-based compensation costs $0.06 M $0.08 M $0.2 M $0.2MChange in fair value of contingent
consideration $0.06 M - $0.3 M -Acquisition-related costs, integration
costs and other costs $0.05 M $0.1 M $1.8 M $0.6 M
Adjusted EBITDA $3.8 M $2.2 M $7.7 M $4.8 M
• Adjusted EBITDA : $3.8 M, increased by $1.6 M,
or 71.9 %, compare to $2.2 M on Q3-FY2019;
• Adjusted EBITDA % reached 10.5 % for the
Q3-FY2020, compared to 6.8 % for Q3-FY2019;
• 9 months Adjusted EBITDA % reached 7.9 %,
compared to 5.6 % for 9 months in 2019;
• Improvement of the adjusted EBITDA was driven
by the:
➢ Increase of revenues and by the
improvement in GPMs, partly offset by the
increase in SG&A;
➢ Acquisition of Genesys, which contributed to
$0.9 M of EBITDA;
➢ IFRS 16 – Leases, which contributed to
reduce by $0.4 M the operating lease
expenses for the quarter. Excluding the
adjustment from IFRS 16 - Leases, the
adjusted EBITDA would have been 9.4 %.

TSXV:HEO
Financial Position
• Receivables: increased by $7.6 M, or 39.2 %, mostly attributable to:
➢ The integration of Genesys;
➢ Significant growth in Piedmont’s business line.
• Inventories: increased by $0.3 M, or 4.5 %, due to:
➢ The integration of Genesys;
➢ Decrease of Maple inventory level.
• Payables: increased by $2.1 M, or 17.1 %:
➢ The integration of Genesys;
➢ Working capital adjustment payable of $1.0 M.
19
Working capitalIncreased from $12.8 M to $16.8 M:
Financial Position
Period
ended
March 31,
2020
Period
ended June
30, 2019
Cash and Guaranteed Deposit
Certificate$6.6 M $6.2 M
Receivables $27.0 M $19.4 M
Inventories $7.0 M $6.7 M
Contract assets $6.1 M $5.9 M
Payables $14.4 M $12.3 M
Bank loans $7.2 M $7.5 M
Long-term debt $17.6 M $8.4 M
Contract liabilities $4.2 M $3.1 M

TSXV:HEO
Net Debt
20
• As at March 31, 2020, the net debt stood at $18.1 M,
compared with $9.8 M as at June 30, 2019,
representing a $8.3 M increase, or 85.2 %.
➢ This increase : new term loan of $12.0 M for
the acquisition of Genesys on November 15,
2019, offset by the reimbursement of $0.3 M
in bank loans;
➢ IFRS 16 – Leases contributed to reduce
$0.6 M the net debt since obligations under
finance lease has been reclassified to the
lease liabilities.
In CAD million $
0
2
4
6
8
10
12
14
16
18
20
Q3-FY2019 Q4-FY2019 Q1-FY2020 Q2-FY2020 Q3-FY2020
March 31,
2020
June 30,
2019
Bank loans $7.2 M $7.5 M
Current portion
of long-term
debt
$2.8 M $1.9 M
Long-term debt $14.8 M $6.6 M
Less: Cash ($6.7 M) ($6.2 M)
Net debt $18.1 M $9.8 M

TSXV:HEO
Cash Flows from Operating Activities
21
• Cash flows from operating activities:
$0.9 M, compared to ($0.2 M) Q3-FY2019;
• The increase in the cash flows from
operating activities is coming from the
improvement of the earnings before
income taxes and impairment charges.
In CAD million $
($0.2 M)
$0.9 M
$2.0 M
$4.1 M
$0.2 M$0.3 M
-0.4
0
0.4
0.8
1.2
1.6
2
2.4
2.8
3.2
3.6
4
4.4
Q3 FY2019 Q3 FY2020
Cashflow from operating activities
Cashflow from operating activities before change in working
capital items
CAPEX
TSXV:HEO
Business Opportunities Post COVID-19
Projects & Aftermarket :
• Well positioned to capture Governmental infrastructure investments to up-grade aging and inadequate water & wastewater infrastructures;
Specialty Products :
• Our large distribution network can better cope with the Pandemic and lockdowns (local inventory, proximity with their domestic market, risk is diversified);
Operation & Maintenance :
• Contract operators can better manage water and wastewater assets to ensure a greater continuity of operations, compliance and safety in the services provided to rate payers. Could become the best alternative to mitigate risk.
22

TSXV:HEO
23
Takeaways
• Revenue growth of 11.6 %;
• Proven and solid business model with 88.0 % of revenues recurrent by nature (Aftermarket, Specialty Products and O&M);
• Our “one-stop-shop” model promotes multiple sales synergies and high customer retention;
• Best adjusted EBITDA performance announced on a single quarter : $3.8 M, up 71.9 % compared to $2.2 M in Q3-FY2019;
• Our combined backlog remains high at $136.2 M, giving great visibility for the coming quarters;
• Water is essential - Continuity of operations during the pandemic;
• Balance sheet is healthy and not over-leveraged;
• Nominated as Water Company of the Year, by GWI – for its 20th anniversary.

TSXV:HEO
24
H2O InnovationUnique smart water player
Headquarters
330 rue St-Vallier Est, suite 340
Quebec City, QC
G1K 9C5 Canada
1-418-688-0170
www.h2oinnovation.com