INVESTOR PRESENTATION Q3 2013 - PKC Group Investor Presentation Q3 2013 Maximizing current PKC...
23
INVESTOR PRESENTATION Q3 2013 October 31, 2013 Matti Hyytiäinen, President & CEO
-
Upload
vuongthien -
Category
Documents
-
view
215 -
download
0
Transcript of INVESTOR PRESENTATION Q3 2013 - PKC Group Investor Presentation Q3 2013 Maximizing current PKC...
INVESTOR PRESENTATION Q3 2013October 31, 2013
Matti Hyytiäinen, President & CEO

PKC’s Operations• Several production transfers and ramp-ups of
current and new customers’ programs on-going in Europe
• Received major recognitions and awards on quality and delivery performance from two main accounts in North America
2
Business Environment
Q3/2013 Highlights
• Truck production volumes improved from second quarter in Brazil and remained unchanged in Europe
• North American truck demand was softer than earlier forecasted
PKC’s Financial Performance
• EBITDA% was burdened by product transfers and ramp ups in Europe, and higher labour and material costs in Brazil
• Cash flow improved from the first half of the year
PKC Investor Presentation Q3 2013

Maximizing current PKC set-up
3
Strategy 2018 Update
• East/Midwest region office established in USA to focus on growth opportunities with existing and new accounts
• Decision to establish wiring systems factory in Serbia to serve existing and potential new customers in Europe
PKC Investor Presentation Q3 2013
Penetrating into APAC• Framework Agreement for Strategic
Cooperation signed with SINOTRUK on the opportunity to establish a joint venture to manufacture wiring systems for SINOTRUK and possibly also for other customers in China and abroad
Funding• The issue of 2.14 million new shares (proceeds
EUR 44.9 million) and EUR 100 million fixed rate unsecured bond maturing in 2018
• The proceeds are intended for refinancing, general corporate purposes and to enable strategy execution incl. potential acquisitions
4
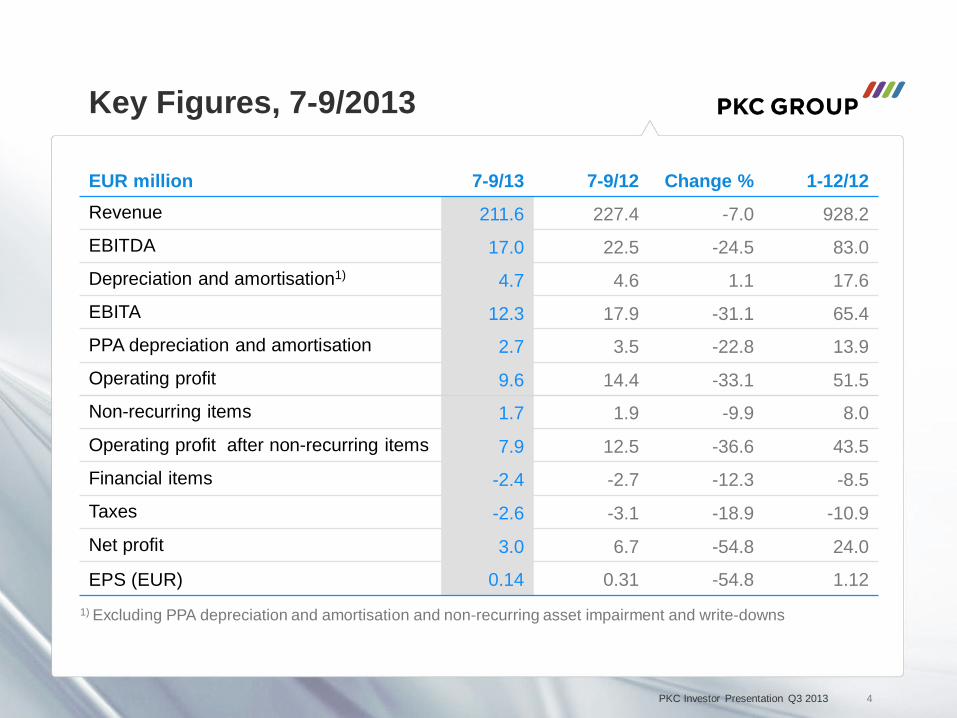
Key Figures, 7-9/2013
EUR million 7-9/13 7-9/12 Change % 1-12/12Revenue 211.6 227.4 -7.0 928.2
EBITDA 17.0 22.5 -24.5 83.0
Depreciation and amortisation1) 4.7 4.6 1.1 17.6
EBITA 12.3 17.9 -31.1 65.4
PPA depreciation and amortisation 2.7 3.5 -22.8 13.9
Operating profit 9.6 14.4 -33.1 51.5
Non-recurring items 1.7 1.9 -9.9 8.0
Operating profit after non-recurring items 7.9 12.5 -36.6 43.5
Financial items -2.4 -2.7 -12.3 -8.5
Taxes -2.6 -3.1 -18.9 -10.9
Net profit 3.0 6.7 -54.8 24.0
EPS (EUR) 0.14 0.31 -54.8 1.121) Excluding PPA depreciation and amortisation and non-recurring asset impairment and write-downs
PKC Investor Presentation Q3 2013

5
Key Figures, 1-9/2013
EUR million 1-9/13 1-9/12 Change % 1-12/12Revenue 671.9 714.2 -5.9 928.2
EBITDA 56.4 65.8 -14.3 83.0
Depreciation and amortisation1) 13.8 12.6 9.5 17.6
EBITA 42.6 53.2 -19.9 65.4
PPA depreciation and amortisation 8.4 10.6 -20.7 13.9
Operating profit 34.2 42.6 -19.7 51.5
Non-recurring items 8.3 3.2 164.3 8.0
Operating profit after non-recurring items 25.9 39.4 -34.4 43.5
Financial items -6.2 -5.2 20.5 -8.5
Taxes -7.5 -11.0 -32.0 -10.9
Net profit 12.1 23.3 -47.8 24.0
EPS (EUR) 0.55 1.09 -49.5 1.121) Excluding PPA depreciation and amortisation and non-recurring asset impairment and write-downs
PKC Investor Presentation Q3 2013

Revenue
6
242.0
225.2
244.8
235.1
227.4
211.6214.0
180
200
220
240
260
2012 2013
Q1 Q2 Q3 Q4
EUR million
PKC Investor Presentation Q3 2013

Geographical Split
56.8 %
25.7 %
9.5 %0.7 %
5.1 %
0.2 %1.9 %
0%
10%
20%
30%
40%
50%
60%
NorthAmerica
Europe SouthAmerica
APAC
Revenue 7-9/2013
Wiring Systems Electronics
120.3
65.3
20.5
5.5
EUR million
7
57.4 %
22.9 %16.0 %
0.3 %
1.4 %
2.0 %0%
10%
20%
30%
40%
50%
60%
70%
NorthAmerica
Europe SouthAmerica
APAC
Average Number of Personnel 7-9/2013
Wiring Systems Electronics
11,051
4,670
3,076
439
Temporary employees included
PKC Investor Presentation Q3 2013

Profitability
20.422.9 22.5
17.218.8
20.617.016.2
19.2 17.9
12.214.2
16.112.3
8.49.4
9.9
8.0 8.38.8
8.0
6.7
7.8 7.9
5.76.3
6.8
5.8
0
2
4
6
8
10
12
0
2
4
6
8
10
12
14
16
18
20
22
24
Q1/12 Q2/12 Q3/12 Q4/12 Q1/13 Q2/13 Q3/13
EBITDA (adjusted*) EBITA (adjusted**) EBITDA* % EBITA** %
8
EUR million %
* excluding non-recurring items in EBITDA ** excluding non-recurring items and PPA depreciation and amortisation in operating profit
PKC Investor Presentation Q3 2013

Earnings, Cash Flow and Dividend per Share
9
1.16 1.12 1.09
0.55
1.46
2.97
2.43
0.290.60 0.70
0.0
0.5
1.0
1.5
2.0
2.5
3.0
3.5
2011 2012 1-9/12 1-9/13
Earnings per shareFree cash flow (excl. acquisitions) per shareDividend per share
EUR
PKC Investor Presentation Q3 2013

Net Working Capital
10
104.0 104.1 112.7 104.5 84.6 109.0 112.9 106.1
110.5 108.4 97.6 92.187.5
92.1 87.8 87.7
-90.8 -101.6 -91.3 -90.6 -75.5 -94.8 -90.8 -88.4
-23.0 -20.3 -22.1 -23.2-23.8
-25.3 -26.6 -23.4
-15
-10
-5
0
5
10
15
20
25
-150
-100
-50
0
50
100
150
200
250
Q4/11 Q1/12 Q2/12 Q3/12 Q4/12 Q1/13 Q2/13 Q3/13
Trade receivables InventoriesTrade payables Other liabilities and receivables***NWC* % of Revenue**
100.7 96.990.7 82.772.7
83.281.0 82.0
EUR million %
* Average of previous four quarters ** Revenue of previous 12 months
PKC Investor Presentation Q3 2013
*** related to employee benefits, taxes and financial items
Inventories Trade receivables

Cash Flow
40.0
76.060.8
16.8
-90.2
-12.3 -8.7 -10.3
-50.2
63.752.1
6.4
-100
-80
-60
-40
-20
0
20
40
60
80
100
2011 2012 1-9/12 1-9/13
Cash from operations Capital expenditure Free cash flow
11
EUR million
PKC Investor Presentation Q3 2013

110.7
56.669.4
17.8
2.1
0.70.9
0.3 0.0
0.4
0.8
1.2
1.6
2.0
2.4
0
20
40
60
80
100
120
2011 2012 Q3/12 Q3/13
Net debt Net debt to EBITDA*
Balance Sheet and Returns
12
30.033.9 32.5
39.1
05
1015202530354045
2011 2012 Q3/12 Q3/13
Equity ratio, %
72.6
34.442.0
9.0
01020304050607080
2011 2012 Q3/12 Q3/13
Gearing, %
17.015.1
19.5
9.0
18.916.7
20.1
15.2
0
5
10
15
20
25
30
2011 2012 1-9/12 1-9/13
ROE, % ROI, %
% %
EUR million %
PKC Investor Presentation Q3 2013*EBITDA of previous 12 months

13
Wiring Systems Segment, Q3/2013
• Revenue decreased 10% from previous quarter and 6% from previous year
• Headcount was reduced in Brazil despite growing volumes. Weaker real and continuing labour cost inflation had a negative impact on profitability– target is to return to profitability in 2014– actions to reduce headcount and fixed cost
are continuing– in addition, supply chain is being
streamlined
226.6
208.4
226.8
217.2
209.2
196.4196.1
180
190
200
210
220
230
2012 2013Q1 Q2 Q3 Q4
15.2
11.7
15.413.314.2
9.68.7
0
5
10
15
20
2012 2013Q1 Q2 Q3 Q4
RevenueEUR million
Adjusted Operating ProfitEUR million Illustrated net of non-recurring items
PKC Investor Presentation Q3 2013

PKC Market Share 1-9/2013
• Current business relationship with all key western OEMs in commercial vehicle industry enable future growth
• Global leader position as a target
59%41%
34%
66%
33%
67%
2%
98%
37%63%
17%
83%
North America BrazilEurope
Medium Commercial
Vehicle
HeavyCommercial
Vehicle
PKCOther
Source: PKC Group, ACT Build History October 2013, LMC Automotive forecasting Q3/2013. Note: Europe comprised of EU27 + Efta
1%
99%
APAC
0%
100%
PKC Investor Presentation Q3 2013 14

EU27+ EFTA Truck Production
050,000
100,000150,000200,000250,000300,000350,000400,000450,000500,000
Q1-Q32012
Q1-Q32013
2012 2013 2014 2015 2016 2017 2018
Heavy Trucks Medium Trucks
• Q3/13 heavy duty production volumes were flat compared to Q2/13 and up by 1% from Q3/12. Medium duty volumes decreased -4% from Q2/13
• Full year 2013 heavy duty forecast has been increased, but is still down slightly by about -1% from 2012 (previous forecast -6%) and medium truck production to remain unchanged compared to 2012 level
• Due to upcoming Euro 6 standard volumes are expected to increase in Q4/13
units
Source: LMC Automotive forecasting Q3/2013
EURO 6
-6%
-8%
-1%
0%
PKC Investor Presentation Q3 2013 15

North America Truck & LCV Production
0
50,000
100,000
150,000
200,000
250,000
300,000
350,000
Q1-Q32012
Q1-Q32013
2012 2013 2014 2015 2016 2017 2018Heavy Trucks Medium Trucks
-15%
-10%
+7%
+7%
• Heavy duty truck production volume was down -4% from previous quarter, but unchanged year-on-year
• Full year heavy duty production estimate is down by -10%, medium duty up by +7%(earlier -6% and +7% respectively)
• LCV production volume estimate is unchanged at +5%
units
Source: LMC Automotive forecasting Q3/2013
EPA 2014
01,000,0002,000,0003,000,0004,000,0005,000,0006,000,0007,000,0008,000,0009,000,000
10,000,000
Q1-Q3
2012
Q1-Q3
2013
2012 2013 2014 2015 2016 2017 2018
+6%
+5%
Light Commercial Vehicle (Pick-up and SUV)PKC Investor Presentation Q3 2013 16
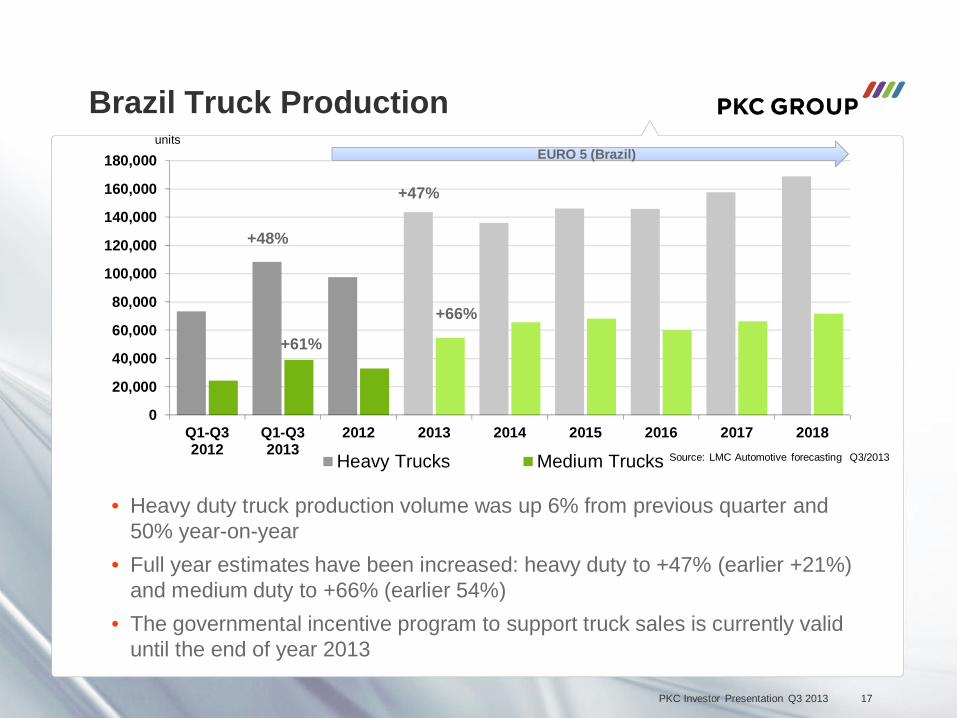
Brazil Truck Production
0
20,000
40,000
60,000
80,000
100,000
120,000
140,000
160,000
180,000
Q1-Q32012
Q1-Q32013
2012 2013 2014 2015 2016 2017 2018
Heavy Trucks Medium Trucks
+47%
+66%
+61%
+48%
• Heavy duty truck production volume was up 6% from previous quarter and 50% year-on-year
• Full year estimates have been increased: heavy duty to +47% (earlier +21%) and medium duty to +66% (earlier 54%)
• The governmental incentive program to support truck sales is currently valid until the end of year 2013
units
Source: LMC Automotive forecasting Q3/2013
EURO 5 (Brazil)
PKC Investor Presentation Q3 2013 17

Market Outlook – Full Year 2013
• European truck production is estimated to remain roughly unchanged compared to 2012.
• North American heavy duty truck production is estimated to decrease by 10% and medium duty truck production to increase 7% from 2012 level.
• Brazilian heavy duty truck production is estimated to increase by 47% and medium duty truck production by 66% compared to 2012.
• PKC’s market outlook is further impacted by some light vehicle and component programs that are near end-of-life-cycle and will be ramped-down in 2013.
18PKC Investor Presentation Q3 2013

19
Electronics Segment, Q3/2013
• Revenue decreased 20% year-on-year• Profitability improvement continued
due to on-going measures to improve cost competitiveness
• Favourable product mix with stronger ODM sales
15.3
16.7
18.0 17.918.3
15.3
17.8
13
14
15
16
17
18
19
2012 2013Q1 Q2 Q3 Q4
-0.9
1.00.7
1.71.4 1.3
1.0
-1.5
-1
-0.5
0
0.5
1
1.5
2
2012 2013
Q1 Q2 Q3 Q4
EUR million
EUR million
Illustrated net of non-recurring items
Adjusted EBIT
Revenue
Market Outlook – Full Year 2013
• The demand of industrial electronic and telecommunications sector appliances is estimated to remain at the previous level
• Volumes of renewable-energy and energy saving products including smart grid solutions are expected to increase slightly
PKC Investor Presentation Q3 2013

PKC Group’s Outlook
• PKC Group estimates its full year 2013 revenue to be lower than in 2012 and estimates its comparable operating profit excluding non-recurring items not to reach 2012 level.
• In 2012 PKC’s revenue was EUR 928.2 million and comparable operating profit excluding non-recurring items was EUR 51.5 million.
20PKC Investor Presentation Q3 2013

STRATEGIC INITIATIVES
PKC’s Strategy Captures Growth Opportunities
VISION 2020
PKC is the Preferred Supplier in Electrical Distribution Systems for Transportation Industry globally.
21
Managing the Complexity
Developing PKC Uniqueness further
Maximizing currentPKC set-up
Penetrating into APAC
Exploring opportunities
to expand within Transportation
Industry
Developing Electronics business as a stand alone within PKC Group
PKC Investor Presentation Q3 2013

Long-Term Financial Targets
Annual Revenue EUR 1.4 Billion by 2018EBITDA > 10%Gearing < 75%
Dividends 30 – 60% of Free Cash Flow
Annual Revenue EUR 1.4 Billion by 2018EBITDA > 10%Gearing < 75%
Dividends 30 – 60% of Free Cash Flow
Developing PKC Uniqueness
further
Developing PKC Uniqueness
furtherMaximizing current
PKC set-upMaximizing current
PKC set-upPenetrating into
APACPenetrating into
APAC
Exploring opportunities
to expand within Transportation
Industry
Exploring opportunities
to expand within Transportation
Industry
22PKC Investor Presentation Q3 2013

PKC Group PlcUnioninkatu 20-22
FI-00130 Helsinki, Finland
www.pkcgroup.com