INVESTOR PRESENTATION Q2-2015 RESULTS JULY 23, 2015 · PDF fileINVESTOR PRESENTATION Q2-2015...
21
July 23, 2015 Page 1 INVESTOR PRESENTATION Q2-2015 RESULTS JULY 23, 2015
Transcript of INVESTOR PRESENTATION Q2-2015 RESULTS JULY 23, 2015 · PDF fileINVESTOR PRESENTATION Q2-2015...

July 23, 2015 Page 1
INVESTOR PRESENTATION
Q2-2015 RESULTS
JULY 23, 2015

July 23, 2015 Page 2
Safe Harbor Statement
This presentation contains statements about management's future expectations, plans and prospects of our business that
constitute forward-looking statements, which are found in various places throughout the press release, including , but not
limited to, statements relating to expectations of orders, net sales, product shipments, backlog, expenses, timing of
purchases of assembly equipment by customers, gross margins, operating results and capital expenditures. The use of
words such as “anticipate”, “estimate”, “expect”, “can”, “intend”, “believes”, “may”, “plan”, “predict”, “project”, “forecast”,
“will”, “would”, and similar expressions are intended to identify forward looking statements, although not all forward looking
statements contain these identifying words. The financial guidance set forth under the heading “Outlook” constitutes forward
looking statements. While these forward looking statements represent our judgments and expectations concerning the
development of our business, a number of risks, uncertainties and other important factors could cause actual developments
and results to differ materially from those contained in forward looking statements, including the discovery of weaknesses in
our internal controls and procedures; our inability to maintain continued demand for our products; the impact on our
business of potential disruptions to European economies from euro zone sovereign credit issues; failure of anticipated
orders to materialize or postponement or cancellation of orders, generally without charges; the volatility in the demand for
semiconductors and our products and services; failure to adequately decrease costs and expenses as revenues decline,
loss of significant customers, lengthening of the sales cycle, incurring additional restructuring charges in the future, acts of
terrorism and violence; inability to forecast demand and inventory levels for our products, the integrity of product pricing and
protection of our intellectual property in foreign jurisdictions; risks, such as changes in trade regulations, currency
fluctuations, political instability and war, associated with substantial foreign customers, suppliers and foreign manufacturing
operations; potential instability in foreign capital markets; the risk of failure to successfully manage our diverse operations;
those additional risk factors set forth in Besi's annual report for the year ended December 31, 2014 and other key factors
that could adversely affect our businesses and financial performance contained in our filings and reports, including our
statutory consolidated statements. We are under no obligation to (and expressly disclaim any such obligation to) update or
alter our forward-looking statements whether as a result of new information, future events or otherwise.

July 23, 2015 Page 3
Table of Contents
I. Key Highlights
II. Financial Review
III. Strategic Highlights
IV. Outlook & Summary

July 23, 2015 Page 4
I. KEY HIGHLIGHTS
I. KEY HIGHLIGHTS

July 23, 2015 Page 5
Key Financial Highlights
• € 104.3 million:
• +9.9% vs. Q1-15
• -10.2% vs. Q2-14
Revenue
• € 91.9 million:
• -11.8% vs. Q1-15
• -26.0% vs. Q2-14
Orders
• € 15.5 million:
• +9.2% vs. Q1-15 (ex-restructuring benefit)
• -32.3% vs. Q2-14
Net Income
• Net cash of € 91.4 million
• -€ 41.7 million vs. Q1-15 (€ 56.9 million cash dividend payment)
Liquidity
Besi Posts Strong Q2 and H1-15 Results.
Significant Expansion of Net Cash Position vs. Q2-14
• € 199.2 million:
• +7.0% vs. 2014
Revenue
• € 196.1 million:
• -16.7% vs. 2014
Orders
• € 33.0 million, +10.4% vs. 2014
• € 29.8 million (ex-restructuring benefit) vs. € 29.9 million H1-14
Net Income
• Net cash +€ 28.9 million vs. Q2-14
Liquidity
Q2-15 H1-15

July 23, 2015 Page 6
€ 116.2
€ 104.3
19.7% 14.8%
0%
10%
20%
30%
40%
50%
60%
70%
80%
90%
€ 0
€ 20
€ 40
€ 60
€ 80
€ 100
€ 120
€ 140
Q2 2014 Q2 2015
Net
marg
in %
€ m
illio
ns
Revenue Net Income
Gross Margin
OPEX
Headcount
Effective Tax Rate
9.4% 11.8%
1,672 1,684
€ 24.6
MM
€ 32.0
MM
+12
+2.4%
+30.1%
43.2% 47.9%
-10.2%
-4.9 points
Q2-14/Q2-15 H1-14/H1-15*
+4.7 points
€ 15.5
€ 186.2
€ 199.2
16.1% 15.0%
0%
10%
20%
30%
40%
50%
60%
70%
80%
90%
0 €
50 €
100 €
150 €
200 €
250 €
2014 2015*
Net
marg
in %
€ m
illio
ns
Revenue Net Income
Gross Margin
OPEX
Headcount
Effective Tax Rate
9.9% 12.7%
1,672 1,684
€ 46.1
MM
€ 60.2
MM
42.9% 48.1%
+12
+2.8 points
+30.6%
+5.2 points
+7.0%
-1.1 points
€ 29.8 € 29.9
Solid Revenue and Profit Development In Less Favorable Industry Environment
€ 22.9
* Excluding net restructuring benefit

July 23, 2015 Page 7
II. FINANCIAL REVIEW

July 23, 2015 Page 8
Revenue/Order Trends
Quarterly Trends
YTD Trends
53.1
70.0
116.2
103.5 89.0 94.9
104.3
57.2
111.1
124.2
90.9 81.4
104.2
91.9
0
20
40
60
80
100
120
140
Q4-2013 Q1-2014 Q2-2014 Q3-2014 Q4-2014 Q1-2015 Q2-2015
(eu
ro in
mill
ion
s)
Revenue Orders
186.2 199.2
235.3
196.1
0
50
100
150
200
250
2014 2015
(eu
ro in
mill
ion
s)
Revenue Orders
Q2-15 vs. Q1-15
• Revenue: € 104.3 million (+9.9%)
• Low end of guidance due to customer push outs
• Increased sales for auto, high end server, China
handset and plating applications
• Orders: € 91.9 million (-11.8%)
• Lower memory and smart phone applications
• Partial offset: higher auto, high end server and
solar plating applications
• -€ 8.8 million (15.1%) IDMs
• -€ 3.5 million (7.6%) subcontractors
Q2-15 vs. Q2-14
• Revenue: -€ 11.9 million (-10.2%)
• Lower die attach sales for high end smart phones
• Orders: -€ 32.3 million (-26.0%)
YTD 15 vs. YTD 14
• Revenue: +€ 13.0 million (+7.0%)
•Higher memory and high end server, auto and
plating/solar applications.
• Partial offset: lower flip chip and MMA die attach
+ ultra-thin molding for high end smart phones
• Orders: -€ 39.2 million (-16.7%)
July 23, 2015 Page 9
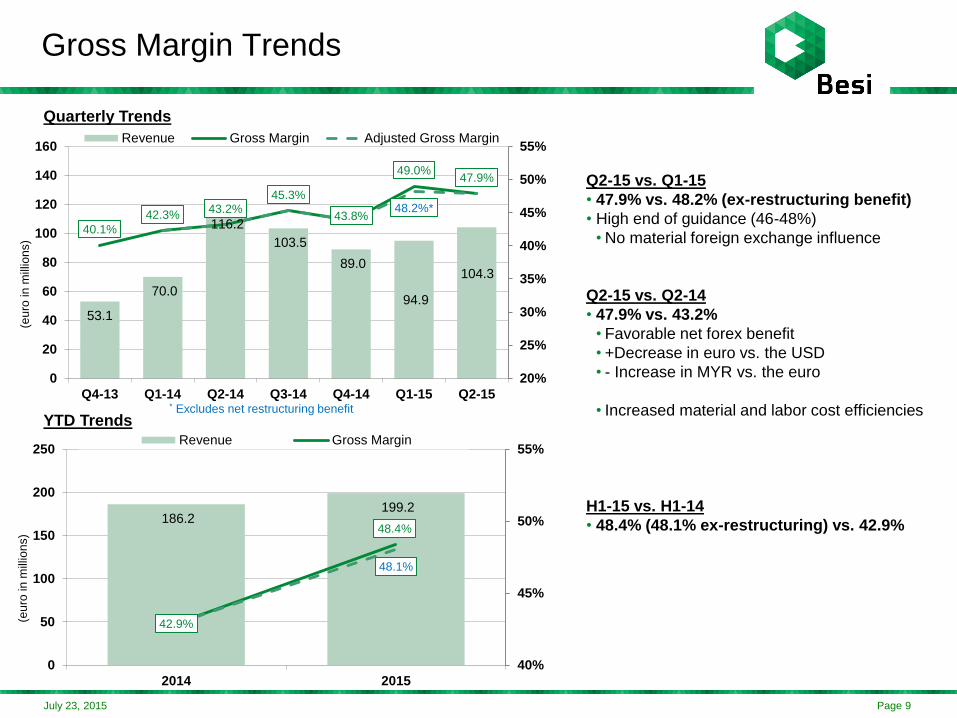
Gross Margin Trends
Quarterly Trends
186.2 199.2
42.9%
48.4%
48.1%
40%
45%
50%
55%
0
50
100
150
200
250
2014 2015
(eu
ro in
mill
ion
s)
Revenue Gross Margin
YTD Trends
53.1
70.0
116.2
103.5
89.0
94.9
104.3
40.1%
42.3% 43.2%
45.3%
43.8%
49.0% 47.9%
48.2%*
20%
25%
30%
35%
40%
45%
50%
55%
0
20
40
60
80
100
120
140
160
Q4-13 Q1-14 Q2-14 Q3-14 Q4-14 Q1-15 Q2-15
(eu
ro in
mill
ion
s)
Revenue Gross Margin Adjusted Gross Margin
Q2-15 vs. Q1-15
• 47.9% vs. 48.2% (ex-restructuring benefit)
• High end of guidance (46-48%)
•No material foreign exchange influence
Q2-15 vs. Q2-14
• 47.9% vs. 43.2%
• Favorable net forex benefit
• +Decrease in euro vs. the USD
• - Increase in MYR vs. the euro
• Increased material and labor cost efficiencies
H1-15 vs. H1-14
• 48.4% (48.1% ex-restructuring) vs. 42.9%
* Excludes net restructuring benefit

July 23, 2015 Page 10
Operating Expense Trends
Quarterly Trends
32.4 38.8
12.7
21.4 1.0
2.9-
46.1
57.3
60.3*
-10
10
30
50
70
90
2014 2015
(eu
ro in
mill
ion
s)
Restructuring/Other R&D SG&A
YTD Trends
13.1 15.2 17.2 15.5 17.3 20.5 20.6
5.2 6.1
6.6 7.5
7.3 9.9
11.4
2.2 0.2
0.8 0.0
-3.0
-2.9
0.1
20.5 21.5 24.6
23.0 24.6 25.3
32.0 28.3*
-10
-5
0
5
10
15
20
25
30
35
40
Q4-13 Q1-14 Q2-14 Q3-14 Q4-14 Q1-15 Q2-15
(eu
ro in
mill
ion
s)
Restructuring/Other R&D SG&A
Q2-15 vs. Q1-15
• +€ 3.7 million (+13.1%)
• Above guidance: (+5-7%)
• +€ 0.9 million TCB R&D related costs
• +€ 1.0 million warranty (forex + TCB)
• +€ 0.9 million personnel expenses
• +€ 0.5 million travel (restructuring Switzerland)
Q2-15 vs. Q2-14
• +€ 7.4 million (+30.1%)
• +€ 4.4 million R&D, principally TCB related
• +€ 1.5 million CHF increase vs. euro
• +€ 0.6 million incentive compensation
H1-15 vs. H1-14
• +€ 14.2 million (+30.8%)
• +€ 8.5 million R&D:
• € 3.9 million lower cap/higher amortization of
development costs
• +higher TCB personnel and materials
• +€ 3.4 million CHF increase vs. euro
• +€ 2.4 million incentive compensation
* Excludes net restructuring benefit

July 23, 2015 Page 11
Quarterly Base Line Operating Expense Trends
20.9 22.0 21.4 22.5 22.2 26.1
0.6 2.6
1.7 2.2 3.1
5.9
21.5
24.6 23.1
24.7 25.3
32.0
0.0
5.0
10.0
15.0
20.0
25.0
30.0
35.0
Q1-14 Q2-14 Q3-14 Q4-14 Q1-15 Q2-15
Base Opex Other Operating Expenses
Baseline Opex 20.9 22.0 21.4 22.5 22.2 26.1
Other Operating Expenses
Capitalization of R&D (2.8) (2.4) (2.0) (2.1) (1.5) (1.4)
Amortization of R&D 1.1 1.2 1.3 1.2 1.7 2.2
Capitalization & Amortization , net (1.7) (1.2) (0.7) (0.9) 0.2 0.8
Forex CHF/EUR 0.0 0.0 0.0 0.0 1.9 1.5
Restructuring cost/(benefit) 0.2 0.8 (0.0) (0.0) (3.0) 0.1
Variable Pay 2.1 3.0 2.4 3.1 4.0 3.5
Subtotal 0.6 2.6 1.7 2.2 3.1 5.9
Total 21.5 24.6 23.0 24.6 25.3 32.0

July 23, 2015 Page 12
3.4
12.2 14.2
15.5
(2.0)
7.5 3.3
1.4
7.0
22.9 21.5
19.7
17.5 15.5
6.4%*
10.0%
19.7% 20.8%
13.7%* 15.0%* 14.8%
-5%
0%
5%
10%
15%
20%
25%
30%
35%
40%
(3)
0
3
6
9
12
15
18
21
24
Q4-13 (*) Q1-14 Q2-14 Q3-14 Q4-14 (*) Q1-15 (*) Q2-15
(euro
in m
illio
ns)
Net Income ex. NR Non Recurring Net Margin ex. NR
Net Income Trends
Quarterly Trends
YTD Trends
• € 15.5 million Q2-15 net income
• +€ 1.3 million vs. €14.2 million (ex-
restructuring) in Q1-15
• -€ 7.4 million vs. Q2-14
• Sequential quarterly profit growth since
Q4-14 ex non recurring items
• Less volatile trajectory than prior years
• Reflects absence of H1-14 smart phone
capacity spike
• Higher base line profits and margins than
prior years
• Tax rate up slightly in 2015 due to
absence of Q2-14 tax benefit ($700k)
• 9.9% in H1-14 (12.0% ex. deferred tax
benefit) vs. 12.4% in H1-15
(*) Excludes net restructuring (€ 3.3 million) and deferred tax benefits (€ 7.5 million) in Q1-15
and Q4-14, respectively, and € 2.0 million non recurring charge in Q4-13
29.7
3.3 29.9
33.0
16.1% 14.9%
-5%
5%
15%
25%
35%
0
5
10
15
20
25
30
35
2014 YTD 2015YTD
(euro
in m
illio
ns)
Net Income ex. NR Non Recurring Net Margin ex. NR

July 23, 2015 Page 13
Liquidity Trends
Q2-15 vs. Q1-15
• Net cash -€ 41.7 million to € 91.4 million
Q2-15 cash movements
Principal sources of cash
• € 18.4 million cash from operations
Principal uses of cash
• -€ 56.9 million dividend payments
• -€ 6.1 million debt payments
• -€ 1.3 million capex
• -€ 1.4 million capitalized R&D
Q2-15 vs. Q2-14
• Net cash +€ 28.9 million
• Increased profit and improved working capital
management
91.9
83.8
105.4
135.3
161.6
113.7
19.1 21.3 19.3 17.3
28.5 22.3
72.8
62.5
86.1
118.0
133.1
91.4
0
20
40
60
80
100
120
140
160
180
Q1-14 Q2-14 Q3-14 Q4-14 Q1-15 Q2-15
(eu
ro in
mill
ion
s)
Cash Debt Net Cash

July 23, 2015 Page 14
III. STRATEGIC HIGHLIGHTS

July 23, 2015 Page 15
Assembly Equipment Market Trends
• VLSI forecasts flat growth in 2015 and 2016 after big 2014 increase as capacity digested
• Growth reaccelerates in 2017 and 2018
• Besi revenue growth exceeding assembly market in 5 of past 6 years
326.9
273.7 254.9
378.8
186.2 199.2
-16.3% -6.9%
48.6%
7.0%
-50%
0%
50%
100%
150%
-
100.0
200.0
300.0
400.0
2011 2012 2013 2014 YTD 2014 YTD 2015
(€ m
illi
on
s)
Besi Revenue Revenue YoY Growth Rate
4.4 4.0
3.1
4.0 4.0 3.9
4.6 4.9 4.8
-9.2%
-22.4%
29.1%
1.6% -2.5%
16.3%
7.7%
-2.3%
-30%
-20%
-10%
0%
10%
20%
30%
40%
0.0
1.0
2.0
3.0
4.0
5.0
6.0
2011 2012 2013 2014 2015F 2016F 2017F 2018F 2019F
(US
$ b
illi
on
s)
Assembly Equipment Market Size YoY Growth Rate
Source: VLSI May 2015

July 23, 2015 Page 16
• Spending on <25 nano nodes has increased from ~15% in 2011 to an estimated 70% of
total spending in 2015
• Node shift below 25 nano = new assembly equipment capacity
New Technology Cycle Focused on < 25 Nano Nodes Drives Assembly Equipment Spending

July 23, 2015 Page 17
Besi Revenue Growth Drivers
Revenue Growth Drivers
World tooling up for new
tech cycle <20 nano
Increased smart phone functionality
New device introductions: IoT, wearables
Wire bond/flip chip
conversion
Solar cell plating
transition from copper to
silver
Increased share of
Japanese supply chain and China handsets
TCB expansion to memory and logic devices

July 23, 2015 Page 18
Key Development and Operational Objectives
Development Objectives
Advanced TCB die bonding development
Introduction of next generation packaging systems
Common parts/platform activities
Operational Objectives
Transfer of certain Swiss Die Attach software, logistics and administrative functions to Singapore
Transfer of certain die bonding production from Malaysia to China
Transfer of Plating Production from NL to Malaysia
Further reduction of European based costs
Expansion of Asian supply chain. System module outsourcing
2015 2016
July 23, 2015 Page 19
IV. OUTLOOK & SUMMARY

July 23, 2015 Page 20
Q3-15 Guidance
Revenue Gross Margin Operating Expenses
Q2 Q3 Q2 Q3 Q2 Q3
€ 104.3 47.9% € 32.0
Down
15-20%
• Revenue declines by 15-20% reflecting seasonal trends and less favorable
industry conditions
• Gross margins decline to 45-47% range
• Opex down approximately 10% vs. Q2-15
• Expect solid profit and cash flow generation in H2-15
Down ~10%
47%
-
45%
July 23, 2015 Page 21
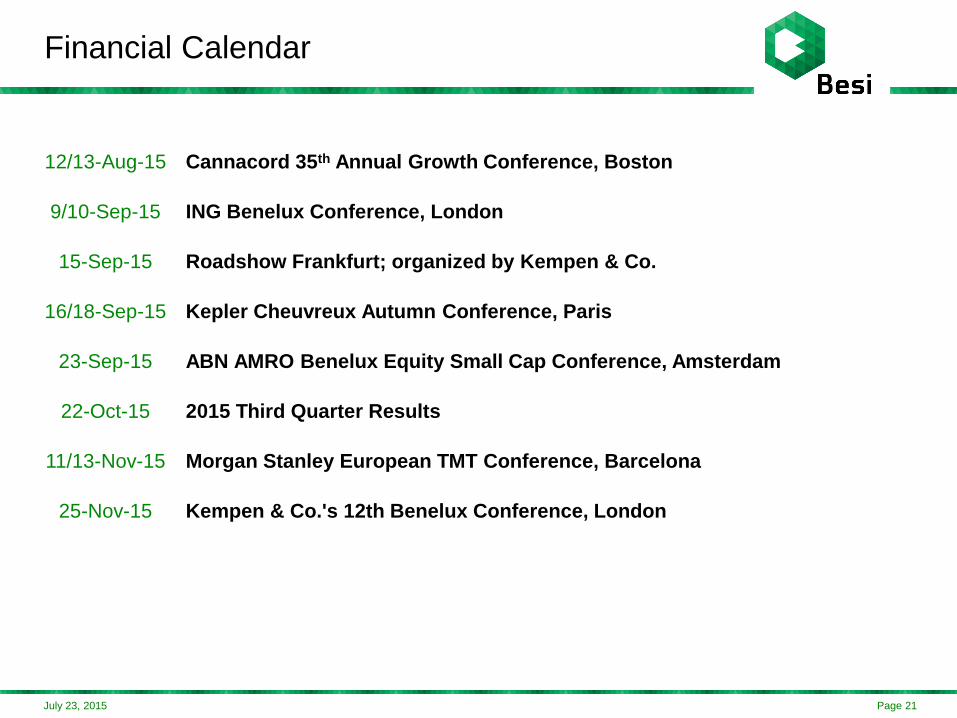
Financial Calendar
12/13-Aug-15 Cannacord 35th Annual Growth Conference, Boston
9/10-Sep-15 ING Benelux Conference, London
15-Sep-15 Roadshow Frankfurt; organized by Kempen & Co.
16/18-Sep-15 Kepler Cheuvreux Autumn Conference, Paris
23-Sep-15 ABN AMRO Benelux Equity Small Cap Conference, Amsterdam
22-Oct-15 2015 Third Quarter Results
11/13-Nov-15 Morgan Stanley European TMT Conference, Barcelona
25-Nov-15 Kempen & Co.'s 12th Benelux Conference, London