
Investor Presentation Q1 FY2012 V1 - DCB Bank€¦ · Investor Presentation – Q1 FY 2012 July...
30
Private & Confidential Investor Presentation – Q1 FY 2012 July 2011
-
Upload
nguyendung -
Category
Documents
-
view
224 -
download
4
Transcript of Investor Presentation Q1 FY2012 V1 - DCB Bank€¦ · Investor Presentation – Q1 FY 2012 July...

Private & Confidential
Investor Presentation – Q1 FY 2012
July 2011
Private & Confidential22
This presentation is strictly confidential and may not be copied, published, distributed or transmitted. The information in this presentation is being
provided by Development Credit Bank Limited (the “Bank”).
This presentation has been prepared for information purposes only and is not an offer or invitation, directly or indirectly, to buy or sell any
securities, nor shall part, or all, of this presentation form the basis of or be relied on in connection with, any contract or investment decision in
relation to any securities. This presentation is not an offer document or a prospectus under the Companies Act, 1956, as amended, the Securities
and Exchange Board of India (Issue of Capital and Disclosure Requirements) Regulations, 2009, as amended and any other applicable law.
This presentation contains forward-looking statements based on the currently held beliefs and assumptions of the management of the Bank, which
are expressed in good faith and, in their opinion, reasonable. Forward-looking statements involve known and unknown risks, uncertainties and
other factors, which may cause the actual results, financial condition, performance, or achievements of the Bank or industry results to differ
materially from the results, financial condition, performance or achievements expressed or implied by such forward-looking statements. The risks
and uncertainties relating to these statements include, but are not limited to, risks and uncertainties regarding expansion plans and the benefits
there from, fluctuations in our earnings, our ability to manage growth and implement strategies, intense competition in our business including those
factors which may affect our cost advantage, our ability to attract and retain highly skilled professionals, changes in technology, availability of
financing, our ability to successfully complete and integrate our business plans, liabilities, political instability and general economic conditions
affecting our industry. Given these risks, uncertainties and other factors, recipients of this document are cautioned not to place undue reliance on
these forward-looking statements. The Bank disclaims any obligation to update these forward-looking statements to reflect future events or
developments.
This presentation is not an offer of securities for sale in the United States or in any other jurisdiction. Securities may not be offered or sold in the
United States absent registration or an exemption from registration. No shares or other securities may be offered or sold other than in compliance
with the laws of relevant jurisdictions, including the United States Securities Act of 1933, as amended.
By viewing this presentation you acknowledge that you will be solely responsible for your own assessment of the market and the market position of
the Bank and that you will conduct your own analysis and be solely responsible for forming your own view of the potential future performance of the
business of the Bank.
Except as otherwise noted, all of the information contained herein is preliminary and indicative and is based on management information, current
plans and estimates. Industry and market-related information is obtained or derived from industry publications and has not been verified by us. The
information contained in this presentation, except as otherwise noted, is only current as of the date of the presentation, is subject to change without
notice. The Bank may alter, modify or otherwise change in any manner the content of this presentation, without any obligation to notify any person
of such revision or changes. Persons relying on the information in this presentation should do so at their own risk and the Bank shall not be
responsible for any kind of consequences or liability to any person arising out of, relying and acting upon any such information.
Disclaimer
Financial numbers are rounded off to nearest whole number

Private & Confidential3
Contents
DCB Bank – Overview
Business Strategy & Financials
Annexure

Private & Confidential4
DCB Bank – at a
glance
Comprehensive
product range &
scalable
infrastructure
Traditional loyal
customer base
Continued focus on
building low cost
franchise
Pedigreed board and
experienced
Management team
� Development Credit Bank Ltd (DCB Bank) http://www.dcbbank.com is a modern emerging new generation private sector bank.
Present since 1930s, DCB is the only co-operative bank in India to have been converted into a private sector commercial bank
in 1995
� Distribution network of 82 branches across 28 cities and 138 ATMs (as on June 30, 2011)
Steady improvement
in credit ratings
� Business model focused on achieving a balance between Retail Mortgages, Micro SME(MSME), SME, Agri/Microfinance and
mid-Corporate
� Comprehensive range of banking products across all businesses
� Modern systems and infrastructure to support growth- Finacle, FinnOne, CMS, Internet and Mobile banking
� Traditional sticky customer base helped by presence of branch network in select areas of Maharashtra, Gujarat & AP
� Provides DCB Bank access to low cost deposits
� Continued focus on building a low cost deposit franchise with strong capital position
� CASA of 33.31% and CRAR of 12.92% under Basel II (as on June 30, 2011)
� Rating agencies have upgraded the rating guidelines for DCB Bank
� Crisil rating (Long term): BBB + / Stable, Crisil rating (Short term): P1 and Fitch rating: BBB / Stable
� Nasser Munjee, Chairman: Ex- Executive Director – HDFC, instrumental in setting up IDFC & sits on the boards of many large
Indian companies
� Murali M. Natrajan, MD & CEO: worked in Standard Chartered Bank (Global Head – SME Banking), Citibank, American
Express; strong Retail Banking & SME experience in India & abroad
Robust Promoter
background
� DCB’s promoter, Aga Khan Fund for Economic Development (AKFED) http://www.akdn.org/akfed is present in 16 countries
employing over 30,000 people
� Promoter group holds 23.08% stake in DCB ( as on June 30, 2011)
DCB Bank – Overview

Private & Confidential
Key Milestones
In Existence Since 1930s
1981
� Amalgamation of
Masalawala Co-
operative Bank and
Ismailia Co-
operative Bank into
Development Co-
operative Bank Ltd.
1984
� Multi-State Co-
operative Bank
1995
� Conversion to
Development
Credit Bank Ltd.
� Secured Foreign
Exchange License
& became an
Authorized Dealer
1988
� Acquired
“Scheduled”
status from
Reserve Bank of
India
2004
� Classified as a
“New Generation
Private Sector
Bank” by the RBI
2006
� IPO
Tier I Capital Raising
2006
� Private Equity
investment of INR 519.9 mn by HDFC and KhattarHoldings and others in February 2006
2006
� Raised INR 1.86 bn
through IPO, issue
oversubscribed
35 times
2009
� Raised INR 810 mn
through QIP in
November 2009
subscribed by life
insurance
companies, mutual
funds and FIIs
2005
� Private Equity
Investment by
AKFED (Principal
Promoter) of INR
1.38 bn in March
2005
2007
� Preferential
Allotment of INR
2.8 bn in Aug 2007
to Al Bateen, TATA
Capital, DCB
Investments (SVG
Capital) and others
5

Private & Confidential6
Aga Khan Fund for
Economic Development
Principal
Promoter
Robust Promoter Background and Strong Investor Profile
Key non-promoter shareholders
� Al Bateen Investment Co LLC: 3.69%
� The India Fund, INC: 3.58%
� Tata Capital Ltd: 3.29%
� DCB Investments Ltd. (SVG Capital): 2.65%
� HDFC Ltd: 2.02%
� Satpal Khattar: 1.62%
� Sundaram BNP Paribas Mutual Fund: 1.36%
� The Royal Bank of Scotland PLC as: 1.33% Depository of First State Indian Subcontinent Fund a Subfund of First State Investment
� Girdharilal Lakhi: 1.23%
� Macquarie Bank Ltd.: 1.07%
Shareholding
Pattern
Shareholding Pattern (June 30, 2011)
� DCB Bank is promoted by the Aga Khan Fund for Economic Development (AKFED) http://www.akdn.org/akfed
� AKFED is an international development enterprise. It is dedicated to promoting entrepreneurship and building
economically sound companies
� AKFED operates as a network of affiliates with more than 90 separate project companies employing over
30,000 people. The Fund is active in 16 countries in the developing world
*Includes Clearing Members (1.27%), Non Resident Indians
(2.87%), Foreign Corporate Bodies (6.34%), Directors and their
relatives (0.02%)
Bodies Corporate
13.37%
Individuals
39.45%
Others (Non-
Institutions)*
10.50%
Institutions
13.60%
Promoter and Promoter
Group
23.08%
Private & Confidential7
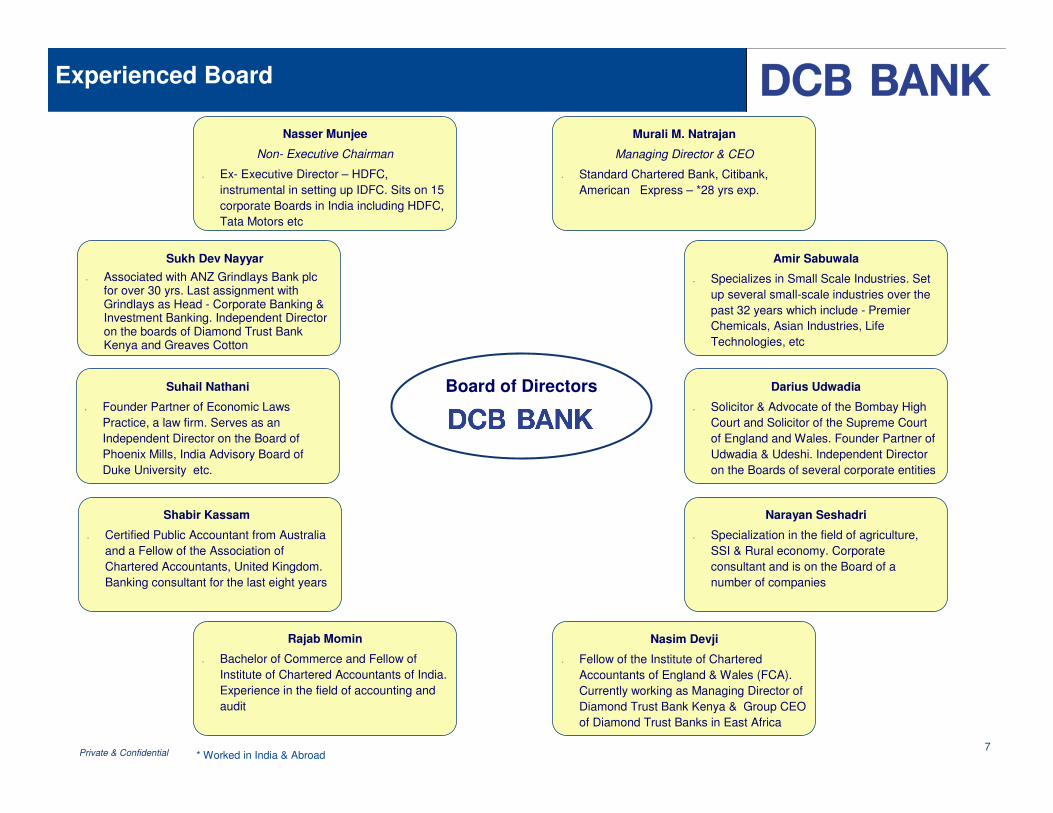
Sukh Dev Nayyar
� Associated with ANZ Grindlays Bank plc for over 30 yrs. Last assignment with Grindlays as Head - Corporate Banking & Investment Banking. Independent Director on the boards of Diamond Trust Bank Kenya and Greaves Cotton
Nasim Devji
� Fellow of the Institute of Chartered
Accountants of England & Wales (FCA).
Currently working as Managing Director of
Diamond Trust Bank Kenya & Group CEO
of Diamond Trust Banks in East Africa
Suhail Nathani
� Founder Partner of Economic Laws
Practice, a law firm. Serves as an
Independent Director on the Board of
Phoenix Mills, India Advisory Board of
Duke University etc.
Nasser Munjee
Non- Executive Chairman
� Ex- Executive Director – HDFC,
instrumental in setting up IDFC. Sits on 15
corporate Boards in India including HDFC,
Tata Motors etc
Amir Sabuwala
� Specializes in Small Scale Industries. Set
up several small-scale industries over the
past 32 years which include - Premier
Chemicals, Asian Industries, Life
Technologies, etc
Darius Udwadia
� Solicitor & Advocate of the Bombay High
Court and Solicitor of the Supreme Court
of England and Wales. Founder Partner of
Udwadia & Udeshi. Independent Director
on the Boards of several corporate entities
Shabir Kassam
� Certified Public Accountant from Australia
and a Fellow of the Association of
Chartered Accountants, United Kingdom.
Banking consultant for the last eight years
Rajab Momin
� Bachelor of Commerce and Fellow of
Institute of Chartered Accountants of India.
Experience in the field of accounting and
audit
Narayan Seshadri
� Specialization in the field of agriculture,
SSI & Rural economy. Corporate
consultant and is on the Board of a
number of companies
Experienced Board
Board of Directors
Murali M. Natrajan
Managing Director & CEO
� Standard Chartered Bank, Citibank,
American Express – *28 yrs exp.
* Worked in India & Abroad

Private & Confidential8
Gaurav Mehta
Head – Marketing, CorporateCommunication & Public Relations
HSBC India, Convergys, GE Capital and
Taj Group of Hotels – 16 yrs exp.
Strong Management Team
Murali M. Natrajan
Managing Director & CEO
Standard Chartered Bank, Citibank,
American Express – *28 yrs exp.
Praveen Kutty
Head- Retail, SME Banking
Citibank – *20 yrs exp.
Rajesh Verma
Head - Treasury
State Bank of India – *32 yrs exp.
* Worked in India & Abroad
Bharat SampatChief Financial Officer
ABN Amro Bank, Standard Chartered Bank, ANZ Banking Group, Hoechst
India – *27 yrs exp.
R. Venkattesh
Head - HR, IT & Operations
Standard Chartered Bank, ANZ
Grindlays Bank, Hindustan Petroleum –21 yrs exp.
Abhijit Bose
Head – Retail Assets
Standard Chartered Bank, Citibank,
Eldeco Housing Industries and GIC Housing – *19 yrs exp.
Ravi Kumar
Chief Internal Auditor
Samba Financial Group, Ernst & Young – *14 yrs exp.
Manoj Joshi
Business Head – SMEICICI Bank, Epcos Ferrites and
Uniworth Group – 16 yrs exp.
Anoop PrabhakarHead - Corporate Banking
State Bank of India – * 34 yrs exp.
Narendranath Mishra
Head - AIB
ICICI Bank and Rallis India – 12 yrs
exp.
J. K VishwanathChief Credit Officer
Fullerton India, Citigroup and EicherGroup – 18 yrs exp.
Sachin Patange
Chief Compliance Officer
Reserve Bank of India – 21 yrs exp.
Hemant Barve
Company Secretary
Ritchie Steuart Investments and Union
Bank of India – 37 yrs exp.
Management
Sridhar SeshadriFinancial Controller
ICICI Bank, Syndicate Bank and State
Bank of India – 29yrs exp.
Private & Confidential9
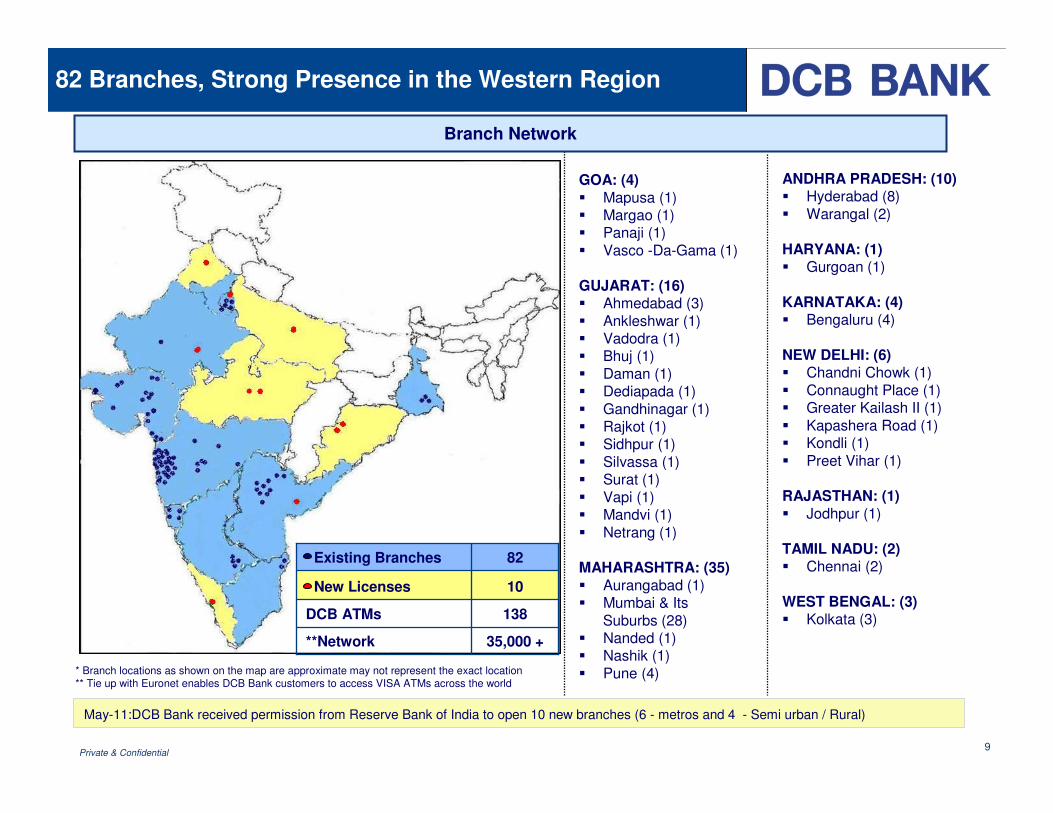
82 Branches, Strong Presence in the Western Region
* Branch locations as shown on the map are approximate may not represent the exact location** Tie up with Euronet enables DCB Bank customers to access VISA ATMs across the world
138DCB ATMs
10New Licenses
Existing Branches 82
**Network 35,000 +
GOA: (4)
� Mapusa (1)� Margao (1)� Panaji (1)
� Vasco -Da-Gama (1)
GUJARAT: (16)� Ahmedabad (3)
� Ankleshwar (1)� Vadodra (1)� Bhuj (1)
� Daman (1)� Dediapada (1)
� Gandhinagar (1)� Rajkot (1)� Sidhpur (1)
� Silvassa (1)� Surat (1)
� Vapi (1)� Mandvi (1)
� Netrang (1)
MAHARASHTRA: (35)
� Aurangabad (1)� Mumbai & Its
Suburbs (28)� Nanded (1)� Nashik (1)
� Pune (4)
ANDHRA PRADESH: (10)� Hyderabad (8)
� Warangal (2)
HARYANA: (1)� Gurgoan (1)
KARNATAKA: (4) � Bengaluru (4)
NEW DELHI: (6)� Chandni Chowk (1)
� Connaught Place (1)� Greater Kailash II (1)
� Kapashera Road (1)� Kondli (1)
� Preet Vihar (1)
RAJASTHAN: (1)
� Jodhpur (1)
TAMIL NADU: (2)� Chennai (2)
WEST BENGAL: (3)� Kolkata (3)
May-11:DCB Bank received permission from Reserve Bank of India to open 10 new branches (6 - metros and 4 - Semi urban / Rural)
Branch Network

Private & Confidential10
Products & Services
Retail Banking
Deposit Products:
� Current and Savings
� Term Deposits
� NRI Deposits
� Corporate Salary
� POS Terminals
� Lockers
Cards:
� ATM Card
� Debit Card
� Travel Card***
� Secured Card***
� Gift Card***
� Credit Card*
Payments:
� Remittances
� Bill / Utility Payments
� RTGS / NEFT
� On-line Share
Trading/Demat
� Tax Payments
Loans:
� Auto Loans*
� Commercial Vehicle*
� Construction
Equipment*
� Gold Loans
� Home Loans
� Loan Against Property
� Loan Against Shares
Wealth Management:
� Investment Advice
� Mutual Funds
� Life Insurance and
General Insurance
Services:
� 24/7 Phone Banking
� Any Branch Banking
Privilege Banking
Internet and Mobile Banking
SME, Corporate Banking, NBFCs, Co-operative Banks
� Current Account
� Trade Current Account
� Working Capital
� Term Loans
� Supply Chain
� Portfolio Buyout
� Import /Export
� Bills Collection
� Foreign Exchange
� Letters of Credit
� Guarantees
� Statutory Reserves Management
� Liquidity Management
� Trading in Government Securities
� Foreign Exchange
� Corporate Bonds
� CDs
� Equity Investment
Treasury, NBFCs, Co-operative Banks
� Cash Management**
� RTGS /NEFT
� Internet Banking
DCB offers a comprehensive range of products and services
*Offered to existing customers only ** DCB Bank has tie up with HDFC Bank and Axis Bank to provide customers with cash management facilities at over 500 locations across india
*** Launched on trial basis

Private & Confidential11
Feb 28, 2009 Jul 31, 2009 Sep 30, 2010
CRISIL
- Long
Term- BBB/Stable BBB +/Stable
- Short
TermP1 P1 P1
FITCH BBB/Negative BBB/Negative BBB/Stable
Brickworks - BWR A-/Stable BWR A-/Stable
Ratings

Private & Confidential12
Contents
DCB Bank – Overview
Business Strategy & Financials
Annexure
Private & Confidential13
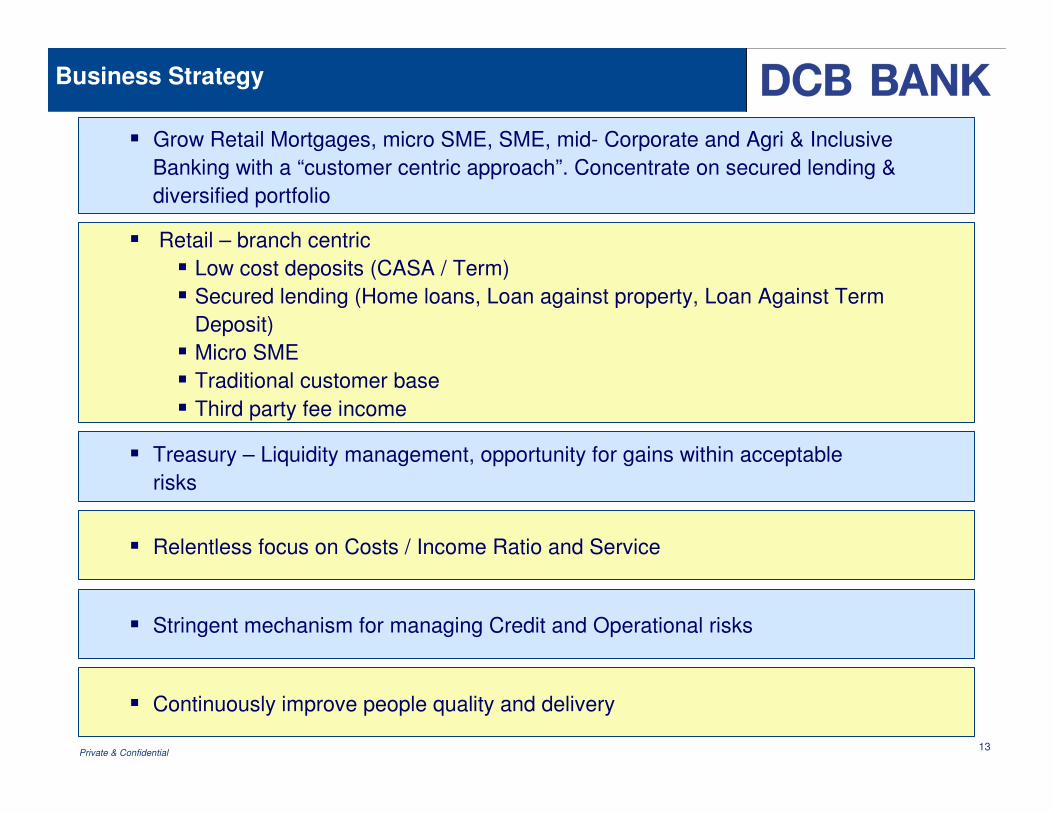
Business Strategy
� Grow Retail Mortgages, micro SME, SME, mid- Corporate and Agri & Inclusive
Banking with a “customer centric approach”. Concentrate on secured lending &
diversified portfolio
� Treasury – Liquidity management, opportunity for gains within acceptable
risks
� Relentless focus on Costs / Income Ratio and Service
� Stringent mechanism for managing Credit and Operational risks
� Continuously improve people quality and delivery
� Retail – branch centric
� Low cost deposits (CASA / Term)
� Secured lending (Home loans, Loan against property, Loan Against Term
Deposit)
� Micro SME
� Traditional customer base
� Third party fee income
Private & Confidential
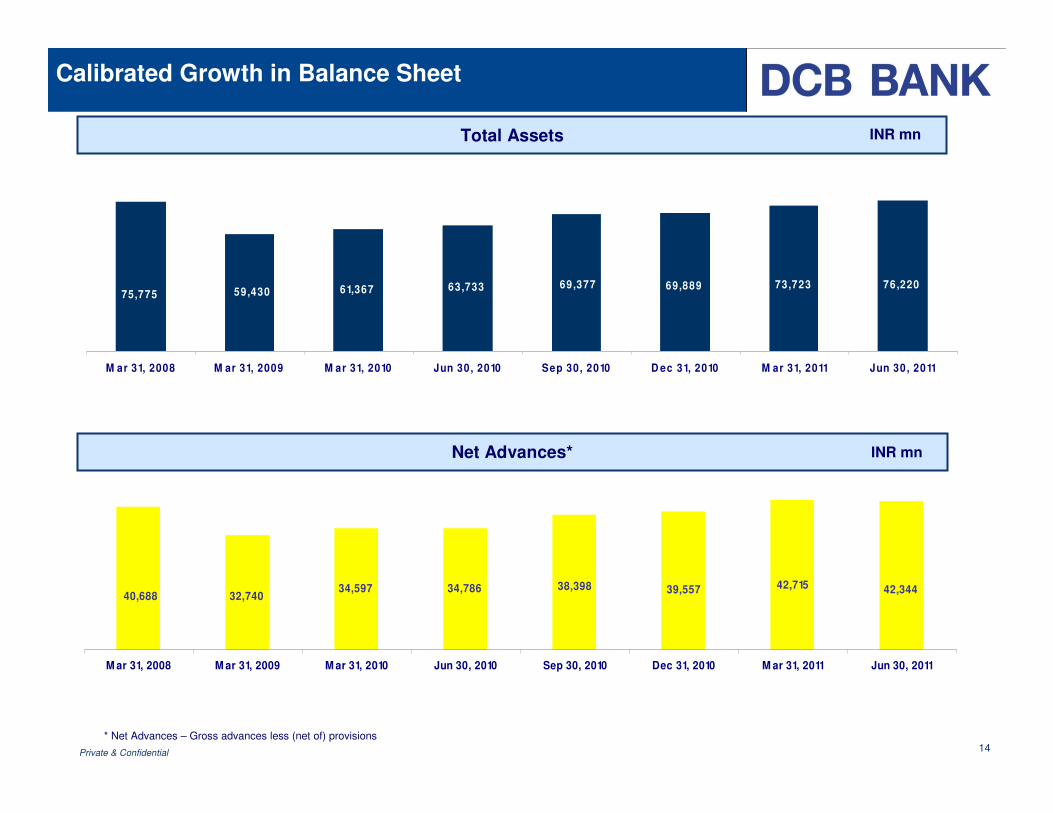
61,367 63,733 69,377 69,88959,43075,775
73,723 76,220
M ar 31, 2008 M ar 31, 2009 M ar 31, 2010 Jun 30, 2010 Sep 30, 2010 D ec 31, 2010 M ar 31, 2011 Jun 30, 2011
34,597 34,786 42,34442,71538,39840,688 32,740
39,557
M ar 31, 2008 M ar 31, 2009 M ar 31, 2010 Jun 30, 2010 Sep 30, 2010 Dec 31, 2010 M ar 31, 2011 Jun 30, 2011
14
Calibrated Growth in Balance Sheet
Total Assets INR mn
* Net Advances – Gross advances less (net of) provisions
Net Advances* INR mn

Private & Confidential
14,743 16,927 18,422 18,998 19,755 19,920
29,35634,301
18,70414,411
36,71233,74636,00231,220
41,735 28,101
3,957
4,271
1,5901,510
1,799 2,6013,173
1,652
M ar 31, 2008 M ar 31, 2009 M ar 31, 2010 Jun 30, 2010 Sep 30, 2010 Dec 31, 2010 M ar 31, 2011 Jun 30, 2011
C A SA T erm D epo sits Other D epo sits
15
Build Stable Deposit Base – Focus on CASA
INR mn
35.21%
81.17%
Mar 31,
2011
33.10%
78.98%
Dec 31,
2010
33.31%
81.95%
Jun 30,
2011
Mar
31, 2009
Mar 31,
2010
Jun
30,
2010
Sep 30,
2010
Retail
Deposits/
Total Deposits 67.53% 81.54% 79.77% 78.65%
CASA Ratio 31.01% 35.36% 36.02% 34.57%
Deposits INR mn
Access to low cost stable funding source to support advance growth without undue reliance on volatile wholesale funding

Private & Confidential
174 200 212 219 231 235
221 227
166222
378339336321298288
M ar 31, 2008 M ar 31, 2009 M ar 31, 2010 Jun 30, 2010 Sep 30, 2010 Dec 31, 2010 M ar 31, 2011 Jun 30, 2011
Retail CASA / Branch Retail Term Deposits / Branch
13,884 15,978 16,972 17,525 18,455
17,673 18,132
18,76217,76313,248
30,25027,08526,86325,69423,83023,056
M ar 31, 2008 M ar 31, 2009 M ar 31, 2010 Jun 30, 2010 Sep 30, 2010 Dec 31, 2010 M ar 31, 2011 Jun 30, 2011
Retail CASA Retail Term Deposits
16
Deposit Per Branch Improving
Retail CASA & Retail Term Deposits INR mn
Retail Deposits / Branch INR mn
*Note: based on 80 branches
*
Private & Confidential17
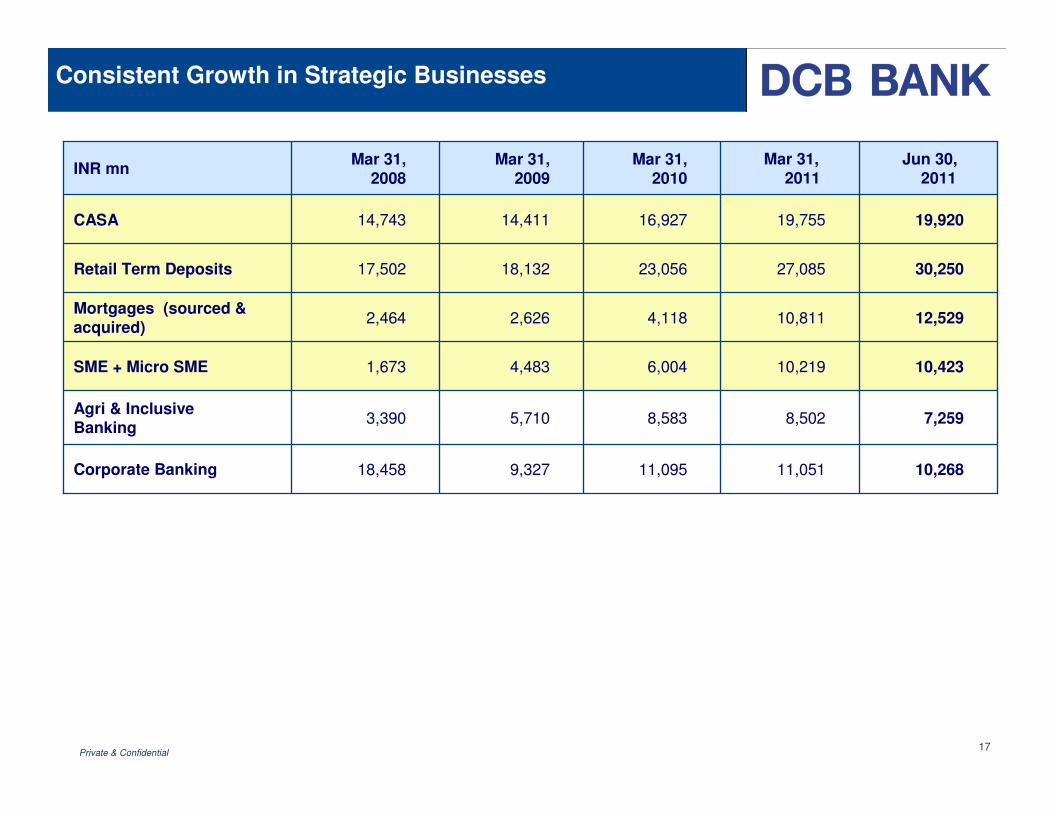
11,051
8,502
10,219
10,811
27,085
19,755
Mar 31, 2011
9,327
5,710
4,483
2,626
18,132
14,411
Mar 31, 2009
INR mnMar 31,
2008Mar 31,
2010
Jun 30, 2011
CASA 14,743 16,927 19,920
Retail Term Deposits 17,502 23,056 30,250
Mortgages (sourced & acquired)
2,464 4,118 12,529
SME + Micro SME 1,673 6,004 10,423
Agri & Inclusive Banking
3,390 8,583 7,259
Corporate Banking 18,458 11,095 10,268
Consistent Growth in Strategic Businesses
Private & Confidential18
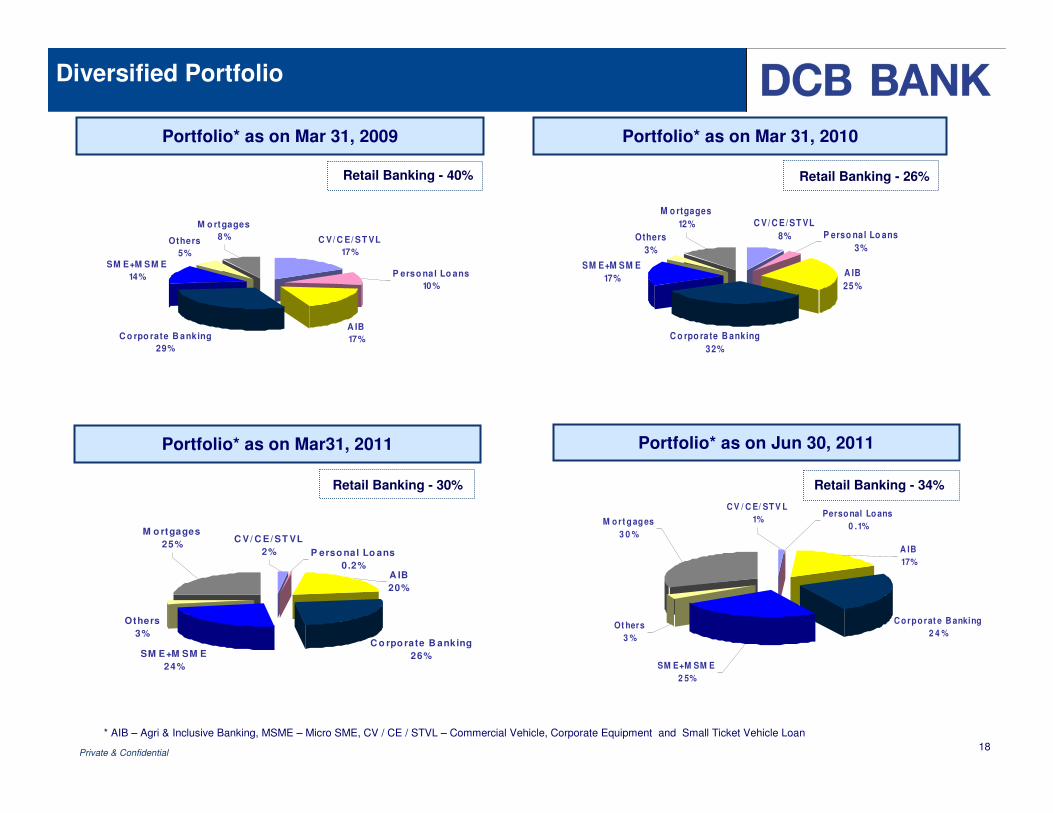
Diversified Portfolio
Retail Banking - 26%Retail Banking - 40%
Retail Banking - 34%
* AIB – Agri & Inclusive Banking, MSME – Micro SME, CV / CE / STVL – Commercial Vehicle, Corporate Equipment and Small Ticket Vehicle Loan
Portfolio* as on Mar 31, 2009 Portfolio* as on Mar 31, 2010
Portfolio* as on Jun 30, 2011
C o rpo rate B anking
32%
SM E+M SM E
17%
Others
3%
A IB
25%
C V/ C E/ ST VL
8%
M o rtgages
12%P erso nal Lo ans
3%
C V / C E/ ST V L
1%M o rt g ag es
3 0 %
Perso nal Lo ans
0 .1%
C o rpo rat e B anking
2 4 %
A IB
17%
Ot hers
3 %
SM E+M SM E
2 5%
C V/ C E/ ST VL
17%
A IB
17%C o rpo rate B anking
29%
SM E+M SM E
14%
Others
5%
P erso nal Lo ans
10%
M o rtgages
8%
Portfolio* as on Mar31, 2011
Retail Banking - 30%
SM E+M SM E
24%
Others
3%
A IB
20%
C o rpo rate B anking
26%
P erso nal Lo ans
0.2%
M o rtgages
25%C V/ C E/ ST VL
2%
Private & Confidential
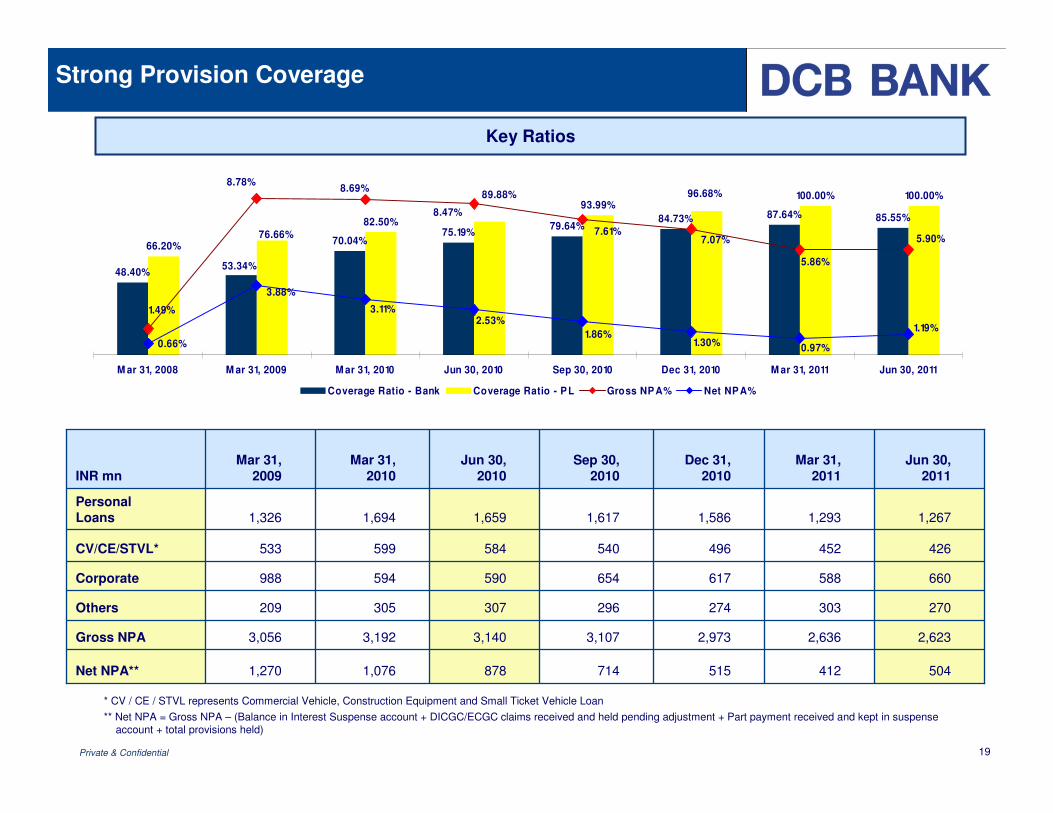
48.40%
70.04%75.19%
79.64%87.64% 85.55%
66.20%
82.50%
93.99%100.00% 100.00%
84.73%
53.34%
89.88%
76.66%
96.68%
0.66%
8.78%
1.49%
8.69%
8.47%
7.07%
5.86%
5.90%7.61%
1.19%
3.88%
3.11%2.53%
1.86%1.30%
0.97%
M ar 31, 2008 M ar 31, 2009 M ar 31, 2010 Jun 30, 2010 Sep 30, 2010 Dec 31, 2010 M ar 31, 2011 Jun 30, 2011
Coverage Ratio - Bank Coverage Ratio - P L Gross NP A% Net NP A%
19
Strong Provision Coverage
412
2,636
303
588
452
1,293
Mar 31,
2011
515
2,973
274
617
496
1,586
Dec 31,
2010INR mn
Mar 31,
2009
Mar 31,
2010
Jun 30,
2010
Sep 30,
2010
Jun 30,
2011
Personal
Loans 1,326 1,694 1,659 1,617 1,267
CV/CE/STVL* 533 599 584 540 426
Corporate 988 594 590 654 660
Others 209 305 307 296 270
Gross NPA 3,056 3,192 3,140 3,107 2,623
Net NPA** 1,270 1,076 878 714 504
Key Ratios
* CV / CE / STVL represents Commercial Vehicle, Construction Equipment and Small Ticket Vehicle Loan
** Net NPA = Gross NPA – (Balance in Interest Suspense account + DICGC/ECGC claims received and held pending adjustment + Part payment received and kept in suspense account + total provisions held)

Private & Confidential
1,376
258 275 274
1,088
284
1,044
881
248 250 273 292
1,064
3041,127
282
72.59%
78.07%
71.43%
72.31%71.59%
69.13%
76.27%
80.62%
FY09 FY10 Q1 FY11 Q2 FY11 Q3 FY 11 Q4 FY11 FY11 Q1 FY12
Operating Cost Staff Cost Cost Income Ratio
1,201
299 269 260
1,121
234
1,972
1,420
433 464 493 502
1,891
5191,071
292
FY09 FY10 Q1 FY11 Q2 FY11 Q3 FY 11 Q4 FY11 FY11 Q1 FY12
Other Income Net Interest Income
20
Investment in Front Line for CASA Growth
Operating Cost INR mn
Operating Income INR mn
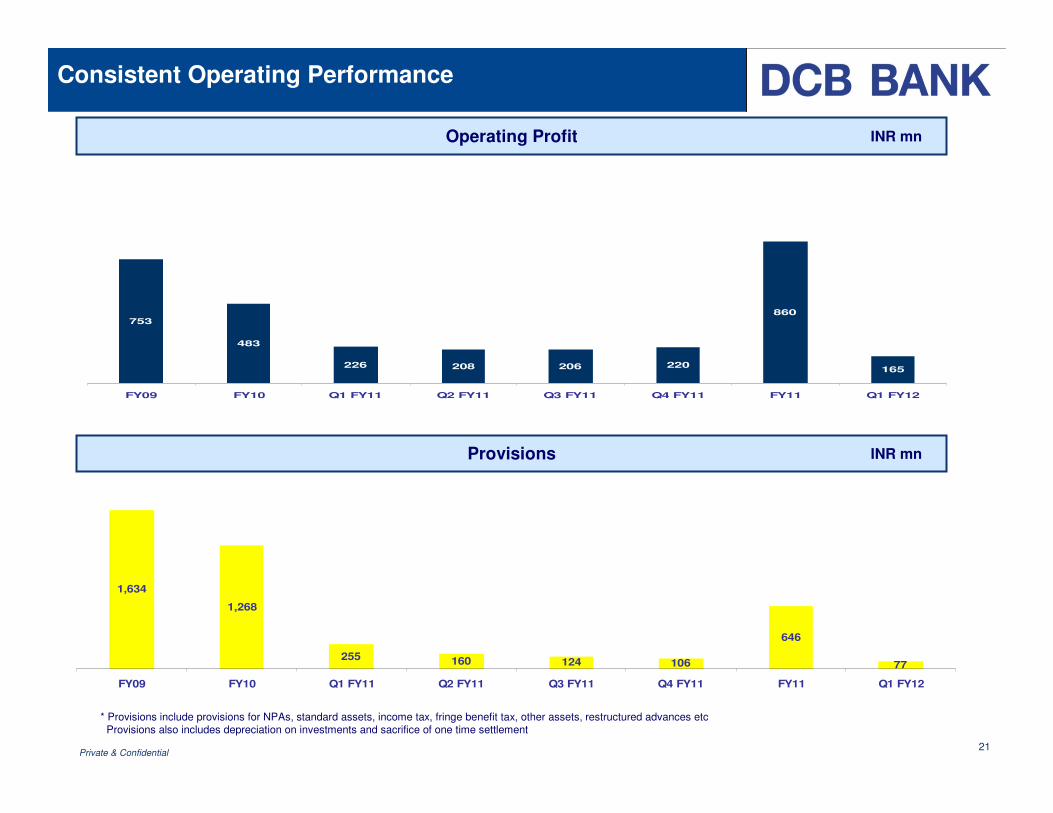
Private & Confidential
753
483
226 208 206 220
860
165
FY09 FY10 Q1 FY11 Q2 FY11 Q3 FY11 Q4 FY11 FY11 Q1 FY12
1,634
1,268
255 160 124 106
646
77
FY09 FY10 Q1 FY11 Q2 FY11 Q3 FY11 Q4 FY11 FY11 Q1 FY12
21
Consistent Operating Performance
Provisions INR mn
Operating Profit INR mn
* Provisions include provisions for NPAs, standard assets, income tax, fringe benefit tax, other assets, restructured advances etc Provisions also includes depreciation on investments and sacrifice of one time settlement

Private & Confidential
88214
1138248
(29)
(785)(881)
FY09 FY10 Q1 FY11 Q2 FY11 Q3 FY11 Q4 FY11 FY11 Q1 FY12
22
Bottom Line Improvement
Net Profit / Loss * INR mn
* Net Profit / (loss) represents post tax numbers
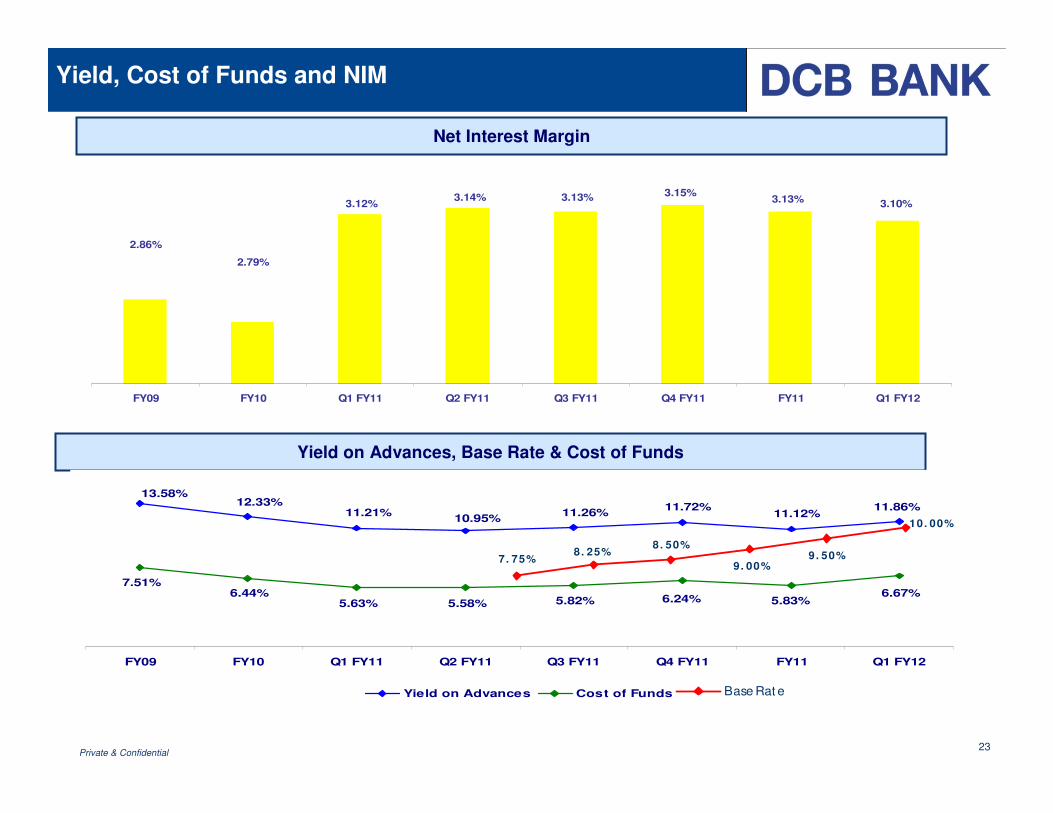
Private & Confidential23
Net Interest Margin
Yield on Advances, Base Rate & Cost of Funds
3.10%3.13%3.15%3.13%3.14%
3.12%
2.79%
2.86%
FY09 FY10 Q1 FY11 Q2 FY11 Q3 FY11 Q4 FY11 FY11 Q1 FY12
13.58%12.33%
11.21%10.95%
11.26%11.72%
11.12%11.86%
7.51%6.44%
5.63% 5.58% 5.82% 6.24% 5.83%6.67%
FY09 FY10 Q1 FY11 Q2 FY11 Q3 FY11 Q4 FY11 FY11 Q1 FY12
Yield on Advances Cost of Funds
Yield, Cost of Funds and NIM
10. 00%
9. 50%9. 00%
8. 50%8. 25%
7. 75%
Base Rat e

Private & Confidential24
Other Income
293
12
-
25
16
74
166
Q4FY11
1,121
106
-
90
11
253
661
FY11
260
22
-
17
(1)
57
165
Q3FY11INR mn FY09 FY10 Q1FY11 Q2FY11 Q1FY12
Commission, exchange and
brokerage768 664 156 175 170
Sale of investments 20 178 86 36 48
Sale of land, buildings and
other assets47 (3) (2) (2) (14)
Exchange transactions 224 64 18 29 21
Lease income - 9 - - -
Miscellaneous income 142 159 41 31 10
Total 1,201 1,071 299 269 235
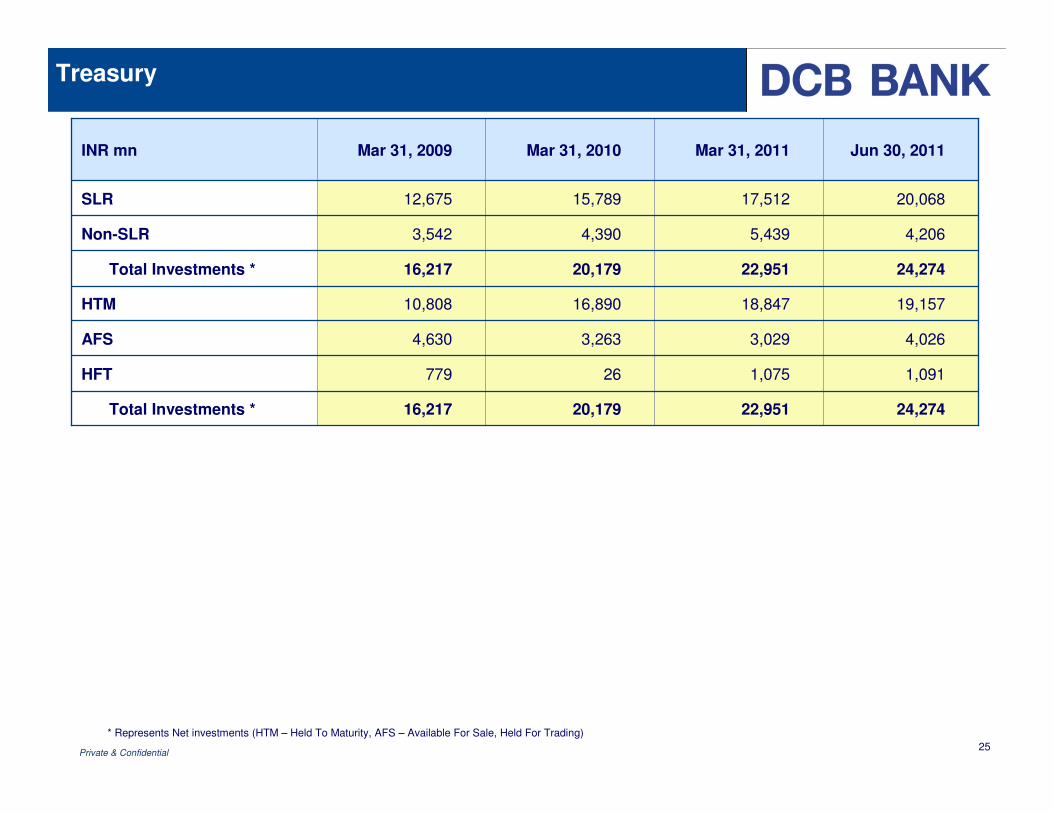
Private & Confidential25
Treasury
16,217
779
4,630
10,808
16,217
3,542
12,675
Mar 31, 2009INR mn Mar 31, 2010 Mar 31, 2011 Jun 30, 2011
SLR 15,789 17,512 20,068
Non-SLR 4,390 5,439 4,206
Total Investments * 20,179 22,951 24,274
HTM 16,890 18,847 19,157
AFS 3,263 3,029 4,026
HFT 26 1,075 1,091
Total Investments * 20,179 22,951 24,274
* Represents Net investments (HTM – Held To Maturity, AFS – Available For Sale, Held For Trading)

Private & Confidential26
Capital Adequacy Ratios
DCB has following approvals for raising capital in the future:� Tier I – QIP not exceeding INR 3,000 mn� Tier I – Rights not exceeding INR 2,000 mn
Capital Adequacy Ratios – Basel II
11.50% 11.40% 11.26% 11.13% 11.07%
1.80%
2.92%2.40% 2.31% 2.26% 2.15% 1.85%
11.10%11.93%
13.30%
14.85%13.80% 13.57% 13.39% 13.25%
12.92%
M ar 31, 2009 M ar 31, 2010 Jun 30, 2010 Sep 30, 2010 D ec 31, 2010 M ar 31, 2011 Jun 30, 2011
T ier I T ier II

Private & Confidential27
Contents
DCB Bank – Overview
Business Strategy & Financials
Annexure

Private & Confidential 28
Balance Sheet
31.01%
46,469
32,058
14,411
Mar 31,
2009INR mn
Mar 31,
2010
Jun 30,
2010
Sep 30,
2010
Dec 31,
2010
Mar 31,
2011
Jun 30,
2011
CASA 16,927 18,422 18,998 18,704 19,755 19,920
Other Deposits 30,946 32,730 35,953 37,802 36,347 39,885
Total Deposits 47,873 51,152 54,951 56,506 56,102 59,805
CASA Ratio 35.36% 36.02% 34.57% 33.10% 35.21% 33.31%
70.46%
2,450
1,489
32,740
16,217
6,534
3,523
3,455
46,469
5,957
Mar 31,
2009
68.00%
1,918
1,326
34,786
20,057
5,647
2,754
3,840
51,152
5,960
Jun 30,
2010
69.88%
2,518
1,308
38,398
20,975
6,177
2,747
5,648
54,951
6,003
Sep 30,
2010
70.00%
2,106
1,294
39,557
21,771
5,162
2,736
4,534
56,506
6,086
Dec 31,
2010
76.14%
1,912
1,275
42,715
22,951
4,871
2,800
8,607
56,102
6,187
Mar 31, 2011INR mn
Mar 31,
2010
Jun 30,
2011
Shareholder’s Equity 5,990 6,273
Deposits 47,873 59,805
Borrowings 1 5,035 7,238
Other Liabilities & Provisions 1 2,447 2,876
Cash, Inter-bank, etc 3,324 6,407
Investments 20,179 24,274
Advances 34,597 42,344
Fixed Assets 1,358 1,238
Other Assets 1,909 1,957
Credit Deposit Ratio 72.27% 70.80%
1 : Subordinated debt included in borrowings since March 31, 2010 as per RBI guidelines, same included in other liabilities and provisions in earlier periods

Private & Confidential29
Profit & Loss
76.27%
(881)
(1,634)
753
(2,420)
3,173
1,201
1,972
FY09
71.43%
214
(646)
860
(2,152)
3,012
1,121
1,891
FY11INR mn FY10 Q1FY11 Q2FY11 Q3FY11 Q4FY11 Q1FY12
Net Interest Income 1,420 433 464 493 502 519
Other Income 1,071 299 269 260 292 234
Operating Income 2,491 732 733 753 794 753
Operating Expenses (2,008) (506) (525) (547) (574) (588)
Operating Profit 483 226 208 206 220 165
Total Provisions (1,268) (255) (160) (124) (107) (77)
PAT (785) (29) 48 82 113 88
Cost Income Ratio 80.62% 69.13% 71.59% 72.59% 72.31% 78.07%

Private & Confidential30
Thank you