Investor Presentation Q1 14 - BMO 2014 Analyst... · 2014-02-25 · Investor Presentation • Q3...
26
Investor Presentation Q1 14 For the Quarter Ended – January 31, 2014 February 25 2014
Transcript of Investor Presentation Q1 14 - BMO 2014 Analyst... · 2014-02-25 · Investor Presentation • Q3...

Investor Presentation Q1 14For the Quarter Ended – January 31, 2014
February 25 2014

2Investor Presentation • Q3 2012 2February 25 • 2014
Caution Regarding Forward-Looking Statements
Bank of Montreal’s public communications often include written or oral forward-looking statements. Statements of this type are included in this document, and may be included in other filings with Canadian securities regulators or the U.S. Securities and Exchange Commission, or in other communications. All such statements are made pursuant to the “safe harbor” provisions of, and are intended to be forward-looking statements under, the United States Private Securities Litigation Reform Act of 1995 and any applicable Canadian securities legislation. Forward-looking statements may involve, but are not limited to, comments with respect to our objectives and priorities for 2014 and beyond, our strategies or future actions, our targets, expectations for our financial condition or share price, and the results of or outlook for our operations or for the Canadian, U.S. and international economies.
By their nature, forward-looking statements require us to make assumptions and are subject to inherent risks and uncertainties. There is significant risk that predictions, forecasts, conclusions or projections will not prove to be accurate, that our assumptions may not be correct and that actual results may differ materially from such predictions, forecasts, conclusions or projections. We caution readers of this document not to place undue reliance on our forward-looking statements as a number of factors could cause actual future results, conditions, actions or events to differ materially from the targets, expectations, estimates or intentions expressed in the forward-looking statements.
The future outcomes that relate to forward-looking statements may be influenced by many factors, including but not limited to: general economic and market conditions in the countries in which we operate; weak, volatile or illiquid capital and/or credit markets; interest rate and currency value fluctuations; changes in monetary, fiscal or economic policy; the degree of competition in the geographic and business areas in which we operate; changes in laws or in supervisory expectations or requirements, including capital, interest rate and liquidity requirements and guidance; judicial or regulatory proceedings; the accuracy and completeness of the information we obtain with respect to our customers and counterparties; our ability to execute our strategic plans and to complete and integrate acquisitions, including obtaining regulatory approvals; critical accounting estimates and the effect of changes to accounting standards, rules and interpretations on these estimates; operational and infrastructure risks; changes to our credit ratings; general political conditions; global capital markets activities; the possible effects on our business of war or terrorist activities; disease or illness that affects local, national or international economies; natural disasters and disruptions to public infrastructure, such as transportation, communications, power or water supply; technological changes; and our ability to anticipate and effectively manage risks associated with all of the foregoing factors.
We caution that the foregoing list is not exhaustive of all possible factors. Other factors could adversely affect our results. For more information, please see the discussion on pages 30 to 31 of BMO’s 2013 Annual Report, which outlines in detail certain key factors that may affect Bank of Montreal’s future results. When relying on forward-looking statements to make decisions with respect to Bank of Montreal, investors and others should carefully consider these factors, as well as other uncertainties and potential events, and the inherent uncertainty of forward-looking statements. Bank of Montreal does not undertake to update any forward-looking statements, whether written or oral, that may be made from time to time by the organization or on its behalf, except as required by law. The forward-looking information contained in this document is presented for the purpose of assisting our shareholders in understanding our financial position as at and for the periods ended on the dates presented, as well as our strategic priorities and objectives, and may not be appropriate for other purposes.
Assumptions about the level of default and losses on default were material factors we considered when establishing our expectations regarding the future performance of the transactions into which our credit protection vehicle has entered. Among the key assumptions were that the level of default and losses on default will be consistent with historical experience. Material factors that were taken into account when establishing our expectations regarding the future risk of credit losses in our credit protection vehicle and risk of loss to Bank of Montreal included industry diversification in the portfolio, initial credit quality by portfolio, the first-loss protection incorporated into the structure and the hedges into which Bank of Montreal has entered.
Assumptions about the performance of the Canadian and U.S. economies, as well as overall market conditions and their combined effect on our business, are material factors we consider when determining our strategic priorities, objectives and expectations for our business. In determining our expectations for economic growth, both broadly and in the financial services sector, we primarily consider historical economic data provided by the Canadian and U.S. governments and their agencies. See the Economic Review and Outlook section of this interim MD&A.
Non-GAAP Measures
Bank of Montreal uses both GAAP and non-GAAP measures to assess performance. Readers are cautioned that earnings and other measures adjusted to a basis other than GAAP do not have standardized meanings under GAAP and are unlikely to be comparable to similar measures used by other companies. Reconciliations of GAAP to non-GAAP measures as well as the rationale for their use can be found in Bank of Montreal’s First Quarter 2014 Report to Shareholders and Bank of Montreal’s 2013 Annual Report, all of which are available on our website at www.bmo.com/investorrelations.
Examples of non-GAAP amounts or measures include: efficiency and leverage ratios; revenue and other measures presented on a taxable equivalent basis (teb); amounts presented net of applicable taxes; adjusted net income, revenues, provision for credit losses, non-interest expenses, earnings per share, effective tax rate, ROE, efficiency ratio and other adjusted measures which exclude the impact of certain items such as credit-related items on the purchased performing loan portfolio, run-off structured credit activities, acquisition integration costs, amortization of acquisition-related intangibles assets and, decrease (increase) in collective allowance for credit losses.
Bank of Montreal provides supplemental information on combined business segments to facilitate comparisons to peers.
Forward Looking Statements & Non-GAAP Measures

Strategic Highlights Q1 14For the Quarter Ended – January 31, 2014
Bill DowneChief Executive Officer
February 25 2014

4Strategic Highlights | February 25 • 2014
1Adjusted measures are non-GAAP measures. See slide 2 of this document, page 34 of BMO’s 2013 Annual Report and page 21 of BMO’s First Quarter 2014 Report to ShareholdersReported results: EPS $1.58; revenue $4,122MM; ROE 14.2%. See slide 25 for adjustments to reported results.
$1.1 billion in both reported and adjusted1 earnings
Adjusted EPS up 7% to $1.61 Revenues up 8% to $4.1 billion
ROE 14.5%
Basel III CET1 ratio of 9.3%
Strong volume growth with loans up 11% and deposits up 13%
Q1 2014 Financial HighlightsResults reflect strong operating group performance and revenue growth

5Strategic Highlights | February 25 • 2014
1 Adjusted measures are non-GAAP measures. See slide 2 of this document, page 34 of BMO’s 2013 Annual Report and page 21 of BMO’s First Quarter 2014 Report to Shareholders. For details on adjustments refer to slide 25. Reported and adjusted revenue contribution by operating group are equal. For details on reported net income for operating groups please refer to slides 10 to 13 of this document.
Adjusted1 Net Income (C$MM)
Canadian P&C revenue up 7% Y/Y with strong operating leverage and robust volume growth
Excellent volume growth from U.S. commercial with core C&I loans up 14% Y/Y and total deposits up $1.1B
Strong performance in traditional wealth businesses with adjusted earnings up 17% Y/Y
Revenue growth of 9% Y/Y in BMO CM from strength in both I&CB and Trading Products
Operating Group Performance Good momentum and attractive business mix
450
194 168
298
486
164 183
277
CanadianP&C
U.S. P&C* WealthManagement
BMO CM
Q1'13 Q1'14* In U.S.$MM
** Excludes Corporate Services
Q1’14 Operating Group Revenue**
Wealth Management
19%
BMO CM23%
U.S. P&C18%
Canadian P&C38%
Wealth Management
21%

6Strategic Highlights | February 25 • 2014
Strategic PrioritiesA clear vision: To be the bank that defines great customer experience
Expand strategically in select global markets to create future growth.
12345
Achieve industry-leading customer loyalty by delivering on our brand promise.
Enhance productivity to drive performance and shareholder value.
Leverage our consolidated North American platform to deliver quality earnings growth.
Ensure our strength in risk management underpins everything we do for our customers.

Chief Financial OfficerTom Flynn
Q1 Financial ResultsFor the Quarter Ended – January 31, 2014
February 25 2014
14

8Financial Results | February 25 • 2014
Adjusted ($MM) 1,2 Q1 13 Q4 13 Q1 14
Revenue 3,812 4,010 4,122
Expense 2,444 2,485 2,653
Net Income 1,029 1,088 1,083
Diluted EPS ($) 1.50 1.62 1.61
ROE (%) 14.8 15.0 14.5
Basel III Common Equity Tier 1 Ratio (%) 9.4 9.9 9.3
Adjusted EPS up 7% Y/Y
Good growth in Canadian P&C and Wealth Management
Revenue growth of 8% Y/Y reflecting strong volume growth in Canadian P&C, growth in Wealth Management and BMO CM
PCL relatively flat Y/Y and down $41MM Q/Q
Expenses up 8% Y/Y reflecting higher employee-related costs, including severance and higher technology and support costs related to a changing business and regulatory environment
Q1’14 includes $66MM ($46MM after-tax) for stock-based compensation for employees eligible to retire
Adjusted effective tax rate3 of 20.9% compared to 21.5% in Q4’13 and 19.0% in Q1’13
1 See slide 25 for adjustments to reported results. Effective Q1’14 credit-related items on purchased performing loan portfolio, acquisition integration costs and run-off structured credit activities are no longer adjusting items2 Reported Revenue: Q1’13 $4,032MM; Q4’13 $4,138MM; Q1’14 $4,122MM; Reported Expenses: Q1’13 $2,570MM; Q4’13 $2,580MM; Q1’14 $2,684MM;
Reported Net Income: Q1’13 $1,036MM; Q4’13 $1,074MM; Q1’14 $1,061MM; Reported EPS – diluted: Q1’13 $1.51; Q4’13 $1.60; Q1’14 $1.58; Reported ROE: Q1’13 14.9%; Q4’13 14.8%; Q1’14 14.2%3 Reported effective tax rate: Q1’13 19.3%; Q4’13 21.6%; Q1’14 20.8%
Q1 2014 - Financial HighlightsAdjusted Net Income of $1.1B and Adjusted EPS growth of 7%
Adjusted measures are non-GAAP measures. See slide 2 of this document, page 34 of BMO’s 2013 Annual Report and page 21 of BMO’s First Quarter 2014 Report to Shareholders
9Financial Results | February 25 • 2014
9.4 9.7 9.6 9.99.3
Q1'13 Q2'13 Q3'13 Q4'13 Q1'14CET 1 (%)
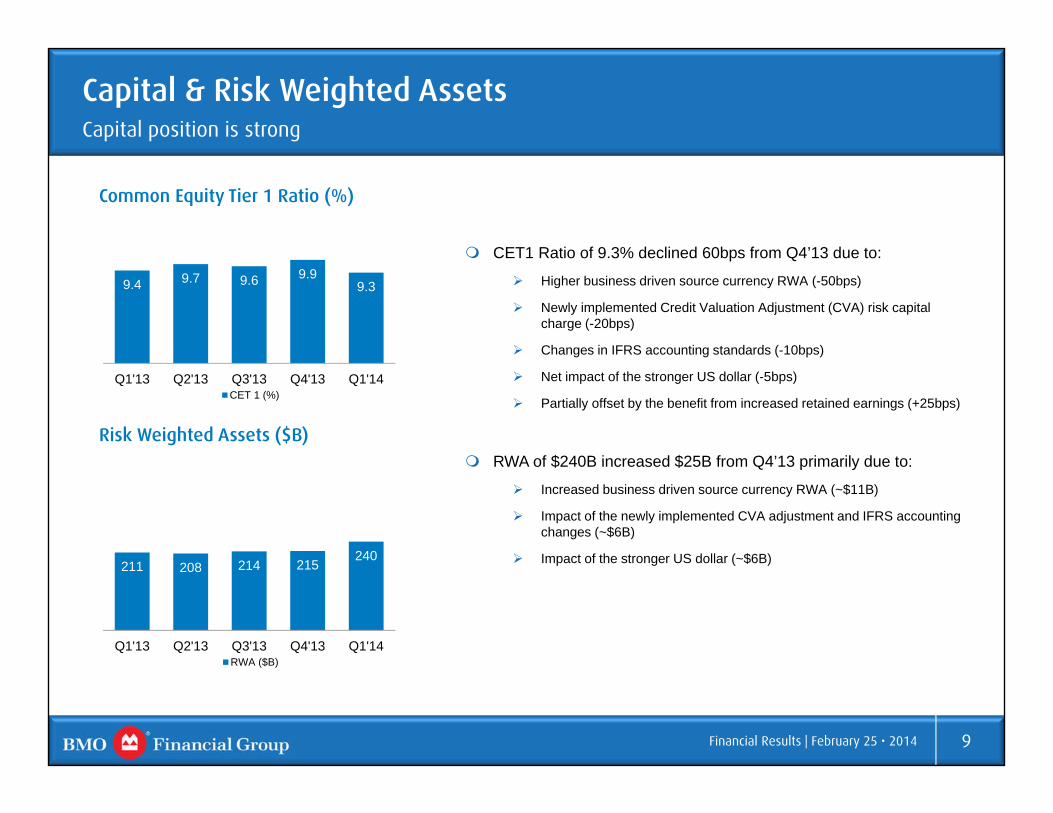
Capital & Risk Weighted AssetsCapital position is strong
Common Equity Tier 1 Ratio (%)
211 208 214 215240
Q1'13 Q2'13 Q3'13 Q4'13 Q1'14RWA ($B)
Risk Weighted Assets ($B)
CET1 Ratio of 9.3% declined 60bps from Q4’13 due to:
Higher business driven source currency RWA (-50bps)
Newly implemented Credit Valuation Adjustment (CVA) risk capital charge (-20bps)
Changes in IFRS accounting standards (-10bps)
Net impact of the stronger US dollar (-5bps)
Partially offset by the benefit from increased retained earnings (+25bps)
RWA of $240B increased $25B from Q4’13 primarily due to:
Increased business driven source currency RWA (~$11B)
Impact of the newly implemented CVA adjustment and IFRS accounting changes (~$6B)
Impact of the stronger US dollar (~$6B)

10Financial Results | February 25 • 2014
450
422
489
461486
270 264 264 260 261
Q1'13 Q2'13 Q3'13 Q4'13 Q1'14
As Reported ($MM) Q1 13 Q4 13 Q1 14
Revenue (teb) 1,503 1,566 1,602
PCL 128 166 141
Expenses 780 791 813
Net Income 447 458 484
Adjusted Net Income 450 461 486
Efficiency Ratio (%) 51.9 50.5 50.8
Adjusted Net Income ($MM) Net Interest Margin (bps)
Canadian Personal & Commercial BankingContinued momentum in revenue and net income growth with positive operating leverage
Adjusted net income up 8% Y/Y. Up 6% Q/Q due to higher revenues and lower PCL
Strong revenue growth of 7% Y/Y and 2% Q/Q Volume growth continues. Total loan growth driven by
personal and commercial, up 10% Y/Y and 2% Q/Q. Deposits up 11% Y/Y and 4% Q/Q
NIM up 1bp Q/Q
PCL up Y/Y due to higher commercial provisions. Down Q/Q due to lower provisions in the consumer portfolio
Expenses up 4% Y/Y
Operating leverage of 2.3% and efficiency ratio of 50.8%, 110 bps better Y/Y
See slide 25 for adjustments to reported results. Adjusted measures are non-GAAP measures. See slide 2 of this document, page 34 of BMO’s 2013 Annual Report and page 21 of BMO’s First Quarter 2014 Report to Shareholders

11Financial Results | February 25 • 2014
Net Interest Margin (bps)
194 159 157
109 164
412 410 392 382 383
Q1'13 Q2'13 Q3'13 Q4'13 Q1'14
(Amounts in US$MM)As Reported (US$MM) Q1 13 Q4 13 Q1 14
Revenue (teb) 746 688 693
PCL 33 92 18
Expenses 459 458 464
Net Income 180 98 153
Adjusted Net Income 194 109 164
Adjusted Efficiency Ratio1 (%) 58.8 64.1 64.6
Adjusted Net Income (US$MM)
1 Reported efficiency ratio: Q1’13 61.5%; Q4’13 66.7%; Q1’14 67.0%
U.S. Personal & Commercial BankingQ/Q net income up with stable revenue and good credit performance
See slide 25 for adjustments to reported results
Adjusted net income up $55MM Q/Q and down from a strong quarter a year ago
Revenue Down Y/Y as loan growth more than offset by lower
NIM and strong prior year mortgage related NIR
Up Q/Q primarily due to higher commercial volumes and better NIM
Total loans up 2% Y/Y and 1% Q/Q with strong commercial loan growth Core C&I balances up 14% Y/Y and 2% Q/Q
NIM stable Q/Q
PCL down from above trend Q4 level and benefited from recoveries in the current quarter
Expenses remain well managed
Adjusted measures are non-GAAP measures. See slide 2 of this document, page 34 of BMO’s 2013 Annual Report and page 21 of BMO’s First Quarter 2014 Report to Shareholders

12Financial Results | February 25 • 2014
298 262 269
217 277
20.5 18.3 18.2 15.0 18.8
Q1'13 Q2'13 Q3'13 Q4'13 Q1'14
Adjusted Net Income ($MM) Return on Equity (%)
BMO Capital MarketsGood revenue performance with strong contribution from U.S. business
See slide 25 for adjustments to reported results
Adjusted Net Income down 7% Y/Y; Q/Q up 27%
Revenue up 9% Y/Y and 22% Q/Q
Higher equity underwriting fees, securities gains in corporate banking and higher trading revenue
Expenses up 16% Y/Y
Higher expenses from a changing business and regulatory environment with higher employee-related costs, including severance, and increased support costs
Q1 expenses include $12MM for stock-based compensation for employees eligible to retire
PCL up Y/Y
ROE 18.8%, up from 15.0% in Q4
As Reported ($MM) Q1 13 Q4 13 Q1 14
Trading Products Revenue 536 482 590
I&CB Revenue 359 315 384
Revenue (teb) 895 797 974
PCL (15) (17) (1)
Expenses 524 526 609
Net Income 298 217 277
Adjusted Net Income 298 217 277
Efficiency Ratio (%) 58.5 66.1 62.5
Adjusted measures are non-GAAP measures. See slide 2 of this document, page 34 of BMO’s 2013 Annual Report and page 21 of BMO’s First Quarter 2014 Report to Shareholders

13Financial Results | February 25 • 2014
104 112 131
249
123
64 35
93
69
60
Q1'13 Q2'13 Q3'13 Q4'13 Q1'14
Insurance Adjusted Net Income ($MM)
Traditional Wealth BusinessesAdjusted Net Income ($MM)
As Reported ($MM) Q1 13 Q4 13 Q1 14
Revenue (teb) 778 1,040 867
PCL 2 1 (1)
Expenses 571 602 644
Net Income 162 311 175
Adjusted Net Income 168 318 183
Adjusted Efficiency Ratio1 (%) 72.3 57.1 73.1
1 Reported efficiency ratio: Q1’13 73.3%; Q4’13 57.9%; Q1’14 74.3%.
Wealth ManagementContinued strong performance in traditional wealth businesses with earnings up 17% Y/Y
Adjusted net income up 8% Y/Y; down 43% Q/Q. Q4 included a $121MM after-tax security gain
Continued strong performance in traditional wealth businesses with revenue up 13%. Expenses up 13% due to higher revenue-based and support costs driven by growth in businesses
Q1 expenses include $21MM for stock-based compensation for employees eligible to retire
Continued good underlying Insurance results
AUM/AUA up 19% Y/Y driven by market appreciation, the stronger U.S. dollar and growth in new client assets
See slide 25 for adjustments to reported results
167 171 174 184 196
333 350 351 368 401
Q1'13 Q2'13 Q3'13 Q4'13 Q1'14
AUA AUM
Adjusted Net Income ($MM) AUM/AUA ($B)
Adjusted measures are non-GAAP measures. See slide 2 of this document, page 34 of BMO’s 2013 Annual Report and page 21 of BMO’s First Quarter 2014 Report to Shareholders

14Financial Results | February 25 • 2014
Adjusted net loss of $41MM compared to net loss of $79MM a year ago
Higher revenues primarily due to the purchased performing loan portfolio now included in adjusted results, partially offset by a higher group teb offset
PCL relatively flat
Lower expenses reflecting lower support costs retained in Corporate and reduced costs associated with the impaired real estate secured asset portfolio
Q/Q adjusted net income $19MM lower
Higher revenues primarily due to the purchased performing loan portfolio, partially offset by a variety of other items, none of which were individually significant
Lower PCL recoveries primarily due to provisions in respect of the purchased performing loan portfolio now included in adjusted results
Expenses relatively flat
Corporate ServicesAdjusted results up Y/Y, down Q/Q
See slide 25 for adjustments to reported results. All adjustments impact Corporate Services with the exception of amortization of acquisition-related intangible assets
2 Operating group revenues, income taxes and net interest margin are stated on a taxable equivalent basis (teb). This teb adjustment is offset in Corporate Services, and total BMO revenue, income taxes and net interest margin are stated on a GAAP basis. The Group teb offset: Q1’13 $(64)MM; Q4’13 $(89)MM; Q1’14 $(85)MM
1 Reported Revenue: Q1’13 $113MM; Q4’13 $19MM; Q1’14 $(69)MM; Reported PCL (recovery): Q1’13 $31MM; Q4’13 $(57)MM; Q1’14 $(59)MM; Reported expenses: Q1’13 $238MM; Q4’13 $184MM; Q1’14 $117MM; Reported Net Income: Q1’13 $(50)MM; Q4’13 $(14)MM; Q1’14 $(41)MM
Adjusted ($MM)1,2 Q1 13 Q4 13 Q1 14
Revenue (teb)2 (107) (109) (69)
PCL (recovery) (51) (106) (59)
Expenses 143 120 117
Net Income (79) (22) (41)
Adjusted measures are non-GAAP measures. See slide 2 of this document, page 34 of BMO’s 2013 Annual Report and page 21 of BMO’s First Quarter 2014 Report to Shareholders

Risk Review
Surjit RajpalChief Risk Officer
Q1 14February 25 2014
For the quarter ended January 31, 2014

Risk Review | February 25 • 2014 16
Loan Portfolio OverviewCanadian and US portfolios well diversified by industry
Gross Loans & Acceptances By Industry(C$B)
Canada & Other1 US Total % of
Total
Residential Mortgages 89.3 8.0 97.3 33%
Personal Lending 49.3 15.3 64.6 22%
Credit Cards 7.5 0.5 8.0 3%
Total Consumer 146.1 23.8 169.9 58%
Financial 13.1 9.4 22.5 8%
Service Industries 10.9 8.2 19.1 7%
Commercial Real Estate 10.5 6.3 16.8 6%
Manufacturing 4.9 7.4 12.3 4%
Retail Trade 7.4 4.0 11.4 4%
Agriculture 7.0 1.7 8.7 3%
Wholesale Trade 3.3 4.0 7.3 3%
Other Commercial & Corporate2 12.6 10.9 23.5 8%
Total Commercial & Corporate 69.7 51.9 121.6 42%
Total Loans 215.8 75.7 291.5 100%
1 Commercial & Corporate includes ~$10.3B from Other Countries2 Other Commercial & Corporate includes industry segments that are each <2% of total loans
146.1
23.851.2 41.6
18.5 10.3
Canada & Other Countries US
Loans by Geography and Operating Group (C$B)
P&C/Wealth Management - Consumer
P&C/Wealth Management - Commercial
BMO Capital Markets
4% loan growth Q/Q broadly spread across portfolios
Risk Review | February 25 • 2014 17
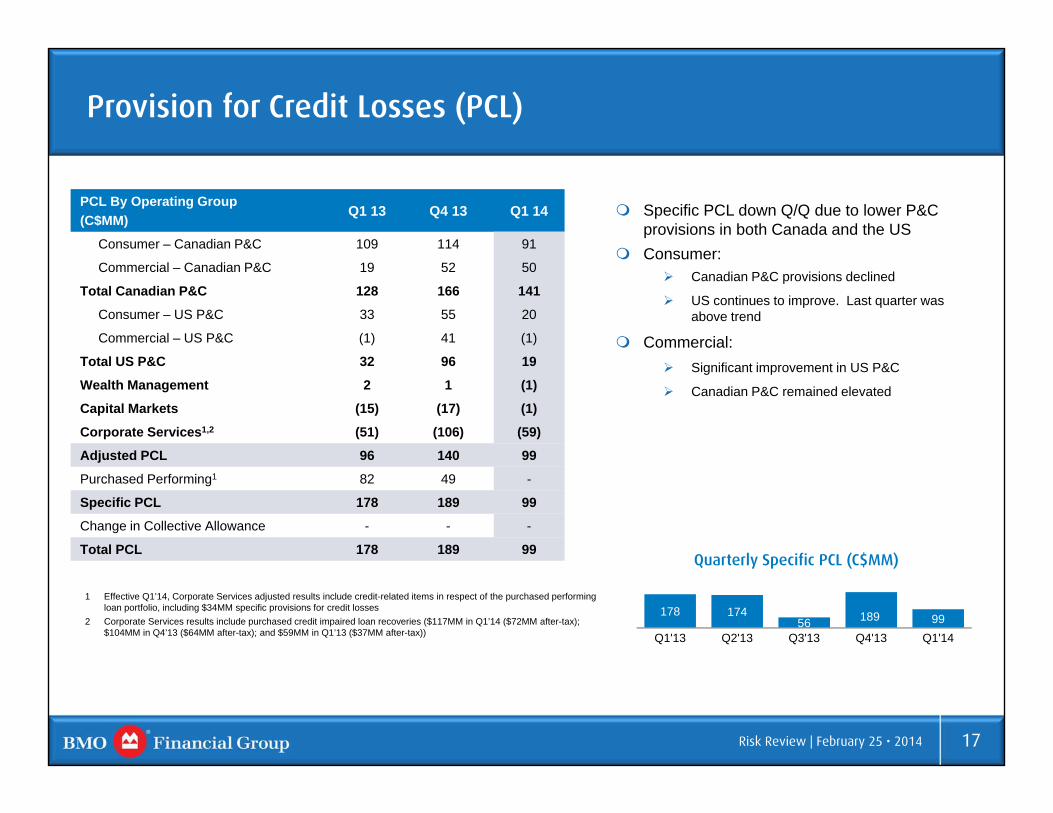
178 17456 189 99
Q1'13 Q2'13 Q3'13 Q4'13 Q1'14
Quarterly Specific PCL (C$MM)
1 Effective Q1’14, Corporate Services adjusted results include credit-related items in respect of the purchased performing loan portfolio, including $34MM specific provisions for credit losses
2 Corporate Services results include purchased credit impaired loan recoveries ($117MM in Q1’14 ($72MM after-tax); $104MM in Q4’13 ($64MM after-tax); and $59MM in Q1’13 ($37MM after-tax))
Provision for Credit Losses (PCL)
Specific PCL down Q/Q due to lower P&C provisions in both Canada and the US
Consumer: Canadian P&C provisions declined
US continues to improve. Last quarter was above trend
Commercial: Significant improvement in US P&C
Canadian P&C remained elevated
PCL By Operating Group (C$MM)
Q1 13 Q4 13 Q1 14
Consumer – Canadian P&C 109 114 91
Commercial – Canadian P&C 19 52 50
Total Canadian P&C 128 166 141
Consumer – US P&C 33 55 20
Commercial – US P&C (1) 41 (1)
Total US P&C 32 96 19
Wealth Management 2 1 (1)
Capital Markets (15) (17) (1)
Corporate Services1,2 (51) (106) (59)
Adjusted PCL 96 140 99
Purchased Performing1 82 49 -
Specific PCL 178 189 99
Change in Collective Allowance - - -
Total PCL 178 189 99

Risk Review | February 25 • 2014 18
Gross Impaired Loans (GIL) and Formations
630 595 610 614 642
Q1'13 Q2'13 Q3'13 Q4'13 Q1'14
Formations (C$MM)
2,912 2,848 2,650 2,544 2,482
Q1'13 Q2'13 Q3'13 Q4'13 Q1'14
Gross Impaired Loans (C$MM)
1 Other Commercial & Corporate includes industry segments that are each <3% of total GIL2 Commercial & Corporate includes ~$6MM GIL from Other Countries
Formations up Q/Q largely due to FX: Increases in Consumer and Canadian
Commercial portfolio, largely offset by decline in US Commercial
GIL down slightly Q/Q: Decrease in US Commercial portfolio,
partially offset by increase in the Canadian Consumer portfolio
By Industry(C$MM)
Formations Gross Impaired Loans
Canada & Other US Total Canada &
Other2 US Total
Consumer 173 151 324 411 722 1,133
Commercial Real Estate 13 82 95 82 349 431
Service Industries 28 45 73 47 221 268
Agriculture 12 3 15 87 31 118
Manufacturing 31 3 34 66 46 112
Retail Trade 1 32 33 15 93 108
Wholesale Trade 21 2 23 36 59 95
Construction 2 3 5 29 43 72
Financial 2 17 19 7 60 67
Other Commercial & Corporate1 4 17 21 56 22 78
Commercial & Corporate 114 204 318 425 924 1,349
Total Bank 287 355 642 836 1,646 2,482
Risk Review | February 25 • 2014 19
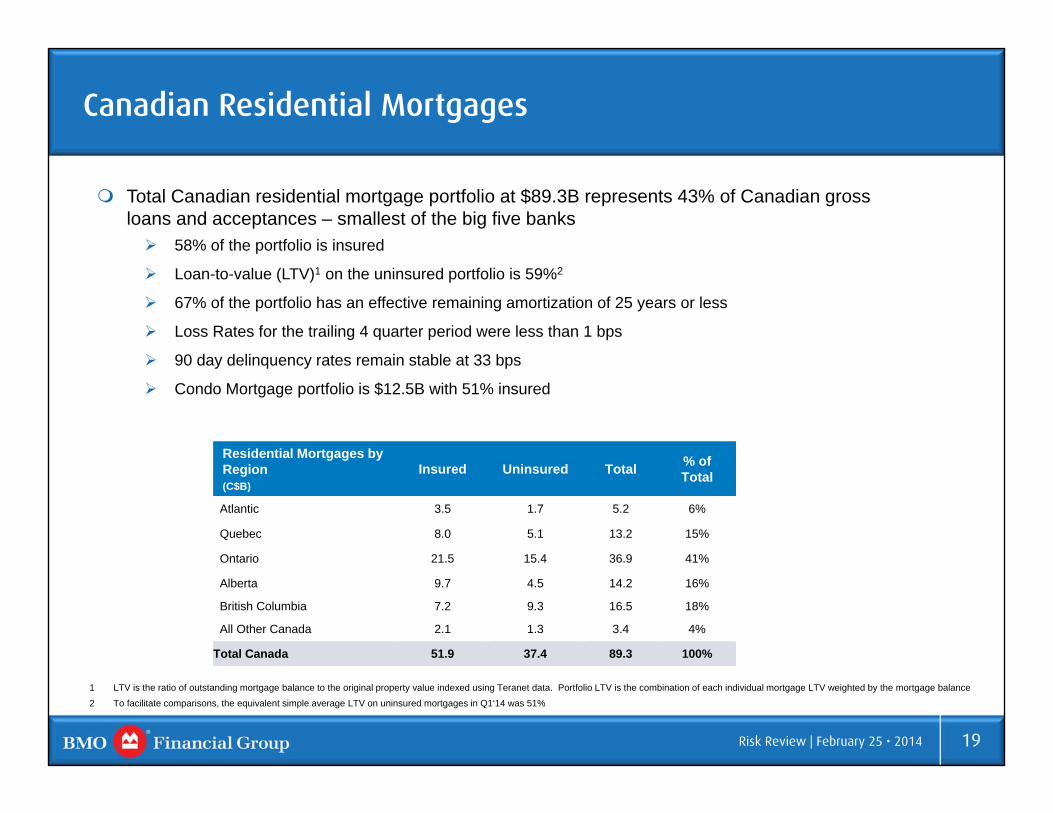
Canadian Residential Mortgages
Total Canadian residential mortgage portfolio at $89.3B represents 43% of Canadian gross loans and acceptances – smallest of the big five banks 58% of the portfolio is insured
Loan-to-value (LTV)1 on the uninsured portfolio is 59%2
67% of the portfolio has an effective remaining amortization of 25 years or less
Loss Rates for the trailing 4 quarter period were less than 1 bps
90 day delinquency rates remain stable at 33 bps
Condo Mortgage portfolio is $12.5B with 51% insured
1 LTV is the ratio of outstanding mortgage balance to the original property value indexed using Teranet data. Portfolio LTV is the combination of each individual mortgage LTV weighted by the mortgage balance
2 To facilitate comparisons, the equivalent simple average LTV on uninsured mortgages in Q1‘14 was 51%
Residential Mortgages by Region (C$B)
Insured Uninsured Total % of Total
Atlantic 3.5 1.7 5.2 6%
Quebec 8.0 5.1 13.2 15%
Ontario 21.5 15.4 36.9 41%
Alberta 9.7 4.5 14.2 16%
British Columbia 7.2 9.3 16.5 18%
All Other Canada 2.1 1.3 3.4 4%
Total Canada 51.9 37.4 89.3 100%
Risk Review | February 25 • 2014 20
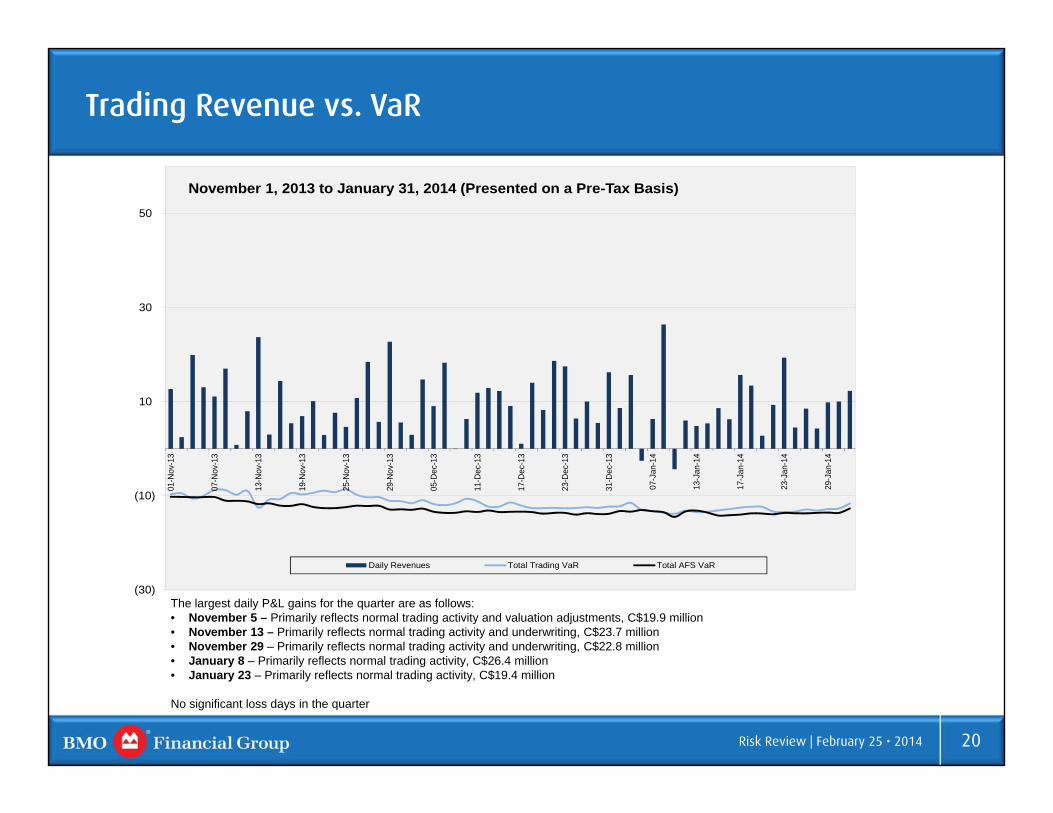
Trading Revenue vs. VaR
The largest daily P&L gains for the quarter are as follows: • November 5 – Primarily reflects normal trading activity and valuation adjustments, C$19.9 million• November 13 – Primarily reflects normal trading activity and underwriting, C$23.7 million• November 29 – Primarily reflects normal trading activity and underwriting, C$22.8 million• January 8 – Primarily reflects normal trading activity, C$26.4 million• January 23 – Primarily reflects normal trading activity, C$19.4 million
No significant loss days in the quarter
(30)
(10)
10
30
50
01-N
ov-1
3
07-N
ov-1
3
13-N
ov-1
3
19-N
ov-1
3
25-N
ov-1
3
29-N
ov-1
3
05-D
ec-1
3
11-D
ec-1
3
17-D
ec-1
3
23-D
ec-1
3
31-D
ec-1
3
07-J
an-1
4
13-J
an-1
4
17-J
an-1
4
23-J
an-1
4
29-J
an-1
4
November 1, 2013 to January 31, 2014 (Presented on a Pre-Tax Basis)
Daily Revenues Total Trading VaR Total AFS VaR

21Financial Results | February 25 • 2014
APPENDIX

22Financial Results | February 25 • 2014
39.3 43.4 45.0
70.9 74.6 77.5
Q1'13 Q4'13 Q1'14Commercial Deposits Personal Deposits
11%
Canadian Personal & Commercial Banking – Balances
1 Personal lending includes mortgages and consumer loans but excludes credit cards. Personal Cards balances approximately 89% of total credit card portfolio in each of Q1’13, Q4’13 and Q1’142 Commercial lending growth excludes commercial cards. Commercial cards balances approximately 11% of total credit card portfolio in each of Q1’13, Q4’13 and Q1’14
Average Loans & Acceptances(C$B) Loans
Total loan growth 10% Y/Y and 2% Q/Q driven by both personal and commercial lending
Strong personal lending growth¹ with balances up 10% Y/Y and 2% Q/Q
Continued momentum in commercial lending with growth2 of 11% Y/Y and 2% Q/Q
42.6 46.4 47.3
8.9 8.9 9.1 42.9 43.9 44.1
74.2 83.3 85.1
Q1'13 Q4'13 Q1'14Commercial Loans & Acceptances Credit Cards
Consumer Loans Residential Mortgages
168.6182.5 185.6
Deposits Personal deposit balances up 9% Y/Y and 4% Q/Q
Strong growth in personal term deposits of 14% Y/Y and 7% Q/Q
Commercial deposit focus continues to result in strong growth of 14% Y/Y and 4% Q/Q Strong commercial term deposit growth main driver of Y/Y
improvement
Average Deposits(C$B)
110.2 118.0 122.5
10%
Y/Y Growth

23Financial Results | February 25 • 2014
U.S. Personal & Commercial Banking – Commercial Balances
All amounts in U.S. $B
Loans Strong core C&I loan growth up 14% Y/Y and 2% Q/Q
Growth in core C&I reflects increases across all segments with the largest in Financial Institutions and Dealer Finance
Core Commercial Real Estate portfolio is gaining traction, new commitments of $1.1B in Q1’14
Commercial Real Estate Run-off portfolio continues to decline as expected
Deposits Deposits increased 6% Y/Y and Q/Q
21.3 23.7 24.3
2.9 3.1 3.2 2.4 1.4 1.1
Q1'13 Q4'13 Q1'14
C&I CRE Run-off Loans
Average Commercial Loans
19.9 19.9 21.0
Q1'13 Q4'13 Q1'14
Average Commercial Deposits
26.628.2 28.6

24Financial Results | February 25 • 2014
U.S. Personal & Commercial Banking – Personal Balances
All amounts in U.S. $B
5.6 6.4 6.5
5.1 4.8 4.8
3.7 3.2 3.1
12.6 12.1 12.0
4.3 4.7 4.8
Q1'13 Q4'13 Q1'14
Serviced Mortgages
Mortgages**
Other Loans***
Business Banking/SmallBusiness
Indirect Auto
39.9 38.9 37.9
Q1'13 Q4'13 Q1'14
Average Personal Loans
Average Personal Deposits
* Total includes Serviced Mortgages which are off-Balance Sheet and Wealth Management Mortgages** Mortgages include Home Equity (Q1’13 $5.6B; Q4’13 $5.2B; Q1’14 $5.1B) and Wealth Management Mortgages (Q1’13 $1.0B; Q4’13 $1.3B; Q1’14 $1.3B)*** Other loans include non-strategic portfolios such as wholesale mortgages, purchased home equity, and certain small business CRE, as well as credit card balances and other personal loans
31.3* 31.2* 31.2*Loans Strong serviced portfolio growth up 12% Y/Y and 2% Q/Q
Overall mortgage portfolio modestly down primarily due to a decline in Home Equity loans reflecting lower utilization and continued paydowns. New HELOC commitments up over 80% Y/Y
Business Banking pipeline is building as we continue to focus on client acquisition
Indirect Auto sales continue to increase: application volume up 15% Y/Y
Deposits In Q1, approximately $900MM of deposit balances were
transferred to Wealth Management as our customers’ needs are better aligned with Wealth Management services

25Financial Results | February 25 • 2014
Adjusting Items
Adjusting1 items – Pre-tax ($MM) Q1 13 Q4 13 Q1 14
Credit-related items on the M&I purchased performing loan portfolio 128 49 -
Acquisition integration costs (92) (60) -
Amortization of acquisition-related intangible assets (31) (31) (31)
Decrease/(increase) in the collective allowance for credit losses - - -
Run-off structured credit activities 7 26 -
Adjusting items included in reported pre-tax income 12 (16) (31)
Adjusting1 items – After-tax ($MM) Q1 13 Q4 13 Q1 14
Credit-related items on the M&I purchased performing loan portfolio 79 30 -
Acquisition integration costs (57) (37) -
Amortization of acquisition-related intangible assets (22) (22) (22)
Decrease/(increase) in the collective allowance for credit losses - (5) -
Run-off structured credit activities 7 20 -
Adjusting items included in reported net income after tax 7 (14) (22)
EPS ($) 0.01 (0.02) 0.03
1 All adjusting items are reflected in Corporate Services with the exception of the amortization of acquisition-related intangible assets, which is reflected across the Operating Groups.Adjusted measures are non-GAAP measures. See slide 2 of this document, page 34 of BMO’s 2013 Annual Report and page 21 of BMO’s First Quarter 2014 Report to Shareholders

26Financial Results | February 25 • 2014
Investor Relations Contact InformationE-mail: [email protected]/investorrelations
Fax: 416.867.3367
ANDREW CHINDirector, Investor [email protected]
SHARON HAWARD-LAIRDHead, Investor [email protected]