Investor Presentation - NBAD UAE · PDF fileInvestor Presentation ... 1 IMF World Economic...
44
1 March 2015 Investor Presentation Abu Dhabi at the Heart of the West-East Corridor
Transcript of Investor Presentation - NBAD UAE · PDF fileInvestor Presentation ... 1 IMF World Economic...

1
March 2015
Investor Presentation Abu Dhabi at the Heart of the West-East Corridor
2 2
Disclaimer
The information contained herein has been prepared by National Bank of Abu Dhabi P.J.S.C (“NBAD”). NBAD relies on information obtained
from sources believed to be reliable but does not guarantee its accuracy or completeness.
This presentation has been prepared for information purposes only and is not and does not form part of any offer for sale or solicitation of any
offer to subscribe for or purchase or sell any securities nor shall it or any part of it form the basis of or be relied on in connection with any
contract or commitment whatsoever.
Some of the information in this presentation may contain projections or other forward-looking statements regarding future events or the
future financial performance of NBAD. These forward-looking statements include all matters that are not historical facts. The inclusion of such
forward-looking information shall not be regarded as a representation by NBAD or any other person that the objectives or plans of NBAD will
be achieved. NBAD undertakes no obligation to publicly update or publicly revise any forward-looking statement, whether as a result of new
information, future events or otherwise.

3 3
UAE, Abu Dhabi & Banking Sector
NBAD Overview
Strategy & Updates
Financial Review 4Q / FY 2014
Appendix
Contents

4 4
UAE Economic Overview
Composition of UAE Real GDP by Sector (2013)3
1 IMF World Economic Outlook, 2013 2 Moody’s 3 National Bureau of Statistics, UAE
Public Debt in MENA Region (2013)²
UAE Public Debt vs GDP² • The United Arab Emirates comprises seven Emirates with Abu Dhabi being the largest contributor to its GDP
• Rating: Aa2 stable by Moody’s (unsolicited)
• Nominal GDP for 2013 estimated at USD 402.3bn, making it the 2nd largest economy in the GCC (after Saudi Arabia)1
• 6.06% of proven global oil reserves as of 20122
• UAE Banking sector offers the largest asset base within the GCC (NBAD is 4th largest bank by assets in the MENA region)
• UAE banking sector is dominated by domestic players domiciled within the market
Per cent (%)
24.5% 22.5% 23.6%
26.2% 26.2% 26.8%
2010 2011 2012 2013 2014F 2015F
Per cent (%)
131%
86%
44% 35%
26%
7% 6% 3%
Lebanon Jordan Bahrain Qatar UAE Oman Kuwait SaudiArabia
Per cent (%)
Oil & Gas 33%
Manufacturing 9%
Construction 9%
Real Estate 12%
Transport, storage and
communication 10%
Trade 12%
Financial Institutions
7%
Government Services
6%
Other 2%

5 5
Abu Dhabi – The Capital
Abu Dhabi Key Economic Indicators
Credit Rating Aa2 (Moody’s) / AA (S&P) / AA (Fitch)
Size Abu Dhabi accounts for 87% of UAE’s land area
Population (2012) 2.3mn1
Nominal GDP (2013) USD 259.7bn1
GDP Per Capita (2013) USD 106,0001
Oil & Gas as a % of GDP
54.9% (nominal GDP, 2013)1
Crude Oil -- Production -- Reserves
Approx 2.6mn bpd (2012)1 95 bn barrels1; Global ranking – 72
Other Principal Contributors to Nominal GDP (2013)1
Construction (9.0%), Real Estate (4.8%), FIs & Insurance (4.8%), Manufacturing (5.7%), Govt Services (4.6%), Transportation and storage (3.7%), Wholesale and retail trade (3.6%), Professional, scientific and technical (2.2%), Information and communication (2.3%), Public utilities (2.5%)
Abu Dhabi “2030 Economic Vision”
Initiative by the Government of Abu Dhabi to develop and diversify the economy beyond oil revenues
1 Statistics Centre of Abu Dhabi 2 IMF
Abu Dhabi’s Aa2 government rating reflects our expectation that resources accumulated during the recent period of high oil prices and a prudent budgeting of oil proceeds will mitigate the negative consequences of oil price volatility on the country’s fiscal and external accounts.
Abu Dhabi benefits from: (1) ample reserves derived from several consecutive years of fiscal surpluses; (2) a sound policy framework; (3) political stability and (4)a very high per capita income. After consolidated spending stabilized in 2014, the UAE’s fiscal breakeven oil price is just below $80 per barrel while its external breakeven oil price is around $64. At the same time, the government’s large net asset position provides a transition period of several years to adjust to oil price cycles.
Moody’s, January 26, 2015
Sovereign net foreign assets are the second-highest of all Fitch-rated sovereigns and rose by an estimated 27% of GDP during 2013 to 178.4% of GDP….These assets are equivalent to around five years of government spending and provide a substantial cushion….
Fitch Ratings, August 15, 2014
The exceptional strength of Abu Dhabi’s net asset positions also provides a buffer to counter the negative impact of oil price volatility on economic growth and government revenues, as well as on the external account.
Standard & Poor’s, October 3, 2014

6 6
472 511
572 632
291 318 348
387 311 323
347 380
2011 2012 2013 2014
Total Assets Deposits Loans & Advances
The UAE Banking Sector
UAE non-performing loans2 GCC banking sector assets3
UAE Banking System Key Indicators1
• As at 30 November 2014 there were a total of 49 banks (23 locally incorporated banks and 26 foreign banks)1
• 8 Islamic banks
• Strong capitalisation driven by cautious lending and healthy internal capital growth
• Most domestic banks focus on the UAE and GCC region, while the largest banks have international presence
• Regulated by the Central Bank of the UAE
USD Bn
632 568
269
189 189
64
UAE Saudi Arabia Qatar Bahrain Kuwait Oman
1.8% 4.8%
6.8% 7.2% 7.2% 6.2% 5.8% 5.0%
2.8% 0.9% 0.8% 0.3% 0.4% 0.8%
2.4% 2.2% 2.3% 2.0% 1.7%
2008 2009 2010 2011 2012 2013 2014F 2015F
Base Problem Loans Dubai World Problem LoanDubai Holding Problem Loan Dubai Holding RestructuredDubai World Restructured
1 UAE Central Bank 2 Moody’s UAE Banking System Outlook 3 Individual Central Banks
USD Bn
Kuwait, Qatar, Oman as of November 30th 2014 Saudi Arabia & UAE as of December 31st 2014

7 7
UAE, Abu Dhabi & Banking Sector
NBAD Overview
Strategy & Updates
Financial Review 4Q / FY 2014
Appendix
Contents

8 8
NBAD at a Glance (1/2)
Banker to the Abu Dhabi Government
70% owned by the Government of Abu Dhabi through ADIC (Abu Dhabi Investment Council)
Strongest ratings of any bank in the Middle East & Emerging Markets at Aa3/AA-/AA- - ‘Safest Bank in the Middle East & Emerging Markets’*
Largest bank by assets in the UAE (AED 376 billion as of 31st December 2014)
Well diversified Financial Group – across businesses and geography - Largest international presence among the UAE banks
Consistent profitability and value creation to shareholders
Well positioned for growth from global economic recovery
Clear and focused strategy for growth
* By Global Finance – Safest Bank in Middle East & Emerging Markets; Among the World’s 50 Safest Banks since 2009
9 9
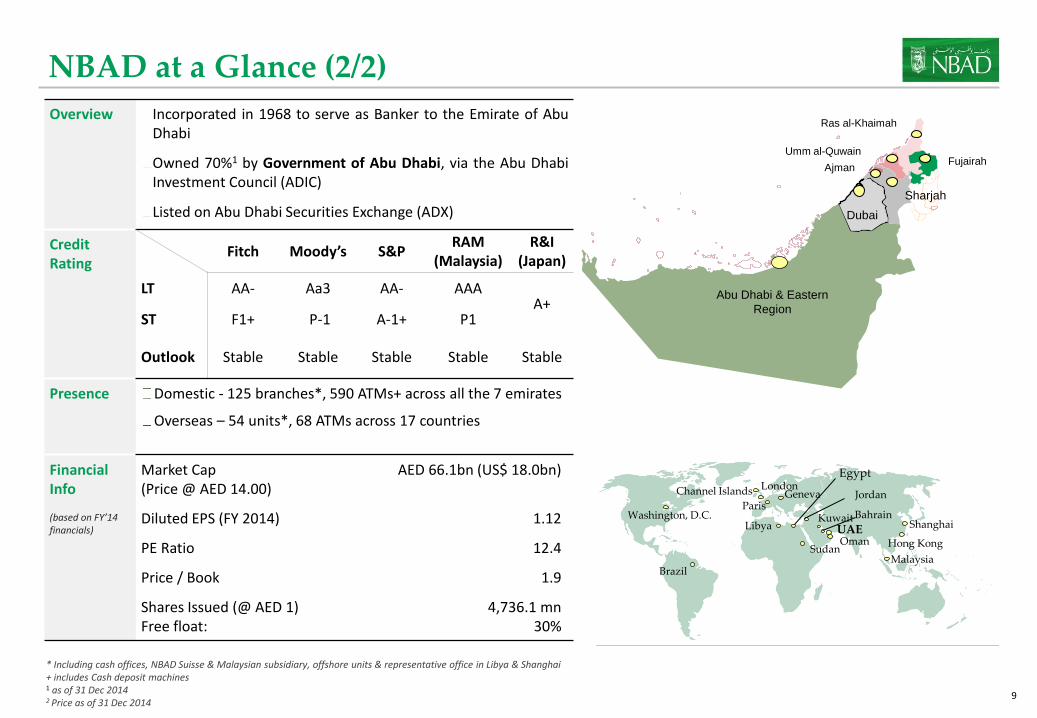
NBAD at a Glance (2/2)
Overview Incorporated in 1968 to serve as Banker to the Emirate of Abu Dhabi
Owned 70%1 by Government of Abu Dhabi, via the Abu Dhabi Investment Council (ADIC)
Listed on Abu Dhabi Securities Exchange (ADX)
Credit Rating
Fitch Moody’s S&P RAM
(Malaysia) R&I
(Japan)
LT AA- Aa3 AA- AAA A+
ST F1+ P-1 A-1+ P1
Outlook Stable Stable Stable Stable Stable
Presence Domestic - 125 branches*, 590 ATMs+ across all the 7 emirates
Overseas – 54 units*, 68 ATMs across 17 countries
Financial Info
(based on FY’14 financials)
Market Cap (Price @ AED 14.00)
AED 66.1bn (US$ 18.0bn)
Diluted EPS (FY 2014) 1.12
PE Ratio 12.4
Price / Book 1.9
Shares Issued (@ AED 1) Free float:
4,736.1 mn 30%
Dubai
Abu Dhabi & Eastern
Region
Ras al-Khaimah
Fujairah Umm al-Quwain
Ajman
Sharjah
* Including cash offices, NBAD Suisse & Malaysian subsidiary, offshore units & representative office in Libya & Shanghai + includes Cash deposit machines 1 as of 31 Dec 2014 2 Price as of 31 Dec 2014
Washington, D.C.
London
Paris Geneva
Egypt
Sudan
Kuwait Bahrain
Oman
Libya
Hong Kong
Jordan
UAE
Channel Islands
Malaysia Brazil
Shanghai

10 10
NBAD vs Global banks
NBAD
HSBC
StanChart
Barclays RBS
Lloyds
BNP Paribas Deutsche Bank
SocGen
Credit Suisse
UBS
Credit Agricole
ING Groep
Commerzbank
UniCredit
JP Morgan Chase
Goldman Sachs
Morgan Stanley Citigroup
BofA
30
40
50
60
70
80
90
100
110
120
CD
S (
bp
s)
Aa3S Aa3- A1+ A1S A1- A2+ A2S A2- A3+ A3S A3- Baa1+ Baa1S Baa1- Baa2+ Baa2S Baa2- Aa3+
Notes: X-axis represents the rating assigned by Moody’s. The ratings have been arranged from higher to lower based on the outlook assigned by Moody’s at each rating level. For example ‘Aa3+’ is the highest rating level for ‘Aa3’ rating category, where (+) refers to positive outlook. ‘Aa3+’ is followed by ‘Aa3S ‘ and ‘Aa3-’, where (S) refers to ‘stable outlook ‘ and (-) refers to ‘negative outlook’; CDS levels are for 26th January 2015; Source: Bloomberg
NBAD has the strongest rating from Moody’s (Aa3 with a Stable outlook), within the selected peer group below; Indeed NBAD is the only bank within the selected peer group here, to be rated in the double-A category by all three major agencies with Stable outlook

11 11
UAE, Abu Dhabi & Banking Sector
NBAD Overview
Strategy & Updates
Financial Review 4Q / FY 2014
Appendix
Contents

12 12
Our mission to be core to our chosen customers
Vision To be recognised as the World’s Best Arab Bank
Mission Be core to our chosen customers, helping them grow by providing exceptional
products and services across our West-East Corridor and provide an environment to attract and develop exceptional and diverse talent
Our Values Value our
people and foster great team work
Put our customers at the forefront and “do the
right things the right way”
Empower our people and
hold each other accountable for
performance and behaviour
Customer Value Proposition
Safety Relationship Connected Service Insight
Respect our heritage and be
loyal to our stakeholders

13 13
4 Geographical Pillars of our Strategy
Vision: To be recognised as the World’s Best Arab Bank to be achieved around four pillars…
Home Market
Build the largest, safest and best performing bank first in UAE, and over time
in the GCC
1
Wholesale / Wealth Network Markets
Deepen our network across the West-East
corridor & integrate our existing European & North American platforms into
this network
2
New Franchise Markets
Build 5 international bank franchises in the largest
and fastest growing economies in the West-
East corridor
3
Building the Spine
Supported by a world class spine (Operations & Technology, Risk, Finance, Legal, Compliance) combining best-in-class customer service with leading cost efficiency
4

14 14 SOURCE: United Nations, World Urbanization Prospects 2007; McKinsey Global Institute China All City Model; McKinsey Global Institute analysis
1 Cities with 10 million or more inhabitants
Megacities1 2007
Additional megacities by 2025
West-East corridor
Los Angeles
Mexico city
Bogotá
Lima Rio de Janeiro
Sao Paulo
Buenos Aires
London
Paris
Moscow
Cairo
Lagos
Kinshasa
Istanbul
Tehran Lahore
Karachi Ahmedabad
Mumbai
Bangalore Chennai
Hyderabad
Chengdu
Dhaka
Chongqing
Xi’an Beijing Seoul
Tianjin
Shanghai Hangzhou
Guangzhou Shenzhen/Hong Kong
Manila
Jakarta
Osaka-kobe New York
Wukan
Our primary drivers are trade and investment flows across the West/East corridor: We want to bank the customers from within the corridor We want to bank customers located outside of the corridor who trade and invest inside the corridor We want to support our chosen UAE customers in London, Paris, Switzerland and Washington
Banking the West-East corridor
Kolkata
Delhi
Tokyo

15 15
Trade and FDI flow across the West-East corridor
SOURCE: EIU estimates
Figures in USD Billion Trade = Sum of imports and exports FDI = Sum of M&A and Greenfield investments
Trade flows
1.1 Intra Middle East
Trade
2011
112
1.2 Middle East and Asia
2011
1.3 Middle East and Africa
2011
2.1 Asia and Africa 3.1 Intra Asia
Trade 3302 6607 8%
3.2 Intra Africa
50 Trade 103 8%
FDI flow 17
2020
270
2020
2020
38
CAGR 11-20
10%
CAGR 11-20
CAGR 11-20
9% FDI flow 213 614 12%
FDI flow 2 15 25%
2011 2020 CAGR 11-20 2011 2020
CAGR 11-20
2011 2020 CAGR 11-20
Trade
FDI flow
334
35
888
69
11%
8%
Trade
FDI flow
Trade
FDI flow
1008
26
2743
82
12%
14%
10%
19%
163
29
67
6

16 16
Key sectors
Financial Institutions
Aviation, rail and transport services
Real Estate and family conglomerates
Traders and retailers
Energy and Resources
Why is it an opportunity? Illustrations
Significant and fastest growing segment globally
40% contributor to the global Wholesale bank and the biggest volume segment in flow products
Controls 70% of the volumes in certain products
Strategic sector in the UAE & aligned with Abu Dhabi 2030
Attractive sector for corporate credit with low counterparty risk
Substantial growth & potential of supply chain business
Strategic sector the UAE & aligned with Abu Dhabi vision 2030
National champions with significant growth aspirations
Big 6 airlines within the new West-East corridor
Strategic sector the UAE (20% of UAE GDP) & aligned with Abu Dhabi vision 2030
Highly attractive sector for Arab investors
Attractive for GCC/Asian and other investors
Strategic and high growth sectors in the region
UAE is the 18th biggest trading country in world ahead of countries like India, Brazil and Australia
Retailing is USD ~$48Bn market in GCC expected to grow at ~8% annually from 2013/17
Key industry sectors aligned to our network markets strategy

17 17
We will increasingly utilise an ‘originate to distribute’ model
Originate from Customers Distribute to Customers
Government of Abu Dhabi
Financial institutions
Energy and resources
Aviation, rail and transport services
Real estate and family conglomerates
Traders and retailers
Financial institutions
Hedge funds
Pension funds and Insurance
Sovereigns
Private banks
HNW and affluent
On and off balance sheet
Primary distribution
Secondary distribution
Reverse inquiries
Cross-sell Cross-sell
Cash and Trade
FX and derivatives
Bonds syndications
Commodities
Specialised lending
Corporate finance
Flo
w
pro
du
cts
Clearing/settlements
Cash and trade
FX and derivatives
Bonds
Loans
Flow
p
rod
ucts
Single distribution hub

18 18
Wholesale banking model aligning to West-East corridor
1 Relationship, sales and product service
Abu Dhabi The Gulf/Middle East
Mumbai Indian sub-continent
Lagos South and West Africa
Singapore South-East Asia, Australia, Papua New Guinea
Hong Kong Greater China, Korea and Japan
London Scandinavia, Switzerland, and European Union
Washington North and South America
Global financial markets and booking centers Abu Dhabi Singapore or Hong Kong London
Key industry sectors
Financial institutions (Singapore)
Energy and resources (Abu Dhabi)
Aviation, rail and transport (Abu Dhabi)
Real estate and family conglomerates (Abu Dhabi)
Traders and retailers (Abu Dhabi)
Cash and trade Abu Dhabi
DCM Abu Dhabi Hong Kong
Advisory and specialized lending Abu Dhabi
Banking hubs1 Customer geographies Centers of excellence Operating centers
Abu Dhabi
(BCM in Al Ain)
One more location at a future point (e.g., India or Philippines)
Paris France and North Africa

19 19
NBAD Becoming the World’s Best Arab Bank
Improving Our Reputation for Safety Among World’s 50 Safest Banks
Enhancing our Retail Customer Experience Introduced New Branch Design
Expanding Global Brand & Reputation Exclusive banking partner of Real
Madrid in UAE
Intensive customer service initiatives underway “Bring Your Heart to Work” Day
Enhancing Brand/Investing in Abu Dhabi Renewed Sponsorship as “Official Bank of
FORMULA 1 ABU DHABI GRAND PRIX”
Building a Talented Bench of Professional Bankers Launch of Professional Bankers Programme
Real Madrid Partnership Enhanced Branch Design World’s 50 Safest Banks
FORMULA 1 Sponsor Bring Your Heart to Work Professional Bankers Programme

20 20
Geographical Pillars – Strategy Delivered in 2015
Geographical Pillars
Pillar 1 – Home Market
Retail
Branch Refurbishment (ongoing)
eChannels/Online/ Mobile Banking (ongoing)
Penetrate existing client base (refer cross sell target)
Major scaling up of direct sales leading to substantial volume increases
Enhance the customer experience
Commercial
Major customer acquisition/ Formation of 3 customer segments
Penetrate existing base
Launched proposition for: • Short-term working capital
related facilities
• Program lending
• Trade & FX
Major rebuild of team/ significant hiring
Focus on improving limits utilisation and cross sell
Pillar 2: Network
Wholesale
Key Hires complete: • All 5 Industry Group Heads
hired
• New Relationship Bankers’ teams
• Major upgrading of Product Team Heads
London – Canary Wharf established
Mumbai – License successful; planned mid-2015
Hong Kong – expanding the dealing room
Deepen relationship with the core 600+ clients
Build-out product capabilities (structured, corp finance)
Wealth
Customer acquisition
Regional expansion • Egypt build out
• Regional (MENA) & Asian distribution of AMG funds
• Establish regional network of sub-brokers & custodians
Define a strategy to become the leading asset manager in the Islamic world
Substantially grow our Swiss Private Banking business
21 21
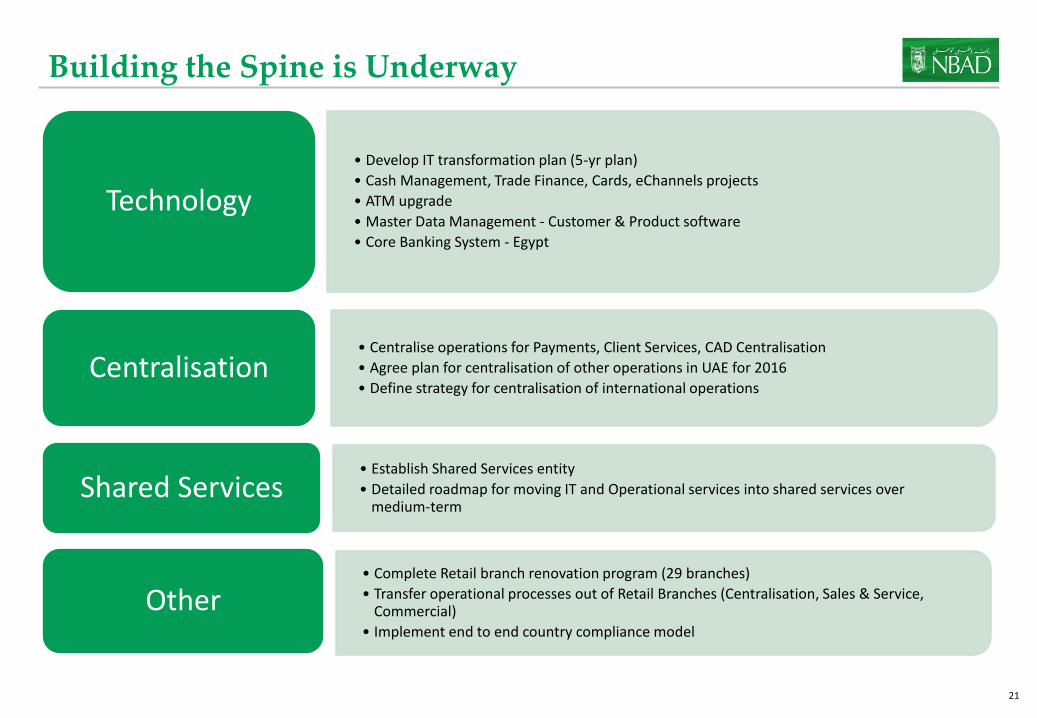
Building the Spine is Underway
• Develop IT transformation plan (5-yr plan)
• Cash Management, Trade Finance, Cards, eChannels projects
• ATM upgrade
• Master Data Management - Customer & Product software
• Core Banking System - Egypt
Technology
• Centralise operations for Payments, Client Services, CAD Centralisation
• Agree plan for centralisation of other operations in UAE for 2016
• Define strategy for centralisation of international operations Centralisation
• Establish Shared Services entity
• Detailed roadmap for moving IT and Operational services into shared services over medium-term
Shared Services
• Complete Retail branch renovation program (29 branches)
• Transfer operational processes out of Retail Branches (Centralisation, Sales & Service, Commercial)
• Implement end to end country compliance model
Other

22 22
Connecting Global Issuers to The Middle East Facilitating Landmark Transactions in 2014
2
Overall Emerging Market Deal of the Year
Emerging Asia Deal of the Year
Islamic Deal of the Year 2014
Emerging Market Financial Institution Deal of the Year
Deal of the Year Sovereign Deal of the Year
Sukuk Deal of the Year UK Deal of the Year
Middle East & Turkey Deal of the Year
Best Islamic Financing 2014
Perpetual Deal of the Year Regulatory Capital Deal of the Year
UAE Deal of the Year
Syndicated Deal of the Year
Sovereign/Supranational/Agency Sterling Deal of the Year
Social Impact Deal of the Year
Best Sovereign Bond 2014
Joint Bookrunner
Joint Bookrunner Joint Bookrunner Joint Bookrunner
Joint Bookrunner Joint Bookrunner Joint Bookrunner
Joint Bookrunner
Joint Bookrunner
Joint Bookrunner
Joint Bookrunner
Joint Bookrunner

23 23
Our Proposition to Clients is Improving
2
Category Current
Rank Prior Rank
GCC Bonds #3 #8
MENA Syndicated Loans
#3 #11
International Sukuk #3 #6
Bloomberg Rankings
*Rankings based on survey for corporates and financial institutions in the GCC
Client Metric NBAD’s
Rank
Client Coverage/Penetration #1
Greenwich Quality Index (S/T & R) #1
GQI Sales & RM #1
Sales Rep Ranking & Activity #1 / #2
Greenwich Survey
“Best Islamic Fund” – Global Islamic Finance Awards
“UAE Best Fund Manager” – Wealth Briefing GCC Region Awards
“Best GCC Equity Fund” – Banker Middle East “Best Brokerage House in UAE, 2014” –
International Finance Magazine
“Private Bank of the Year UAE” – The Banker & Professional WM Magazine
Global Wealth Awards
24 24
UAE, Abu Dhabi & Banking Sector
NBAD Overview
Strategy & Updates
Financial Review 4Q / FY 2014
Appendix
Contents

25 25
2014 – Key Highlights
+11%
REVENUES
9,398 10,415
FY'13 FY'14
+18% Up 835
AED mn
NET PROFITS
4,744
5,579
FY'13 FY'14
Up 1,016 AED mn
Among the Safest Banks in the World* Within the Top #50 since 2009
* Global Finance 2014
#25 RoE 15.4%
RoSF 16.8%
Tier-I 15.0%
CAR 16.4%

26 26
Business Drivers Grow in Line with Strategy
Assets were up year-over-year, driven by increases in Loans and Deposits; Trade & Market Contingencies grew significantly year-over-year as we continued to execute against our strategy.
Balance sheet indicators FY 2013 FY 2014 Variance
AED Bn AED Bn %
Assets 325 376
Equity 35 38
Customer Loans 184 194
Customer Deposits 211 243
CASA 58 68
Trade Contingencies 82 121
Market Contingencies 931 1,102
15.7%
9.5%
5.7%
15.2%
17.6%
46.9%
18.4%

27 27
Ratio FY 2014 FY 2013
Efficiency Diluted Earnings per Share (EPS in AED; restated for prior period) 1.12 0.95
Return on average Equity (annualised) 15.4% 14.4%
Return on average Sharehodlers' Funds (annualised; net of Tier-I capital notes & its interest thereof) 16.8% 15.6%
Return on average RWAs (annualised) 2.45% 2.48%
Net Interest Margin (based on NII & income from Islamic financing and total average assets for the period) 2.00% 2.08%
Cost-Income ratio 35.5% 34.4%
JAWS (revenue growth less expense growth) -3.6% -4.5%
Liquidity Percentage lent (Loans / Assets) 52% 57%
Loans to Customer Deposits ratio 80% 87%
Solvency* Capital adequacy 16.4% 18.2%
Tier-I ratio 15.0% 16.5%
Leverage ratio (Assets/ Equity) 9.9x 9.4x
Asset Quality Non-performing loans ratio [NPLs / Gross Loans (net of Interest in suspense)] 3.07% 3.16%
Total Provisions / NPLs 108% 105%
Specific Provisions coverage (Specific provisions / NPLs) 50.7% 55.7%
Collective Provisions coverage (Collective provisions / Performing Credit RWAs) 1.72% 1.66%
Key Ratios
* Basel-II framework as adopted by the UAE Central Bank

28 28
1,852 2,311
701
960 335
126 2,888 3,397
FY'13 FY'14
Fees & comissions FX & Investment income Other income
Revenues
2,331 2,570
2,757
4Q'13 3Q'14 4Q'14
AED Mn
9,398
10,415
FY'13 FY'14
QoQ +7%; YoY +18% YoY +11%
2.08%
1.84%
1.98%
1.89%
2.00%
4Q'13 1Q'14 2Q'14 3Q'14 4Q'14
Net Interest Margin*
* NIM% (Ytd) – annualised; based on total average assets for the period
512 563 619
135 196
231 22 14
12 669 774
862
4Q'13 3Q'14 4Q'14
Non-Interest Income
Revenues trend
AED Mn
• 4Q momentum driven by growth in non-interest income and NII: +7% q-o-q , +18% y-o-y; FY’14 up 11%
• NII up 6% sequentially as reflected in improved NIMs; expect continued pressure on NIMs going forward
• Continuing focus on non-interest income; growth of 29% y-o-y in 4Q’14 and 18% in FY’14
• Trade finance and corporate & retail lending were the main drivers of growth in fees, supported by strong growth in brokerage, asset management and IPO related fees on favourable market activity in 2014
Per cent (%)

29 29
Revenues by Business Segment
• Global Wholesale continued momentum with 6% sequential growth and 18% y-o-y growth in 4Q; Full-year growth was 9%
• Global Retail & Commercial grew 10% sequentially and 11% year-over-year for 4Q; Growth was 8% for FY2014
• In Global Wealth, 4Q growth was up 3% sequentially (impacted by market volatility and hiring talent) and up 37% y-o-y; FY’14 growth was 61%
Global Wholesale
AED Bn
Global Wealth
Per cent (%)
Global Retail & Commercial
Per cent (%)
4,959
4,546
YoY +9%QoQ +6%; YoY +18%
FY'13 FY'14
1,086 1,209
1,281
4Q'13 3Q'14 4Q'14
3,344
3,095
QoQ +10%; YoY +11% YoY +8%
FY'13 FY'14
810 813 898
4Q'13 3Q'14 4Q'14
1,063
659
QoQ +3%; YoY +37% YoY +61%
FY'13 FY'14
204
272 280
4Q'13 3Q'14 4Q'14

30 30
2,188 2,533
836 940 206 223 3,230
3,696
FY'13 FY'14
Staff costs Gen & Admin expenses Depreciation
Expenses
919 930 1,110
4Q'13 3Q'14 4Q'14
AED Mn
3,230 3,696
FY'13 FY'14
QoQ +19%; YoY +21% YoY +14%
595 643 721
271 231 331 54 56
58 919 930
1,110
4Q'13 3Q'14 4Q'14
Expenses breakdown
Expenses trend
AED Mn • Planned investments led to 4Q expenses up 19% sequentially
and up 21% year-over-year; for FY 2014, expenses were up 14%
• Cost to income ratio up slightly to 35.5% as we continue to invest in the business
• Staff costs increased as we hired key roles across the board, more than doubled direct sales force in Retail & Commercial, hired experienced bankers in Global Wholesale and Global Wealth
Cost-Income ratio
34.5%
31.6%
32.7%
33.9%
35.5%
Dec-13 Mar-14 Jun-14 Sep-14 Dec-14
Per cent (%)
31 31
Impairment Charges
285
202 200
4Q'13 3Q'14 4Q'14
AED Mn
1,206
868
FY'13 FY'14
QoQ -1%; YoY -30% YoY -28%
NPLs trend
Impairment charges trend
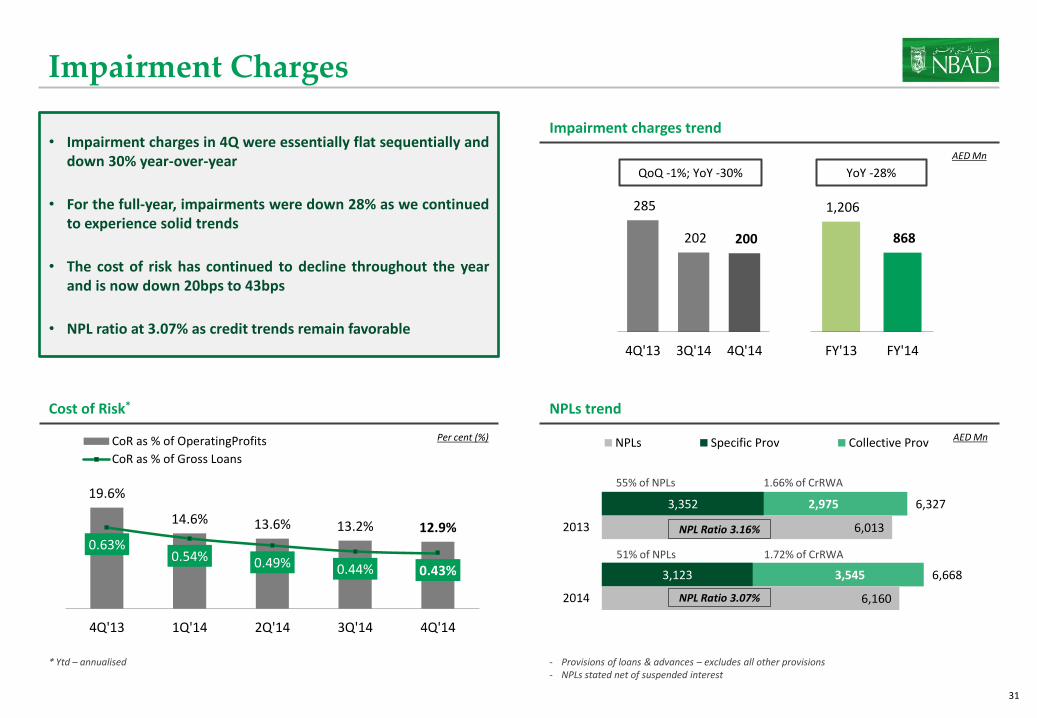
AED Mn • Impairment charges in 4Q were essentially flat sequentially and
down 30% year-over-year
• For the full-year, impairments were down 28% as we continued to experience solid trends
• The cost of risk has continued to decline throughout the year and is now down 20bps to 43bps
• NPL ratio at 3.07% as credit trends remain favorable
Cost of Risk*
* Ytd – annualised
19.6%
14.6% 13.6% 13.2% 12.9% 0.63%
0.54% 0.49% 0.44% 0.43%
4Q'13 1Q'14 2Q'14 3Q'14 4Q'14
CoR as % of OperatingProfits
CoR as % of Gross Loans
Per cent (%)
3,545
2,975
3,123
3,352
6,160
6,013
6,668
6,327
2014
2013
NPLs Specific Prov Collective Prov
NPL Ratio 3.07%
NPL Ratio 3.16%
55% of NPLs
51% of NPLs
1.66% of CrRWA
1.72% of CrRWA
- Provisions of loans & advances – excludes all other provisions - NPLs stated net of suspended interest

32 32
Net Profits
1,075
1,370 1,372
4Q'13 3Q'14 4Q'14
4,744 5,579
FY'13 FY'14
QoQ flat; YoY +28% YoY +18%
Return on Equity & Return on Shareholders’ Funds
Net profits trend
AED Mn • Net profits in 4Q were flat sequentially and up 28% year-over-
year; for the full-year, profits were up 18%
• Profit growth was driven by increases in non-interest income, particularly fee income, as well as NII
• RoE remains above 15% and Return on Shareholders’ Funds was 16.8%
15.6%
17.7% 17.5% 17.0% 16.8%
14.4%
16.2% 16.0% 15.6% 15.4%
Dec-13 Mar-14 Jun-14 Sep-14 Dec-14
RoSF RoE
* Ytd and Annualised; RoSF excludes AED 4bn Tier-I capital and its annual coupon thereof
Per cent (%)
Diluted Earnings per Share (EPS)
1.12
AED
2013 2014
0.95

33 33
Net Profits by Business Segment
• Global Wholesale grew net profits up 10% sequentially and 39% year-over-year; FY 2014 growth was 18%
• Global Retail & Commercial grew 14% sequentially, but was down 15% year-over-year for 4Q; Growth was 11% for FY2014
• In Global Wealth, 4Q growth was down 7% sequentially (impacted by market volatility and hiring talent) and up 34% year-over-year; For FY 2014, profits were up 89%
Global Wholesale
AED Bn
Global Wealth
Per cent (%)
Global Retail & Commercial
Per cent (%)
3,325
2,828
QoQ +10%; YoY +39% YoY +18%
FY'13 FY'14
630
795 878
4Q'13 3Q'14 4Q'14
1,220
1,096
QoQ +14%; YoY -15% YoY +11%
FY'13 FY'14
314
234 267
4Q'13 3Q'14 4Q'14
626
332
QoQ -7%; YoY +34% YoY +89%
FY'13 FY'14
114
164 152
4Q'13 3Q'14 4Q'14

34 34
Assets & Liquidity
Loans 52%
Investments 22%
Due from Banks & Reverse
repos 7%
Cash & balances with CentralBanks
15%
Fixed assets & Other assets
4%
87%
76% 77% 75%
80%
4Q'13 1Q'14 2Q'14 3Q'14 4Q'14
• Assets ended the year at AED 376bn, declining 5% from peak 3rd quarter levels and up 16% year-over-year
• Growth came from Loans (and Deposits) for the full-year while the sequential decline was due mainly to less government related deposits
• Loans to deposits were 80%, up sequentially and down year-over-year, driven by loan growth overall and swings in deposits
Assets trend
Loans to Deposits ratio Asset mix
FY’14 AED 376bn
325 361 348 398 376
Dec'13 Mar'14 Jun'14 Sep'14 Dec'14
QoQ -5%; YoY +16% AED Bn
Per cent (%)
35 35
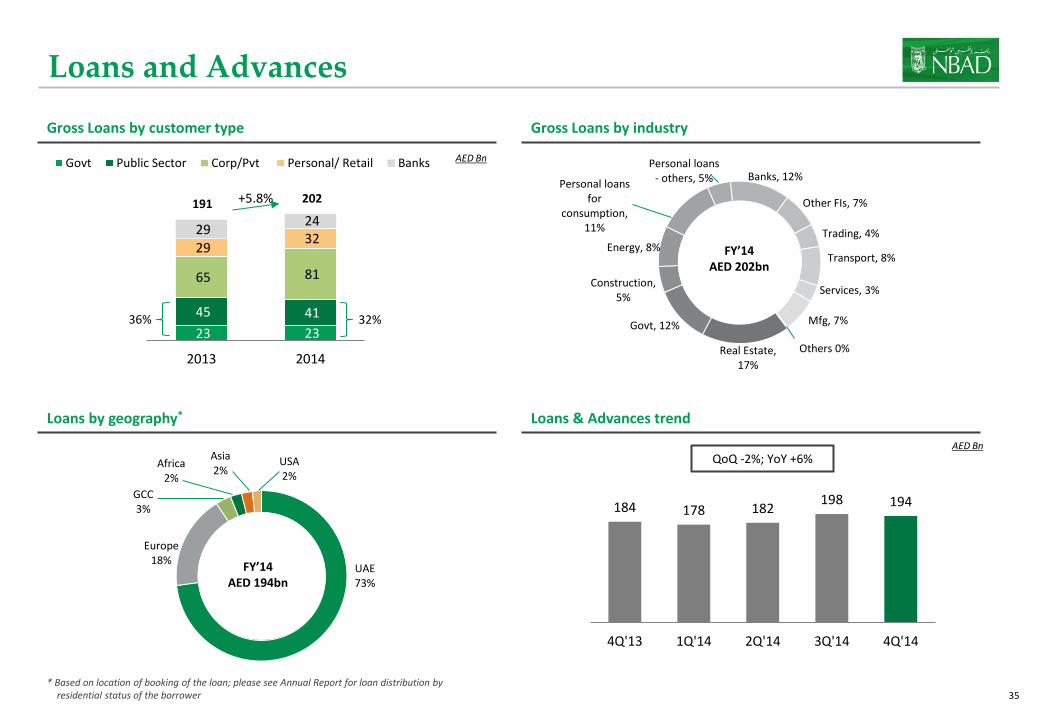
184 178 182 198 194
4Q'13 1Q'14 2Q'14 3Q'14 4Q'14
Loans and Advances
23 23
41 45
81 65
32 29
24 29
20142013
Govt Public Sector Corp/Pvt Personal/ Retail Banks
+5.8%
36% 32%
Loans & Advances trend
QoQ -2%; YoY +6% AED Bn
Gross Loans by customer type
AED Bn
191 202
Gross Loans by industry
Real Estate, 17%
Govt, 12%
Construction, 5%
Energy, 8%
Personal loans for
consumption, 11%
Personal loans - others, 5% Banks, 12%
Other FIs, 7%
Trading, 4%
Transport, 8%
Services, 3%
Mfg, 7%
Others 0%
FY’14 AED 202bn
Loans by geography*
UAE 73%
Europe 18%
GCC 3%
Africa 2%
Asia 2%
USA 2%
FY’14 AED 194bn
* Based on location of booking of the loan; please see Annual Report for loan distribution by residential status of the borrower

36 36
Investments
Investments by ratings
Investments Investments by issuer
Investments by region
HFT - Debt 16.7% HFT - Equity &
Funds 1.9%
Held to Maturity (Debt) 6.7%
AFS - Equity & Funds 0.7%
AFS - Debt 74.0%
FY’14 AED 83bn Sovereign
33.3%
GREs 22.3%
Sovereign Guaranteed
2.9%
Covered Bonds 6.7%
Banks 25.2%
Corporate/ Pvt Sector 7.0%
Supranational 2.5%
FY’14 AED 83bn
Europe 22.2%
GCC 12.6%
MENA (ex-GCC&UAE)
5.6% USA
18.7%
Australia & Others 14.7%
UAE 26.1%
AAA 20.4%
AA 34.7%
A 28.3%
BBB 4.9%
BB & below 5.8%
Unrated - Debt 3.2%
Equity & Funds 2.6%
FY’14 AED 83bn FY’14
AED 83bn
* Based on location of the issuer of the security or parent in case of SPVs

37 37
Funding Profile
* represents the nominal AED equivalent amount outstanding
Medium-term notes maturity profile* Subordinated debt maturity profile*
Due to banks 10.8% Repurchase
Agreements 4.1%
Euro Commercial Paper 1.6%
Customers' deposits
71.9%
Medium-term borrowings
4.4%
Subordinated convertible
notes 0.4%
Other liabilities 6.6%
3.3 3.2 2.7
4.1
0.5
1.3
2015 2016 2017 2018 2019 2020 >2020
AED Bn
1.0
0.5
2016 2027
AED Bn
• Stable funding mix over the years; emphasis on increasing contribution of medium-term funding
• Opportunistic in tapping the capital markets when pricing and terms favourable
• Benchmark trade issued in February 2015, USD 750mn @2.25% for 5 years under the existing EMTN programme
Funding mix
FY’14 AED 338bn
FY’14 - AED 15.2bn FY’14 - AED 1.5bn

38 38
Customer Deposits
211 235 237
265 243
63% 67% 66% 69% 66%
28% 27% 27% 26%
28%
9% 6% 6% 5% 6%
Dec-13 Mar-14 Jun-14 Sep-14 Dec-14
CDs & Margin A/c's CASA Notice & Time
211 235 237
265 243
4Q'13 1Q'14 2Q'14 3Q'14 4Q'14
• Customer deposits were down sequentially as some government related balances declined; FY growth was robust at 15%
• CASA* represented 28% of customer deposits at year-end and continues to be an area of focus at NBAD
• The percentage of deposits which were government related increased to 44% at YE 2014 from 40% at YE 2013
Customer Deposits trend
QoQ -8%; YoY +15% AED Bn
Customer Deposits trend Customer Deposits by Account
70 46
39 40
72 66
63 60
20142013
Govt Public Sector Corp/Pvt Retail
40% 44%
AED Bn
211 243
AED Bn
* Current accounts savings accounts

39 39
33.8 33.4 35.0
36.3 37.6
37.3 37.1 38.6
40.0 41.0
Dec-13 Mar-14 Jun-14 Sep-14 Dec-14
Tier-I Capital Resources
18.2% 16.1% 16.2% 16.3% 16.4%
16.5% 14.5% 14.7%
14.8% 15.0%
8%
12%
Dec-13 Mar-14 Jun-14 Sep-14 Dec-14
Total CAR Tier I%
Capital Resources (Basel-II*)
UAE CB CAR requirement
Minimum Tier-I requirement
• Capital Resources (Basel-II) of AED 41.0bn up 3.7% q-o-q and 11.2% y-o-y on higher earnings
• Tier-I capital of AED 37.6bn, up 2.6% q-o-q and 9.9% y-o-y on higher earnings as well
• Capital Adequacy ratio (Basel-II) at 31 Dec 2014 at 16.4% and 15.0% on Tier-I well above the UAE Central Bank’s minimum requirements of 12% and 8%, respectively and in line with our stated medium-term targets
Capital resources
AED Bn
* Basel-II framework as adopted by UAE Central Bank
Capital adequacy ratio
Per cent (%)
Risk Weighted Assets
AED Bn
182 210
13
24 11
17 205
250
2013 2014
Operational Market Credit

40 40
UAE, Abu Dhabi & Banking Sector
NBAD Overview
Strategy & Updates
Financial Review 4Q / FY 2014
Appendix
Contents

41 41
Results at a Glance
4Q'14 3Q'14 QoQ
% growth4Q'13
YoY %
growthFY'14
YoY %
growth
Income statement (AED mn)
Net Interest Income (incl income from Islamic financing)
1,895 1,796 5.5% 1,662 14.0% 7,018 7.8%
Non Interest Income 862 774 11.4% 669 28.8% 3,397 17.6%
Revenue 2,757 2,570 7.3% 2,331 18.3% 10,415 10.8%
Expenses (1,110) (930) 19.4% (919) 20.8% (3,696) 14.4%
Operating Profits 1,646 1,640 0.4% 1,412 16.6% 6,719 8.9%
Impairment Charges, net (200) (202) -1.0% (285) -29.6% (868) -28.0%
Prov for Taxes (74) (68) 9.3% (52) 43.0% (272) 24.5%
NET PROFIT 1,372 1,370 0.2% 1,075 27.6% 5,579 17.6%
Balance Sheet (AED bn)
Assets 376 398 -5.5% 325 15.7% 376 15.7%
Loans & Advances 194 198 -1.9% 184 5.7% 194 5.7%
Deposits & Others 243 265 -8.1% 211 15.2% 243 15.2%
Ratios %
RoE % 14.6% 15.0% -0.4% 12.7% 1.9% 15.4% -0.2%
RoSF % 15.9% 16.4% -0.4% 14.1% 1.8% 16.8% 14.7%
NIM % 1.96% 1.92% 3bps 1.98% -3bps 2.00% -8bps
Cost / Income % 40.3% 36.2% 4.1% 39.4% 0.9% 35.5% 1.1%
JAWS % -12.1% -2.5% -3.6%

42 42
Balance Sheet
Balance Sheet (AED Bn) Dec'14 Sep'14 qoq %
growthDec'13
yoy %
growth
Assets
Cash & Balances with Central Banks 55.5 64.8 -14.5% 35.1 58.2%
DFB & Reverse Repos 27.0 46.1 -41.5% 39.0 -30.9%
Investments 82.9 73.8 12.3% 53.5 55.0%
Loans & Advances 194.3 198.0 -1.9% 183.8 5.7%
Other Assets 16.5 15.3 7.7% 13.7 20.5%
Total Assets 376.1 398.1 -5.5% 325.1 15.7%
Liabilities & Equity
DTB/Repos/ECPs 56.0 47.8 17.1% 43.9 27.8%
Deposits & Others 243.2 264.7 -8.1% 211.1 15.2%
CASA 68.3 68.8 -0.7% 58.1 17.6%
Others 174.9 195.9 -10.7% 153.0 14.3%
Term Borrowings/Subdebt 16.5 16.7 -1.4% 20.2 -18.2%
Short term (<1 yr) 3.3 3.4 -4.9% 3.5 -6.5%
Long term 13.2 13.3 -0.5% 16.7 -20.7%
Other Liabilities 22.4 31.5 -29.0% 15.2 47.1%
Capital & Reserves 38.0 37.3 1.9% 34.7 9.5%
Total Liabilities & Equity 376.1 398.1 -5.5% 325.1 15.7%

43 43
Corporate Access Links
Corporate Headquarters:
One NBAD Tower, Sheikh Khalifa St PO Box 4, Abu Dhabi, UAE Tel : +971-2-6111111 Fax : +971-2-6273170 Website : http://www.nbad.com
Michael Miller Head – Investor Relations, Media & PR
Abhishek Kumat Investor Relations
Fadeela Khamis Media & PR

44