Investor Presentation - Marathon Petroleum presentation contains forward -looking statements within...
68
Investor Presentation May 2014
Transcript of Investor Presentation - Marathon Petroleum presentation contains forward -looking statements within...

Investor Presentation
May 2014

Forward-Looking Statements This presentation contains forward-looking statements within the meaning of federal securities laws regarding both MPC and MPLX. These
forward-looking statements relate to, among other things, expectations, estimates and projections concerning the business and operations of MPC and MPLX. You can identify forward-looking statements by words such as “anticipate,” “believe,” “estimate,” “expect,” “forecast,” “project,” “could,” “may,” “should,” “would,” “will” or other similar expressions that convey the uncertainty of future events or outcomes. Such forward-looking statements are not guarantees of future performance and are subject to risks, uncertainties and other factors, some of which are beyond the companies’ control and are difficult to predict. Factors that could cause MPC’s actual results to differ materially from those in the forward-looking statements include: volatility in and/or degradation of market and industry conditions; the availability and pricing of crude oil and other feedstocks; slower growth in domestic and Canadian crude supply; completion of pipeline capacity to areas outside the U.S. Midwest; consumer demand for refined products; transportation logistics; the reliability of processing units and other equipment; our ability to successfully implement growth opportunities; impacts from our repurchases of shares of MPC common stock under our share repurchase authorizations, including the timing and amounts of any common stock repurchases; state and federal environmental, economic, health and safety, energy and other policies and regulations, including the cost of compliance with the Renewable Fuel Standard; other risk factors inherent to MPC’s industry; and the factors set forth under the heading "Risk Factors" in MPC's Annual Report on Form 10-K for the year ended December 31, 2013, filed with the Securities and Exchange Commission (SEC). Factors that could cause MPLX actual results to differ materially from those in the forward-looking statements include: the adequacy of MPLX capital resources and liquidity, including, but not limited to, availability of sufficient cash flow to pay distributions and execute business plans; the timing and extent of changes in commodity prices and demand for crude oil, refined products, feedstocks or other hydrocarbon-based products; volatility in and/or degradation of market and industry conditions; completion of pipeline capacity by competitors; disruptions due to equipment interruption or failure, including electrical shortages and power grid failures; the suspension, reduction or termination of MPC's obligations under commercial agreements; the ability to successfully implement growth strategies, whether through organic growth or acquisitions; state and federal environmental, economic, health and safety, energy and other policies and regulations; other risk factors inherent to MPLX’s industry; and the factors set forth under the heading "Risk Factors" in MPLX's Annual Report on Form 10-K for the year ended December 31, 2013, filed with the SEC. In addition, the forward-looking statements included herein could be affected by general domestic and international economic and political conditions. Unpredictable or unknown factors not discussed here, in MPC’s Form 10-K or in MPLX’s Form 10-K could also have material adverse effects on results.
Other Information Segment EBITDA and free cash flow are non-GAAP financial measures provided in this presentation. Segment EBITDA and free cash flow
reconciliations to the nearest GAAP financial measure are included in the Appendix to this presentation. Segment EBITDA and free cash flow are not defined by GAAP and should not be considered in isolation or as an alternative to net income, net cash provided by (used in) operating activities or other financial measures prepared in accordance with GAAP.
2

Our Priorities for Our Investors
Maintain top-tier safety and environmental performance
Sustain our focus on shareholder returns
Balance capital returns with value-enhancing investments
Grow higher valued and stable cash flow businesses
Midstream/MPLX
Speedway
Enhance the margins in our refining operations
3

Demonstrating Our Corporate Values The foundation for all that we do
4
Health and Safety
Environmental Stewardship
Honesty and Integrity
Corporate Citizenship
Diversity and Inclusion

Focused Return of Capital to Shareholders 6.4x free cash flow LTM
5
2,092 1,542
3,542
0
1,000
2,000
3,000
4,000
5,000
6,000
$MM
Dividends and sharerepurchases*
Cash capital expenditures,acquisitions andinvestments
Net cash provided byoperations
~6.4x of Free Cash
Flow**
* $491 MM dividends plus $3,051 MM share repurchases ** Cash flow provided by operations less cash capital expenditures, acquisitions and investments
Free Cash Flow**
$550
LTM Ended 3/31/14

Delivering Peer Leading Return of Capital
2.0% 2.6% 2.2% 1.7% 2.2%
4.2%
12.6% 2.1%
6.1% 6.3%
3.4%
0%
2%
4%
6%
8%
10%
12%
14%
16%
MPC HFC PSX TSO VLO
Dividend Yield Special Dividend Yield 2013 Share Repurchase/Share Yield
Total Capital Return Yield: 2013 Dividends per share, plus 2013 special dividends/share, plus 2013 share repurchases/share, all divided by 2013 average share price.
14.6%
8.9% 8.3% 8.0%
5.6%
Twelve months ended 12/31/13
6

Source: Company Reports
7
-5
0
5
10
15
20
1998 1999 2000 2001 2002 2003 2004 2005 2006 2007 2008 2009 2010 2011 2012 2013
$/BB
L
3 3 2
1
2 3
7
2
1
5
3
1 3
1
2
2
MPC’s Rank
Competitor Range
11 Companies Ranked* 12 11 9 10 9 8 9 9 8 10 8 8 8 8 8
Operating Income Per Barrel of Crude Throughput**
**Current companies ranked: BP, PSX, CVX, HFC, MPC, TSO, VLO, XOM **Adjusted domestic operating income per barrel of crude oil throughput
Engine behind MPC’s focus on capital returns Performing Consistently in the Top Tier

Predominately focused on refining
Pipeline Transportation Speedway Refining & Marketing
0
1,000
2,000
3,000
4,000
5,000
6,000
7,000
2007 2008 2009 2010 2011 2012 2013 2014
$MM
Allocating Capital in the Past
Segment Capital Expenditures* Segment EBITDA**
2007-2009: Garyville Major Expansion 2010-2012: Detroit Heavy Oil Upgrade Project 2013: Galveston Bay Purchase 2014E represents MPC full year 2014 capital budget of $2,299 MM *Includes investments **Non-GAAP disclosure, see appendix for reconciliation to net income attributable to MPC ***Through March 31, 2014
0
1,000
2,000
3,000
4,000
5,000
6,000
7,000
2007 2008 2009 2010 2011 2012 2013 2014E
$MM
8
Invested ~$0.9 B in Pipeline Transportation generated ~$1.7 B EBITDA Invested ~$1.2 B in Speedway generated ~$2.8 B EBITDA Invested ~$11 B in Refining & Marketing generated $22 B EBITDA
2007 through 2013:
LTM***

Allocating Capital in the Future Drive growth in more stable cash flow and higher value businesses
Sandpiper Pipeline Southern Access Extension
Pipeline Utica
Organic growth Selective acquisitions
Increase light crude processing
Increase distillate yield and conversion capacity
Grow export capacity
Refining Margin enhancements
Midstream/MPLX Aggressive growth
Speedway Growth in existing and contiguous markets
9

0
500
1,000
1,500
2,000
2,500
3,000
3,500
4,000
2012 2013 2014E 2015E 2016E
$MM
Refining and Marketing, excluding Midstream MidstreamPipeline Transportation SpeedwayOther Garyville resid upgrade project committedGaryville resid upgrade project uncommitted
*Excludes Galveston Bay asset acquisition
2012 – 2016 Capital Investment Profile
10
Allocating Capital to Higher Valued Businesses

Macro Outlook
11

Growing Gulf Coast Export Capabilities
Added new 500,000 barrel export tank at Garyville in 2013
Low cost, high return dock expansions at Garyville and Galveston Bay in design phase
Potential for 120 MBD incremental gasoline exports from Galveston Bay
12
150
320 350
475
0
50
100
150
200
250
300
350
400
450
500
2012 2013 2015E 2018+E
MBD
Export Capacity

Expecting Attractive Crude Spreads MPC Outlook*
Brent/WTI Spread
LLS/WTI Spread
Brent/LLS
North Dakota Light
Canadian Heavy Differentials
Differentials
$7-$12/BBL, wider at times
$5-$10/BBL, transportation/quality based
$3-$5/BBL, domestic light sweet crude surplus
Competes with WTI and LLS, prices accordingly
Attractive, but narrowing with new pipelines and coker capacity
Volatile, extreme at times and impossible to predict
13
*as noted during MPC Analyst & Investor Day on December 4, 2013

Cushing Inventory vs. PADD 3 Inventory
2Q 2013: Longhorn and Permian Express I allows Permian to clear to Houston. 3Q 2013: Large PADD 3 turnarounds lead to inventory builds. 4Q 2013: Weather issues reduce production; PADD 3 refinery runs increase 1 MMBD. 1Q 2014: Keystone Gulf Coast clears Cushing barrels to the Gulf Coast.
PADD 3 turnarounds reduce refinery runs by 0.8 MMBD.
14
100
125
150
175
200
225
250
275
25
30
35
40
45
50
55
60
Mar
-12
Apr-
12
May
-12
Jun-
12
Jul-1
2
Aug-
12
Sep-
12
Oct
-12
Nov
-12
Dec-
12
Jan-
13
Feb-
13
Mar
-13
Apr-
13
May
-13
Jun-
13
Jul-1
3
Aug-
13
Sep-
13
Oct
-13
Nov
-13
Dec-
13
Jan-
14
Feb-
14
Mar
-14
MM
B, PADD 3 MM
B, C
ushi
ng
Cushing, OK PADD 3
2Q13 4Q13 1Q14 3Q13
Source: EIA

Growth Opportunities
15

0
200
400
600
800
1,000
1,200
2007 2008 2009 2010 2011 2012 2013 2014E 2015E 2016E
$MM
Southern Access ExtensionSandpiperCondensate SplittersMidstream Infrastructure*
Increasing Midstream Growth Investments
*Includes MPLX spend and midstream investments included in the R&M segment. Excludes maintenance capital.
16

Investing in Significant Growth Projects North Dakota System (Sandpiper)
Superior, WI
SAX
Canadian
Bakken
Flanagan, IL
Patoka, IL
Logistics equity opportunity – MPC – Length, size: 610 Mile, 24”/30”
+ North Dakota Classic System and Bakken Pipeline U.S.
– Capacity: 580 MBD – In-Service: 1Q 2016 – MPC Investment: $1.0 B - $1.2 B – MPC Equity: 27% - 30% – Future potential drop to MPLX
Source: Enbridge
225 MBD
210 MBD Clearbrook, MN
Trenton
Superior, WI 60 MBD
Sandpiper
Minnesota Refineries
Beaver Lodge
Cromer Bakken Pipeline U.S.
145 MBD
North Dakota Classic Bakken Pipeline U.S.
17

Investing in Significant Growth Projects Southern Access Extension (SAX)
Patoka, IL
SAX
Bakken
Flanagan, IL
Superior, WI
Canadian
Logistics equity opportunity – MPC – Length, size: 165 Mile, 24” – Capacity: 300 MBD – In-Service: 2Q 2015 – MPC Investment: ~$250 MM – MPC Equity: 35% – Future potential drop to MPLX
Source: Enbridge
18

MPLX Developing a Comprehensive Utica System
Proposed MPLX Cornerstone Pipeline investment
$140 MM
Capacity
25+ MBD
Timing
Late 2016
$20 MM EBITDA
Youngstown
Lima
Canton
Ohio
Pa.
Wellsville Steubenville
MarkWest, Cadiz
M3, Leesville M3, Scio
To Toledo, Detroit, Chicago and Canada
Midland
MPC Refinery
Utica Gas Processing Facilities
Terminal Facilities
Proposed Cornerstone Pipeline
MPLX Products Pipeline
MPC Crude Pipeline
Future Build-out
19

Retained Midstream EBITDA of ~$800 MM
Additional Midstream Assets Retained by MPC
Refinery 59 MMBBL storage 25 rail loading racks and 24 truck loading racks 7 owned and 11 non-owned docks
27 owned and 2,138 leased 763 general service; 1,166 high pressure; 236 open-top hoppers
~5,400 miles of additional crude and products pipelines –Owns, leases or has an ownership interest in these pipelines –44% of MPLX Pipe Line Holdings LP
Railcars
Pipelines
64 light product; ~21 MMBBL storage; 194 loading lanes 19 asphalt; ~4 MMBBL storage; 68 loading lanes Terminals
184 owned and 16 leased inland barges; 4.9 MMBBL capacity 17 owned and one leased inland towboats Marine
20
As of December 31, 2013

MPLX will be MPC’s primary midstream growth vehicle
Large portfolio of fee-based growth projects that will be immediately accretive to distributable cash flow
Clear line of sight to MPC midstream asset portfolio to support growth
Pursuing numerous projects to continue to grow portfolio
Committed to maintain an attractive distribution growth profile over an extended period of time
MPLX Summary
21

384 399 453
719 795 825
0
500
1,000
1,500
2011 2012 2013
$MM
Mar
gin
Total Gross Margin Contribution
Light Product Merchandise
1,103 1,194 1,278
300
400
500
600
2,400
2,600
2,800
3,000
3,200
2011 2012 2013
$MM
Margin M
M G
allo
ns
Total Light Product Volume and Margin
Volume Margin
Growing More Predictable Merchandise Margin Speedway
600
700
800
900
1,000
2,400
2,600
2,800
3,000
3,200
2011 2012 2013
$MM
Margin $M
M S
ales
Total Merchandise Sales and Margin
Sales Margin
2011-2013 Average
65%
35%
Total Gross Margin Mix
Light Product
Merchandise
22

Executing Significant Organic Growth Opportunities Speedway
18 18 38 60 65 65 5 99 9
0
50
100
150
2007-2011 Average
2012 2013 2014E 2015E 2016E
New and Rebuild Projects Acquisitions
050
100150200250300350
2007-2011Average
2012 2013 2014E 2015E 2016E
$MM
Store Construction Acquisitions All Other
327 300 300 296
340
103
# of Stores
Capex
23

Growing Cash Flow Through All Cycles Speedway
404 381 424
487 500 560
630
250
350
450
550
650
2010 2011 2012 2013 2014E 2015E 2016E
$MM
Segment EBITDA*
*Non-GAAP disclosure, see appendix for reconciliation to Speedway segment income from operations
24

Enhance Refining Margins
25

Increasing Light Sweet Crude and Condensate Capacity
Condensate splitters Canton: 25 MBD
– 4Q 2014 completion
Catlettsburg: 35 MBD – 2Q 2015 completion
$250 MM >30% ROI for each project
Light crude processing Robinson: +30 MBD light crude $160 MM ~60% ROI, 2016 completion
Ultra- New Light Naphtha to Gasoline BlendingSweet Fractionator Heavy Naphtha to ReformingCondensate Distillates to Hydrotreating
Heavier Components
Conventional Existing To DownstreamCrude Crude Unit Process Units
Condensate Processing Opportunity
26

Leveraging Existing Capacity to Run Light Sweet Crude
Reformer capacity captures full value of light crude processing
Additional value added through aromatics production
05
1015202530
MPCMidwest
MPCUSGC
Perc
ent o
f Cru
de C
apac
ity
Reforming Capacity
Source: 2014 Oil & Gas Journal
Industry Average
Sources: Argus DeWitt Aromatics Reports 2011-12 and MPC internal data. Benzene, toluene, mixed xylenes, and cumene shown. Xylene revised.
27
0
20
40
60
80
100
120
MBP
CD
U.S. Aromatics Capacity

Capitalizing on Global Growth in Diesel Demand
Garyville +25 MBD ULSD in 2014-15 $225 MM ~45% ROI
Galveston Bay +9 MBD ULSD in 2015 $18 MM ~70% ROI
Robinson +5 MBD ULSD in 2015 $77 MM ~20% ROI
Hydrocracker expansions/revamps
32
34
36
38
2012 2013 2014E 2015E 2016E
Distillate Production
300
400
500
600
700
2012 2013 2014E 2015E 2016E
Distillate Production
Perc
ent o
f Cru
de C
apac
ity
MBD
28

Evaluating Garyville Resid Hydrocracker Project
$130 MM sanctioned for front- end engineering and design
Increases ULSD production by 28 MBD and decreases gas oil purchases
Converts low value resid to ULSD using hydrogen produced from low cost natural gas
20 - 25% ROI
$0.8 - $1.0 B EBITDA
$2.2 - $2.5 B investment, 2018 start-up
Conversion opportunity - leverages favorable market dynamics
29

2014 Value Drivers
Top-tier safety and environmental performance
Capital return to shareholders Strong and growing dividend Share repurchase program
2014 $2.4 B capital investments
Growth of Midstream/MPLX
Speedway growth
Increasing light crude processing and export capabilities
Enhancing margins in our refining operations
30

Appendix
31

Fully Integrated Downstream System
32
Coastal Water Terminals
Inland Water Terminals
Light Product Terminals
Connecting Pipelines
Refineries
Asphalt Terminals
Marketing Area
Tank Farms
Butane Cavern
Barge Dock As of December 31, 2013
Refining and Marketing Seven-plant refining system with ~1.7 MMBPCD capacity One of the largest wholesale suppliers in our market area One of the largest producers of asphalt in the U.S. ~5,200 Marathon Brand retail outlets across 18 states ~1,000 retail outlet contract assignments through
jobbers primarily in Fla., Tenn., Miss. and Ala. Owns/operates 64 light product terminals and
19 asphalt terminals, while utilizing third-party terminals at 60 light product and 10 asphalt locations
17 owned and one leased inland waterway towboats with 184 owned barges and 16 leased barges, 2,165 owned/leased railcars, 170 owned transport trucks
Speedway (Retail) ~1,480 locations in nine Midwestern states Fourth largest U.S. owned/operated c-store chain ~2.4 million customer transactions on a daily basis
Pipeline Transportation Owns, leases or has interest in ~8,300 miles of pipelines One of the largest petroleum pipeline companies in U.S. Part ownership in non-operated pipelines includes
Explorer, LOCAP, LOOP, Maumee and Wolverine
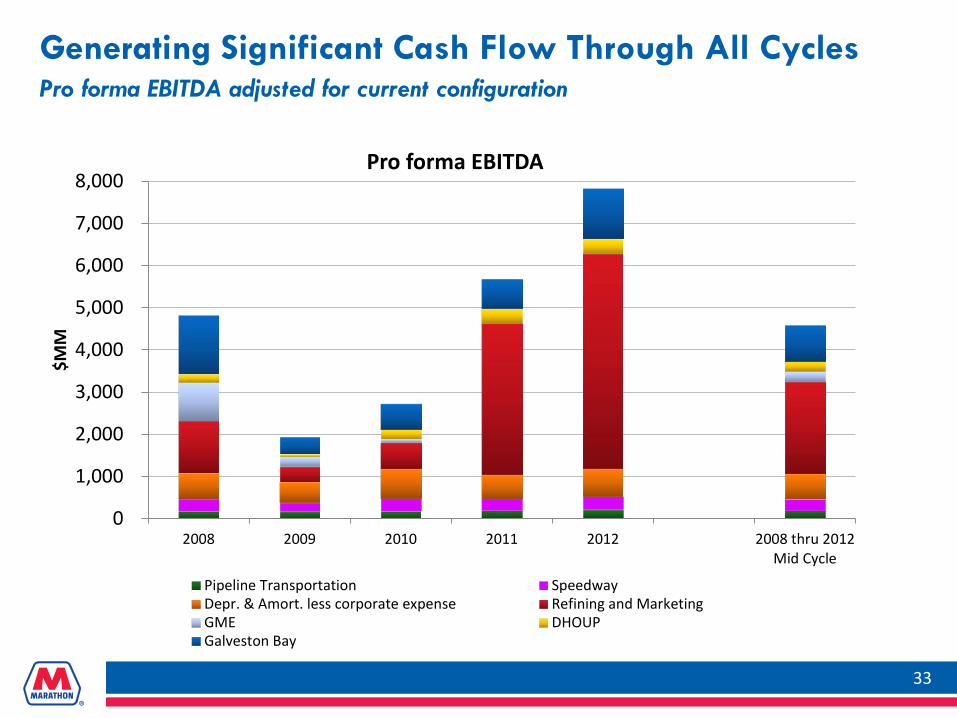
Generating Significant Cash Flow Through All Cycles Pro forma EBITDA adjusted for current configuration
0
1,000
2,000
3,000
4,000
5,000
6,000
7,000
8,000
2008 2009 2010 2011 2012 2008 thru 2012Mid Cycle
$MM
Pro forma EBITDA
Pipeline Transportation SpeedwayDepr. & Amort. less corporate expense Refining and MarketingGME DHOUPGalveston Bay
33

Sustaining Core Liquidity Needs Minimum cash balance of $500 MM - $1.5 B
Ongoing Operating Cash Flow Requirements – Maintenance/Sustaining Capital – Interest Payments – Dividend Payments
Contingent Calls on Corporate Liquidity - Probability Adjusted – Contingent and Uncommitted Letters of Credit – MPC Credit Shock and Impact on Unsecured Lines (Crude Purchases) – Major Operating Upset – Working Capital Shock
Reduced by - Cash Flow from Operations Under Stressed Scenario
Committed Facilities – MPC Revolving Credit Facility $2,500 – Trade Receivables Facility $1,300
Targeted Cash and Near-Cash Equivalents $500 - $1,500 MM
~$4,200 - $5,200 MM
$3,800 MM
Requirements
Liquidity Sources
34

Sustaining Capital Returns Since Spin
0
1,000
2,000
3,000
4,000
5,000
6,000
7,000
Q3 2011 Q4 2011 Q1 2012 Q2 2012 Q3 2012 Q4 2012 Q1 2013 Q2 2013 Q3 2013 Q4 2013 Q1 2014
$MM
Dividends Share repurchases
$6 B
Cumulative Return of Capital Since July 1, 2011
35

0
20
40
60
80
100
120 Forecast Actual
Growing Global Product Demand
Distillate and gasoline demand continues to rise
Fuel oil continues to be phased out due to tightening sulfur specs
Sources: BP Statistical Review of World Energy, MPC
Gasoline
Distillate
Fuel Oil
36
+1.2%
-1.6%
+1.4%
+0.9%
Other
Compounded Annual
Growth Rates 2030 vs. 2013 2013
MM
BD
“Other” consists of refinery gas, liquefied petroleum gas (LPG), solvents, petroleum coke, lubricants, wax, and other refined products and refinery fuel “Distillate” includes jet fuel “Gasoline” includes naphtha

Growing U.S. Distillate Demand
Distillate demand growth outpaces other products
Gasoline will be constrained by CAFE standards and biofuels penetration
Residual fuel demand continues to fall
Overall U.S. demand remains flat
-0.3%
-0.4%
+1.5%
+0.7%
Sources: DOE/EIA, MPC
-2.9%
Compounded Annual
Growth Rates 2030 vs. 2013
37
MM
BD
2013
0
1
2
3
4
5
6
7
8
9
10
Gasoline
Gasoline ex ethanol
Distillate
Jet Fuel
Resid
Forecast Actual

Rising North American Production
Sources: EIA, CAPP, MPC
38
2013
0
5
10
15
20
25
1985 1990 1995 2000 2005 2010 2015 2020 2025 2030
MM
BD
U.S.
Canada
Forecast Actual

Growing Crude Oil/Condensate Supply
Forecast Actual
Forecast Actual
Forecast Actual
Bakken +829 MBD
Utica +106 MBD
Permian +826 MBD
Eagle Ford +695 MBD
Canada +2,549 MBD
Total U.S. Growth +3,506 MBD
MPC Refinery
Sources: EIA, CAPP, MPC
39
Niobrara +286 MBD
Total Growth 2013 – 2025 +6,055 MBD
0200400600800
1,0001,2001,4001,6001,800
1990 1995 2000 2005 2010 2015 2020 2025 2030
MBD
North Dakota
← Actual Forecast →
2013
0500
1,0001,5002,0002,5003,0003,5004,0004,500
1990 1995 2000 2005 2010 2015 2020 2025 2030
MBD
Texas
← Actual Forecast →
2013
020406080
100120140
1990 1995 2000 2005 2010 2015 2020 2025 2030
MBD
Ohio
← Actual Forecast →
2013

Refining Capacity in Advantaged Regions 100% in PADDs II and III
PADD III
PADD V
PADD IV PADD II
0%
20%
40%
60%
80%
100%
MPC VLO HFC PSX TSO
PADD II PADD III PADD I PADD IV PADD VPADD I PADD II PADD III PADD IV PADD V
Canadian Bakken Utica
Permian Basin Eagle Ford Gulf of Mexico Canadian
PADD I
40
Source: Oil & Gas Journal effective December 31, 2013

Refinery Capacity
The Nelson Complexity Index is a construction cost-based measurement used to describe the investment cost of a refinery in terms of the process operations being conducted. It is basically the ratio of the process investment downstream of the crude unit to the investment of the crude unit itself. This index has many limitations as an indicator of value and is not necessarily a useful tool in predicting profitability. There is no consideration for operating, maintenance or energy efficiencies and no consideration of non-process assets such as tanks, docks, etc. Likewise it does not consider the ability to take advantage of market related feedstock opportunities.
BPCD NCI*
Garyville 522,000 11.0
Galveston Bay 451,000 13.1
Catlettsburg 242,000 10.2
Robinson 212,000 10.0
Detroit 123,000 9.9
Texas City 84,000 8.0
Canton 80,000 8.8
Total 1,714,000 11.0**
**Weighted Average NCI Source: MPC data as reported in the Oil & Gas Journal effective December 31, 2013
*Nelson Complexity Index calculated per Oil & Gas Journal NCI Formula
41

Balance in Refining Network
Midwest Capacity 657,000 BPCD
Louisiana Capacity 522,000 BPCD
Texas Capacity 535,000 BPCD
Canton (Ohio) 80,000
Catlettsburg (Ky.) 242,000
Detroit (Mich.) 123,000
Robinson (Ill.) 212,000
Galveston Bay (Texas) 451,000
Texas City (Texas) 84,000
Garyville (La.) 522,000
Total 1,714,000
42
Source: MPC data as reported in the Oil & Gas Journal effective December 31, 2013

Portland
Cushing
Superior Clearbrook
Regina
Cromer
Montreal
Burnaby
Anacortes
Edmonton Trans
Mountain
Chicago Casper
Wood River
Patoka
Sarnia
Mustang SAX
Hardisty
Steele City
Seaway
Houston Freeport
St James Houma Ho-Ho
MBPD Pipeline Estimated
Completion
540 Keystone Current
215 Ozark Current
170 Platte Current
190 Spearhead Current
150 400 850
Seaway Phase 1 Seaway Phase 2 Seaway Phase 3
Current Current 2H 2014
250 360
Ho-Ho Reversal – 1 Ho-Ho Reversal – 2
Current Current
700 Keystone Gulf Coast Current
600 Flanagan South Mid 2014
300 Line 9 2H 2014
300 SAX 2Q 2015
225-375 Sandpiper 1Q 2016
830 Keystone XL 2017
1,100 Energy East 2017
Flanagan South
Flanagan
U.S./Canada Key Existing and Planned Pipelines
MPC Refineries
Planned Keystone XL
Keystone
Planned Seaway Expansion
Ho-Ho Reversal
Planned Flanagan South
Planned SAX Planned Line 9
Planned Energy East
Planned Sandpiper
Sources: Publicly available Information, MPC Estimates
43
Keystone GC

38%
62%
Crude Oil Refining Capacity
PADD IIPADD III
Key Strengths
44
Balanced Operations
49% 51%
Crude Slate
Sour Crude
Sweet Crude
~58%
~42% Assured Sales
Wholesale andOther Sales
Assured Sales of Gasoline Production (Speedway + Brand + Wholesale Contract Sales)
As of March 31 , 2014
As of March 31, 2014 As of March 31 , 2014

Compelling Advantage for Pipeline and Marine
Patoka, IL
Houston, TX $2
$5
$2 $14-16
$13-15
$6-7
$4
Chicago, IL
All costs shown as $/BBL Pipeline costs exclude any storage or transfer fees and line loss Sources: MPC, publicly available information
$10-12
$5-6
LLS
$15-16
Legend Rail Pipeline Marine
WTI
$12-14 $5
Bakken
Canadian
$10
St. James, LA
Cushing, OK
45

Creating Crude/Condensate Advantage
Bakken +829 MBD
Utica +106 MBD
Truck Unload Expansion
Wellsville Barge
Condensate Splitter
Permian +826 MBD
Eagle Ford +695 MBD
Patoka, IL
Production volumes are 2030 estimates vs. 2013 actual Sources: MPC, EIA, CAPP
Cornerstone Pipeline
MPC Refinery
Sandpiper
Southern Access Extension
Robinson Light Crude
Enhancements
Connectivity Enhancements
Additional Barging
Condensate Splitter
Canada +2,549 MBD
46

Garyville Resid Hydrocracker Project Increase production of ULSD and refinery intermediates
47
Hydrogen LPG to Sales
Naphtha to ReformerSlurry
ULSD to Sales
Vacuum Resid Gas oil to FCC
Unconverted Resid to Coker
EB Hydrocracker
Feeds MBPD
Vacuum Resid 63
FCC Slurry 7
Hydrogen (mmscfd) 110
Products MBPD
LPG 2
Naphtha 7
ULSD 23
Gas Oil 22
Unconverted Resid 23
Resid Hydrocracker

Increasing Throughputs and Lowering Costs
Excellent HES record
Higher refinery throughputs and lower operating costs
Focused on reliability and yield improvements >$38 MM margin improvements
captured
Implementing MPC’s Refining Standards
Galveston Bay’s first year
48

Processing More Price Advantaged Crude Oil
Eliminated foreign sweets and increased Canadian Heavy imports
North American crudes increased from 63% to 85%
Galveston Bay’s first year
Tanker
Galveston Bay
Permian Basin
Foreign
Gulf of Mexico
Canadian/ Bakken
Eagle Ford Various Pipelines
Longhorn BridgeTex
Permian Express Kilgore
Seaway Keystone XL
Enterprise Barge
49

Sustaining expenditures trending lower
Note: Excludes synergy and other value accretive investments, excludes Tier 3 investments. Major Maintenance includes turnarounds and other large related maintenance expenditures.
0
200
400
600
800
1,000
2013E 2014E 2015E 2016E
$MM
Original Capital Original Major MaintenanceCurrent Capital Current Major Maintenance
2013 2014E 2015E 2016E
50
Galveston Bay

Galveston Bay
Revamp crude and vacuum units Optimize for future crude
availability Improve distillate recovery
Add hydrotreating capacity Move to 100% ULSD
Idle the smallest and oldest FCC
Expand export capabilities
Long-term opportunities
51

0
50
100
150
200
250
2010 2011 2012 2013 1Q2014
MBD
Rising MPC Finished Product Exports
52

MPC and Corn Ethanol
67% equity interest* in Greenville, Ohio, ethanol plant (110 MM gal/year capacity)
60% equity interest in Clymers, Indiana, ethanol plant (110 MM gal/year capacity)
43% equity interest in Albion, Michigan, ethanol plant (55 MM gal/year capacity)
The Andersons operates the ethanol plants and provides services to them, such as corn origination, natural gas purchasing, and product marketing
Products include: Denatured Ethanol
E-85 Transportation Fuel
Distillers Dried Grains
Corn Oil
53
*Direct and indirect

2014 Significant Capital Projects
Sandpiper investment
Southern Access Extension investment
Utica Shale projects Condensate splitters Utica system
Speedway expansion
Robinson hydrocracker revamp
Garyville resid hydrocracker engineering design and study
Garyville and Galveston Bay gasoline and diesel export
54

Capital Expenditures & Investments
($MM) 2014 MPC Budget 1Q 2014
Refining & Marketing (R&M) 864 143
Midstream included in R&M 348 35
Speedway 327 32
Pipeline Transportation* 760 130
Corporate and Other 133 25
Total Capital Expenditures & Investments 2,432 365
($MM) 2014 MPLX Budget (100% basis) 1Q 2014
Growth 113 3
Maintenance 35 2
Total Capital Expenditures 148 5
*Includes MPLX (100% basis) Note: Excludes capitalized interest
Note: Excludes capitalized interest
55

Annual Price and Margin Sensitivities $ Millions (After Tax)
LLS 6-3-2-1 Crack Spread* Sensitivity ~$450 (per $1.00/barrel change) Sweet/Sour Differential** Sensitivity ~$200 (per $1.00/barrel change) LLS-WTI Spread*** Sensitivity ~$85 (per $1.00/barrel change) Natural Gas Price Sensitivity ~125 (per $1.00/MMbtu change in Henry Hub)
*Weighted 38% Chicago and 62% USGC LLS 6-3-2-1 crack spreads and assumes all other differentials and pricing relationships remain unchanged
**Light Louisiana Sweet (prompt) - [Delivered cost of sour crudes: Arab Light + Kuwait + Maya + Western Canadian Select + Mars]
***Assumes 20% of crude throughput volumes are WTI-based domestic crudes
56

Our Priorities for Our Investors
57
$20
$25
$30
$35
$40
$45
$50
$55
$60
10/2
5/12
12/2
5/12
02/2
5/13
04/2
5/13
06/2
5/13
08/2
5/13
10/2
5/13
12/2
5/13
02/2
5/14
04/2
5/14
Unit Price
IPO
Source: Thomson Reuters
Maintain Safe and Reliable Operations
Sustain Long-term Distribution Growth
Focus on Fee-Based Businesses
Pursue Organic Growth Opportunities
Grow Through Acquisitions

MPC views MPLX as integral to its operations and is aligned with its success and incentivized to grow MPLX
MPLX assets consist of a 69% interest in Pipe Line Holdings as well as 100% ownership in the Neal, W.Va., Butane Cavern
MPC retains the remaining 31% interest in Pipe Line Holdings
MPC also owns 71.6% LP interest and 100.0% of MPLX’s GP interest and IDRs
31.0% limited partner interest
100.0% ownership interest
100.0% ownership interest
MPLX Operations LLC
r
MPLX Terminal and Storage LLC
100.0% ownership interest Public
100.0% ownership interest
2.0% GP interest 26.4% LP interest
Marathon Pipe Line LLC (“MPL”)
69.0% GP interest
Ohio River Pipe Line LLC (“ORPL”)
MPLX GP LLC (our General Partner)
71.6% LP interest
100.0% ownership interest
MPLX LP (NYSE: MPLX)
(the “Partnership”)
MPLX Pipe Line Holdings LP (“Pipe Line Holdings”)
Marathon Petroleum Corporation and Affiliates
(NYSE: MPC)
MPLX Organizational Structure
MPLX and MPC are Aligned
58
As of March 1, 2014

Investing in Significant Growth Projects ~$2.2 B investment with potential annual EBITDA of up to $300 MM
MPC Projects Timing Investment $MM
North Dakota Pipelines Equity Option 2016 $1,200
Condensate Splitters 2013-2015 $250
SAX Equity Option 2015 $250
Wellsville Truck to Barge Operation 2013 $30
Other 2013-2014 $220
Total $1,950
MPLX Projects Timing Investment $MM
Cornerstone Pipeline (Utica Shale) 2016 $140
Robinson to Mt. Vernon 2014-2016 $70
Other 2015-2016 $75
Total $285
59

Leveraging Existing MPC Assets
Expand refinery processing capacity to leverage geographic advantage Condensate splitters at Canton and Catlettsburg
– Increases total crude plus condensate processing capacity to 60 MBD from ~25 MBD
Phased infrastructure investment Truck Barge Pipeline
Develop connectivity Canton Catlettsburg Ohio River system to Robinson
and USGC Regional refining markets
– Lima, Toledo, Detroit
Utica Shale Strategy
2012-2016 Projects $MM
Condensate Splitters – MPC 250
Cornerstone Pipeline – MPLX 140
Two Rivers Pipeline to Robinson – MPLX 70
Wellsville Truck to Barge Operation – MPC 30
Other* – MPC/MPLX 150
Total 640 *Other includes: Barges, Moreland Pipeline Injection Station, Canton Crude
Truck Unload & Crude Oil Trucks
60

Drop-down Strategy Considerations
MPC created MPLX to grow midstream business and create a funding mechanism for strategic opportunities
MPLX investors highly value a consistent, long-term growth strategy
Ratable drops maximize value creation and retain flexibility for MPC
Committed to maintain an attractive distribution growth profile over an extended period of time
Larger drops will be considered if they meet strategic need
MPLX is establishing an optimized capital structure
Preparing MPC retained assets to be dropped, including tax considerations
61

MPLX Deficiency Payment Effect Example for illustrative purposes only
62
($MM)
Quarter 1
Quarter 2
Quarter 3
Quarter 4
Quarter 5
Quarter 6
Quarter 7
Quarterly deficiency payment 2 5 3 5 - - -
Use or expiration of credit (on or before) - - - - 2 5 3
Cumulative deferred revenue 2 7 10 15 13 8 5
Distributable cash flow Yes Yes Yes Yes No No No
Adjusted EBITDA No No No No Yes Yes Yes

Incentive Distribution Rights
63
Total Quarterly Distribution Per Unit Target Amount
Marginal Percentage Interest in Distributions
Unitholders General Partner
Minimum Quarterly Distribution $0.2625 98.0% 2.0%
First Target Distribution above $0.2625 up to $0.301875 98.0% 2.0%
Second Target Distribution above $0.301875 up to $0.328125 85.0% 15.0%
Third Target Distribution above $0.328125 up to $0.393750 75.0% 25.0%
Thereafter above $0.393750 50.0% 50.0%

EBITDA Reconciliation to Net Income Attributable to MPC
($MM) 2007 2008 2009 2010 2011 2012 2013 2014
1Q 2Q 3Q 4Q 1Q
Net income attributable to MPC 2,262 1,215 449 623 2,389 3,389 725 593 168 626 199
Less: Net interest and other financial income (costs) 165 30 31 12 (26) (109) (48) (45) (47) (39) (46)
Add: Net income attributable to noncontrolling interests - - - - - 4 5 6 5 5 8
Add: Provision for income taxes 1,164 670 236 400 1,330 1,845 378 316 81 338 108
Add: Total segment depreciation and amortization 582 604 670 912 873 972 281 297 294 325 308
Add: Items not allocated to segments 147 (11) 182 265 316 277 67 124 82 93 131
Total Segment EBITDA 3,990 2,448 1,506 2,188 4,934 6,596 1,504 1,381 677 1,426 800
By Segment
Refining & Marketing Segment EBITDA 3,413 1,819 950 1,539 4,309 5,902 1,341 1,155 473 1,248 623
Speedway Segment EBITDA 312 408 343 404 381 424 94 150 131 112 86
Pipeline Transportation Segment EBITDA 265 221 213 245 244 270 69 76 73 66 91
Total Segment EBITDA 3,990 2,448 1,506 2,188 4,934 6,596 1,504 1,381 677 1,426 800
Last Twelve Months Segment EBITDA 6,509 5,127 4,988 4,284
64

Reconciliation
65
($MM) 2013 2014 (Quarter to date) 2Q 3Q 4Q 1Q
Net cash provided by (used in) operating activities (436) 407 1,355 766
Additions to property, plant and equipment (229) (309) (473) (267)
Acquisitions* (22) - - -
Investments (6) (75) (38) (123)
Free cash flow (693) 23 844 376
Last twelve months free cash flow 550
Free Cash Flow to Net Cash Provided by (Used in) Operations
*Represents cash paid

Reconciliation Speedway Segment EBITDA to Speedway Segment Income from Operations
($MM) 2010 2011 2012 2013 2014E 2015E 2016E
Speedway Segment Income from Operations 293 271 310 375 380 431 493
Plus: Depreciation and Amortization 111 110 114 112 120 129 137
Speedway Segment EBITDA 404 381 424 487 500 560 630
66

2Q 2014 Outlook
67
Crude Throughput*
Other Charge/
Feedstocks Throughput*
Total Throughput*
Percent of WTI-priced
Crude
Turnaround and Major
Maintenance
Depreciation and
Amortization
Other Manufacturing
Cost**
Total Direct
Operating Costs
Corporate and Other
Unallocated Items***
in MMBD Refinery Direct Operating Costs****
Proj
ecte
d
2Q 2
014
Gulf Coast Region 1,075 175 1,250 3% $0.80 $1.05 $4.25 $6.10
Midwest Region 650 50 700 41% $2.05 $1.70 $4.40 $8.15
MPC Total 1,725 175 1,900 17% $1.30 $1.30 $4.40 $7.00 $80 MM
2Q 2
013
Gulf Coast Region 1,037 157 1,194 11% $0.60 $1.00 $4.01 $5.61
Midwest Region 653 54 707 40% $0.90 $1.68 $3.96 $6.54
MPC Total 1,690 174 1,864 22% $0.73 $1.28 $4.06 $6.07 $124 MM
*Region throughput data includes inter-refinery transfers, but MPC totals exclude transfers **Includes utilities, labor, routine maintenance and other operating costs ***Includes pension settlement expense ($5MM and $60MM pension settlement expense included in 2Q 2014 and 2Q 2013, respectively) ****$/barrel throughput

Market Indicators Used in Project EBITDA Calculations
2012 2014-2020
ULSD (USGC; $/BBL) $128.14 $136.33
No. 6, 3.0% S Fuel Oil (USGC; $/BBL) $99.32 $94.48
LLS (St. James, LA; $/BBL) $111.67 $114.82
Natural Gas (Henry Hub, LA; $/MMBTU) $2.79 $4.75
68