Investor Presentation January 2019 vFinal
27
1 Investor Relations January 2019
Transcript of Investor Presentation January 2019 vFinal

1
Investor RelationsJanuary 2019
Forward-Looking StatementsThe following presentation contains forward-looking statements which are protected as forward-looking statements under the PSLRA,
and which are based on management’s current expectations and beliefs, as well as a number of assumptions concerning future events.
The assumptions and estimates underlying forward-looking statements are inherently uncertain and are subject to a wide variety of
significant business, economic, and competitive risks and uncertainties that could cause actual results to differ materially from those
contained in the prospective information. Accordingly, there can be no assurance that we will achieve the future results we expect or
that actual results will not differ materially from expectations. Statements concerning current estimates, expectations and projections
about future results, performance, prospects, opportunities, plans, actions and events and other statements, concerns, or matters that
are not historical facts are “forward-looking statements”. These statements include, but are not limited to, statements regarding future:
crude oil capacities, production area, quality and price advantages, pricing and gathering system capacity; access to shale fields
and/or domestic, locally gathered and/or Canadian crude oils; conversion and distillate yields; fertilizer facility flexibility, storage
availability, marketing agreements and netbacks; cost of operations; throughput and production; favorability of the macro environment
including global crude oil supply, increased shale oil production, takeaway capacity, product demand, growth of global economies
sustainably or at all, price environment, impacts of IMO 2020 and political and legislative landscapes; crude oil and condensate
differentials; crack spreads; strategic initiatives including EHS improvements, ability to deliver high quality and profitable crude oil to our
refineries, reduction of RINs exposure, biodiesel blending, development of wholesale or retail businesses, expansion of optionality to
process WCS, light share oil and/or natural gas, improvement of liquid yield at Wynnewood by 3.5% or at all, reduction of SG&A casts,
headcount reductions, ERP utilization, reduction of lost opportunities and improved capture rates; capital expenditures and turnaround
expense; the Benfree, Isom and crude oil optionality projects including the required internal and third party authorization, costs, timing,
returns, benefits and impacts thereof; ability to serve Southern Plains and Corn Belt areas; ability to minimize distribution costs and
maximize netbacks; global fertilizer demand and nitrogen consumption; corn applications, uses, production, stocks, pricing and crops;
ethanol consumption; population growth; decrease in farmland; biofuel consumption; diet evolution in developing countries; nitrogen
capacity, supply and demand; on stream factors; feedstock costs; sales revenue; continued safe and reliable operations; and other
matters. You are cautioned not to put undue reliance on such forward-looking statements (including forecasts and projections regarding
our future performance) because actual results may vary materially from those expressed or implied as a result of various factors,
including, but not limited to those set forth under “Risk Factors” in the Annual Reports on Form 10-K, Quarterly Reports on Form 10-Q and
any other filings with the Securities and Exchange Commission by CVR Energy, Inc. (“CVI”), CVR Refining, LP (“CVRR”) or CVR Partners, LP
(“UAN”). These forward-looking statements are made only as of the date hereof. Neither CVI, CVRR nor UAN assume any obligation to,
and they expressly disclaim any obligation to, update or revise any forward-looking statements, whether as a result of new information,
future events or otherwise, except as required by law.
2

CVR Energy, Inc. (NYSE: CVI)
3 3
Our mission is to be a top-tier North American petroleum refining and nitrogen-based fertilizer company as
measured by safe and reliable operations, superior financial performance and profitable growth.
Our core values define the way we do business every day to accomplish our mission.
The foundation of our company is built on these core values. We are responsible to apply our core values in all the decisions we make and actions we take.
Safety - We always put safety first.
The protection of our employees, contractors and communities is paramount. We have an unwavering commitment to safety above all else. If it’s not safe, then we don’t do it.
Environment - We care for our environment.
Complying with all regulations and minimizing any environmental impact from our operations is essential. We understand our obligation to the environment and that it’s our duty to protect it.
Integrity - We require high business ethics.
We comply with the law and practice sound corporate governance. We only conduct business one way—the right way with integrity.
Corporate Citizenship - We are proud members of the communities where we operate.
We are good neighbors and know that it’s a privilege we can’t take for granted. We seek to make a positive economic impact through our financial donations and the contributions of time, knowledge and talent of our employees to the places where we live and work.
Continuous Improvement - We believe in both individual and team success.
We foster accountability under a performance-driven culture that supports creative thinking, teamwork and personal development so that employees can realize their maximum potential. We use defined work practices for consistency
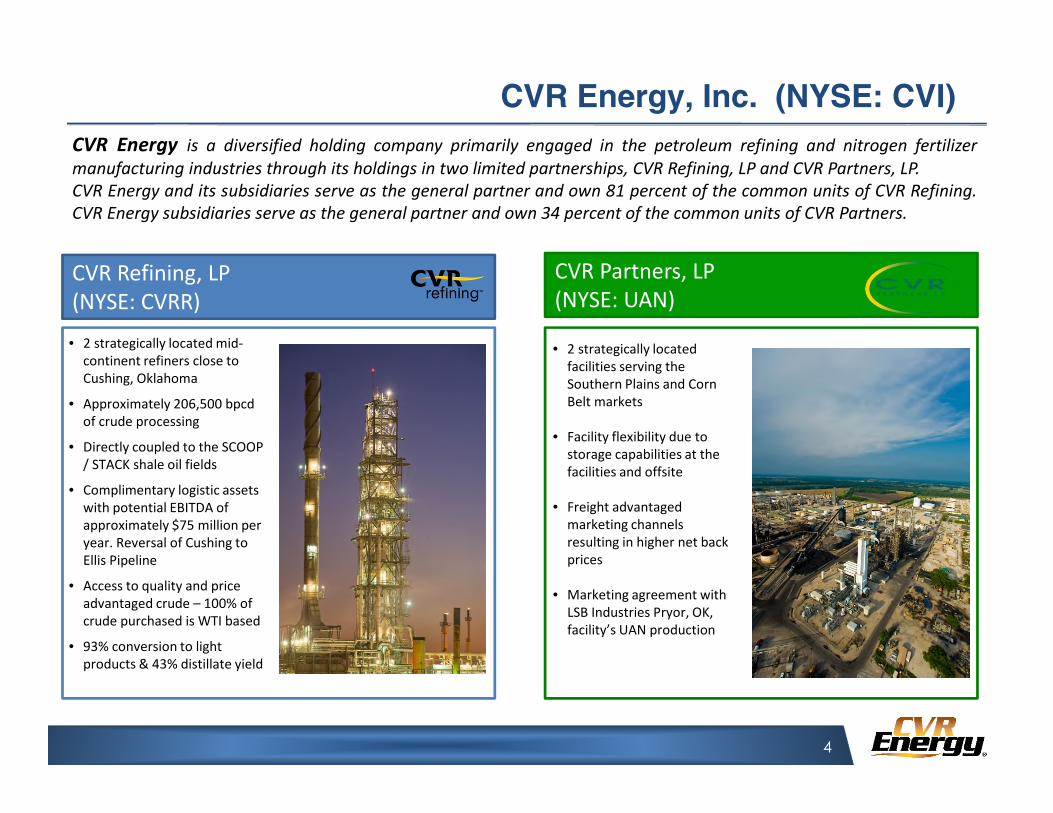
CVR Refining, LP(NYSE: CVRR)
CVR Partners, LP (NYSE: UAN)
CVR Energy, Inc. (NYSE: CVI)
4 4
CVR Energy is a diversified holding company primarily engaged in the petroleum refining and nitrogen fertilizermanufacturing industries through its holdings in two limited partnerships, CVR Refining, LP and CVR Partners, LP.CVR Energy and its subsidiaries serve as the general partner and own 81 percent of the common units of CVR Refining.CVR Energy subsidiaries serve as the general partner and own 34 percent of the common units of CVR Partners.
• 2 strategically located facilities serving the Southern Plains and Corn Belt markets
• Facility flexibility due to storage capabilities at the facilities and offsite
• Freight advantaged marketing channels resulting in higher net back prices
• Marketing agreement with LSB Industries Pryor, OK, facility’s UAN production
• 2 strategically located mid-continent refiners close to Cushing, Oklahoma
• Approximately 206,500 bpcd of crude processing
• Directly coupled to the SCOOP / STACK shale oil fields
• Complimentary logistic assets with potential EBITDA of approximately $75 million per year. Reversal of Cushing to Ellis Pipeline
• Access to quality and price advantaged crude – 100% of crude purchased is WTI based
• 93% conversion to light products & 43% distillate yield


Asset Footprint
Refining- 206,500 bpcd of nameplate crude distillation capacity- Located in Group 3 of PADD II
Cushing & SCOOP / STACK Centric- Our refineries are strategically located. ~ 100 to 130 miles from Cushing, OK
- Historical space on key pipelines
- Access to domestic inland, locally gathered and Canadian crudes
Logistics- Crude oil gathering system with capacity over 115,000 bpd serving Kansas, Nebraska, Oklahoma and Missouri
6

Strategically Located Mid-Con Refineries
7
Crude Supply Network Marketing Network
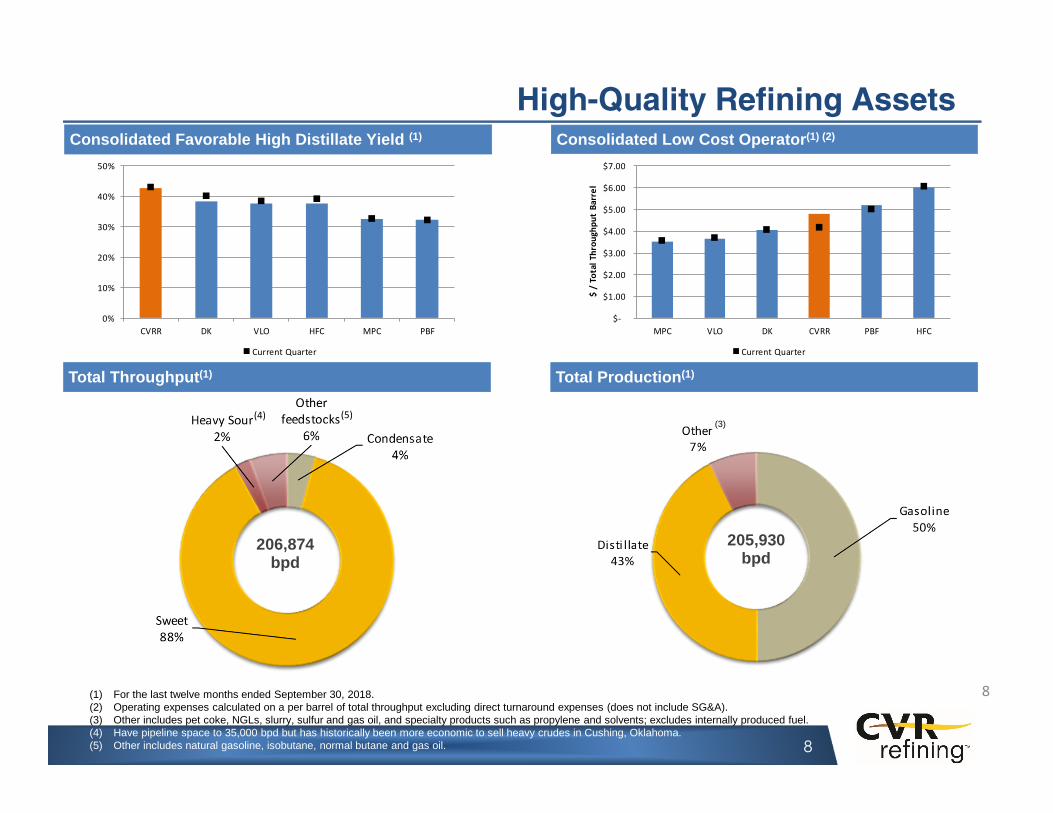
High-Quality Refining Assets
8
Total Throughput(1) Total Production(1)
206,874 bpd
205,930bpd
8
(3)
Consolidated Favorable High Distillate Yield (1) Consolidated Low Cost Operator(1) (2)
(1) For the last twelve months ended September 30, 2018.(2) Operating expenses calculated on a per barrel of total throughput excluding direct turnaround expenses (does not include SG&A). (3) Other includes pet coke, NGLs, slurry, sulfur and gas oil, and specialty products such as propylene and solvents; excludes internally produced fuel.(4) Have pipeline space to 35,000 bpd but has historically been more economic to sell heavy crudes in Cushing, Oklahoma.(5) Other includes natural gasoline, isobutane, normal butane and gas oil.
$-
$1.00
$2.00
$3.00
$4.00
$5.00
$6.00
$7.00
MPC VLO DK CVRR PBF HFC
$ /
To
tal
Thro
ugh
pu
t B
arre
l
Current Quarter
0%
10%
20%
30%
40%
50%
CVRR DK VLO HFC MPC PBF
Current Quarter
(4) (5)

Favorable Macro Environment
9
Feedstock Supply
Product Demand
• Increased U.S. shale-oil production• Limited Canadian pipeline takeaway capacity • Access to price-advantaged crudes such as Permian, Canadian and Shale
• Global economies aligned for sustainable growth• Sustained product demand driven by:
• lower price environment • IMO 2020
Regulatory Landscape
• Constructive deregulation• Positive Energy development in the U.S.• Low RIN prices
• Exports

Favorable Macro Environment
10
Source: Market view as of January 4, 2019

Strategic Initiatives
11
• To continue and improve in all Environmental,Health and Safety matters. Safety is Job 1.
Safe operation is generally a reliable operation
• Leverage our strategic location and ourproprietary gathering system to deliver highquality and profitable crude to our refineries.
• Reduce our Renewable Identification Numberexposure.
• Biodiesel blending facilities at all of ourracks.
• Build a wholesale / retail business.
• Expand our optionality to process WCS, light-shale oil, and natural gasoline at the CoffeyvilleRefinery.
• Improve Liquid Yield recovery at theWynnewood Refinery by 3.5%.
• Reduce SG&A costs via ERP utilization andheadcount reductions.
• Reduce lost opportunities and improve capturerates.

$-
$25
$50
$75
$100
$125
$150
$175
$200
$225
2013 2014 2015 2016 2017 2018E
USD
Mill
ion
sTurnaround Expense
$-
$25
$50
$75
$100
$125
$150
$175
$200
$225
2013 2014 2015 2016 2017 2018E
USD
Mill
ion
s
Environmental & Maintenance Growth
Capital Expenditures and Turnaround Expense
12
Note: As of September 30, 2018
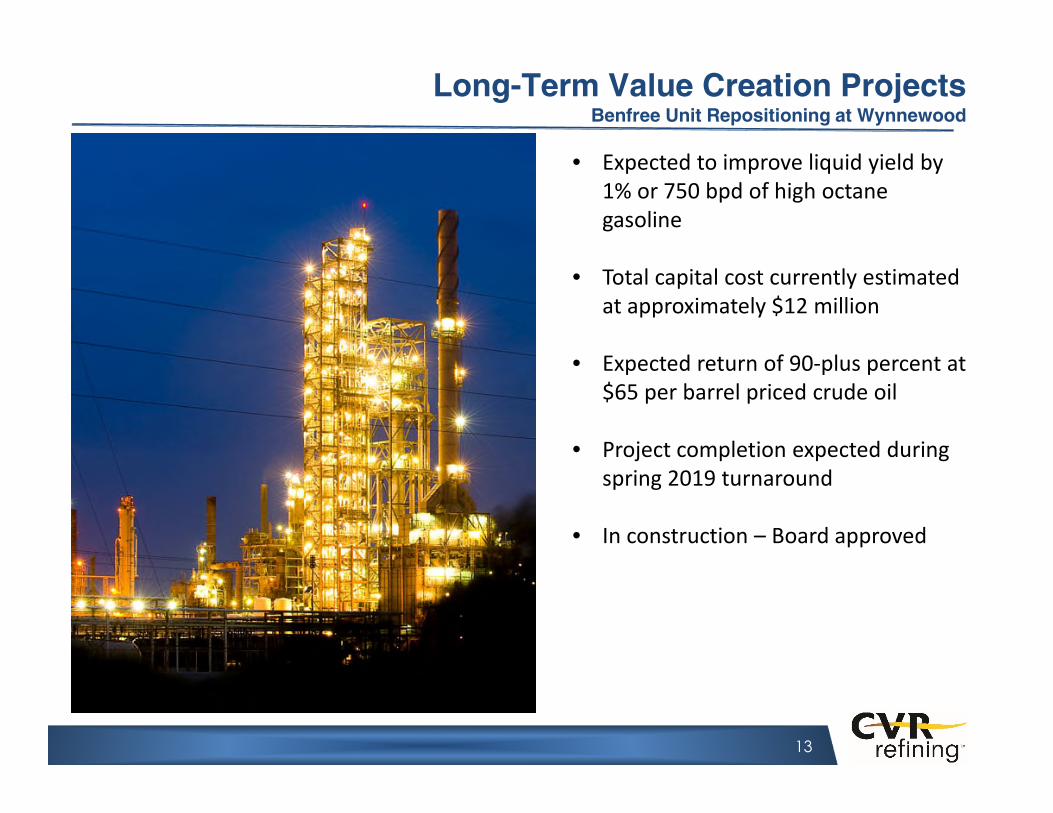
Long-Term Value Creation ProjectsBenfree Unit Repositioning at Wynnewood
13
• Expected to improve liquid yield by 1% or 750 bpd of high octane gasoline
• Total capital cost currently estimated at approximately $12 million
• Expected return of 90-plus percent at $65 per barrel priced crude oil
• Project completion expected during spring 2019 turnaround
• In construction – Board approved

Long-Term Value Creation ProjectsIsomerization Unit at Wynnewood
14
• Intended to: • Run more SCOOP / STACK
condensate crude
• Improve liquid volume yield
• Increase capability to produce premium gasoline
• Reduce benzene content of gasoline – generate more credits
• Total capital cost currently estimated at approximately $90 million
• Expected return greater than 35%
• Project completion expected 2021
• Schedule A design work underway, including detailed cost estimate
• Will seek board approval in 2Q 2019

Long-Term Value Creation ProjectsCrude Optionality at Coffeyville
15
• Phase 1 would involve changes required to allow running additional natural gasoline and or shale oil condensates processing
Additional naphtha hydrotreating Additional C5 / C6 isomerization Tier III gasoline flexibility
• Expected return greater than 30%
• Timing for project completion is expected to be in 2022
• Total capital cost currently estimated at approximately $190 million
• Phase 2 would involve improving liquid yield and increased Canadian crude processing with the addition of a new gas oil hydrotreater
• Phase 3 would involve expansion of the continuous catalytic reformer to process additional naptha to high octane blendstock


17
Solid Trends in Fertilizer Demand Growth
Source: International Fertilizer Industry Association; U.S. Bureau of the Census (International Data Base) and USDA.
0.18
0.20
0.22
0.24
0.26
Hecta
res p
er
Pers
on
Global nitrogen consumption increased by 20% between 2005 and 2015 driven by:
− Population growth
− Decrease in farmland per capita
− Biofuel consumption
− Continued evolution to more protein-based diets in developing countries
0.0
50.0
100.0
150.0
200.0
250.0
Millio
n T
on
nes
0.0
2.0
4.0
6.0
8.0
10.0
12.0
14.0
16.0
18.0
20.0
Millio
n T
on
nes
Global Nitrogen Consumption
U.S. Nitrogen ConsumptionGlobal Arable Land per Capita

• Estimated reduced corn stocks supports improving fundamentals for corn prices
• 2018 UAN summer fill prices improved $32 per ton over last year
• Major global nitrogen capacity build cycle largely complete in 2017/2018. Product demand expected to exceed new supply for the next several years
18
U.S Nitrogen Supply & Demand
-4,000
-2,000
0
2,000
4,000
6,000
8,000
10,000
12,000
14,000
16,000
Production Imports Exports
U.S. Nitrogen Supply
(000’s
of
nitro
gen m
etr
ic tons)
Corn Stocks to Use Compared to Net Back Fertilizer Pricing
Source: NPK Fertilizer Consultant, USDA, Blue Johnson and Associates, Inc.

19
Strong Demand for Corn in the U.S.
Corn has variety of uses and applications, including feed grains, ethanol for fuel and food, seed and industrial (FSI)
Feed grains
− ~96% of domestic feed grains are supplied by corn
− Consumes ~38% of annual corn crop(1)
Ethanol
− Consumes ~38% of annual corn crop(1)
Corn production driven more by yield than acres planted
Domestic Corn Planted Acres and Yield per Acre
0
20
40
60
80
100
120
140
160
180
200
0
20
40
60
80
100
120
Planted acres Yield per acre
Million planted acres Bushels per harvested acre
U.S. Domestic Corn Use
0
2
4
6
8
10
12
14
Feed / Residual Use Ethanol FSI
(Bushels in billions)
Source: USDA Economic Research Service and USDA WASDE.
(1) Based on most recent five year average.

20
Strategically Located Assets
Large geographic footprint serving the Southern Plains and Corn Belt region
Well positioned to minimize distribution costs and maximize net back
New rail loading rack at Coffeyville increases optionality of customer markets due to greater access to BNSF delivery points – unit train capable
Facility flexibility due to storage capabilities at the plants and offsite locations
Marketing agreement with LSB Industries Pryor, OK, facility’s UAN production

21
Key Operating Statistics
Coffeyville East Dubuque
On-Stream FactorsOn-Stream Factors On-Stream FactorsOn-Stream Factors
Consolidated Feedstocks Costs(1) Consolidated Sales Revenue(1)(2)
(1) For the last twelve months ended September 30, 2018.(2) Excludes freight.
Ammonia25%
UAN68%
Urea Products
7%
Natural Gas64%
Pet Coke24%
Hydrogen 12%

Capital Expenditures and Turnaround Expenses
22
Note: As of September 30, 2018
East Dubuque Merger on
April 1, 2016
East Dubuque Merger on
April 1, 2016

APPENDIX

Non-GAAP Financial Measures
24
EBITDA represents net income (loss) attributable to CVR Energy stockholders before consolidated (i) interest
expense and other financing costs, net of interest income; (ii) income tax expense (benefit); and (iii)
depreciation and amortization, less the portion of these adjustments attributable to noncontrolling interest.
Adjusted EBITDA represents EBITDA adjusted for consolidated (i) FIFO impact (favorable) unfavorable; (ii) major
turnaround expenses (that many of our competitors capitalize and thereby exclude from their measures of
EBITDA and adjusted EBITDA); (iii) (gain) loss on derivatives, net; and (iv) current period settlements on derivative
contracts. EBITDA and Adjusted EBITDA are not recognized terms under GAAP and should not be substituted for
net income (loss) or cash flow from operations. We believe that EBITDA and Adjusted EBITDA enable investors to
better understand and evaluate our ongoing operating results and allow for greater transparency in reviewing
our overall financial, operational and economic performance. EBITDA and Adjusted EBITDA presented by other
companies may not be comparable to our presentation, since each company may define these terms
differently. EBITDA and Adjusted EBITDA represent EBITDA and Adjusted EBITDA that is attributable to CVR Energy
stockholders.
Direct operating expenses, excluding major turnaround expenses, per total throughput barrel. For both refining
margin and refining margin adjusted for FIFO impact, we present these measures on a per total throughput
barrel basis. In order to calculate these non-GAAP operating metrics, we utilize the total dollar figures for refining
margin and refining margin adjusted for FIFO impact, as derived above and divide by the applicable number of
total throughput barrels for the period.

Non-GAAP Financial Measures
25
LTM Sept. 30,
($ in millions) 2014 2015 2016 2017 4Q 2017 1Q 2018 2Q 2018 3Q 2018 2018
Net income (loss) attributable to CVR Energy Stockholders 174$ 170$ 25$ 234$ 201$ 66$ 51$ 90$ 408$
Interest expense and other financing costs, net of interest income 39 47 83 109 27 26 27 26 106
Income tax expense 98 85 (20) (217) (235) 21 17 35 (162)
Depreciation and amortization 154 164 193 214 55 53 55 51 214
Adjustments attributable to noncontrolling interest (65) (75) (127) (151) (38) (36) (39) (31) (144)
EBITDA 400$ 391$ 154$ 190$ 10$ 130$ 111$ 171$ 422$
FIFO impact, (favorable) unfavorable 161 60 (52) (30) (30) (20) (22) (3) (75)
Share based compensation 12 13 - - - - - - -
Major scheduled turnaround expenses 7 109 38 83 43 - 6 1 50
Loss on extinguishment of debt - - 5 - - - - - -
Gain on derivatives, net (186) 29 19 70 65 (60) (10) (5) (10)
Current period settlements on derivative contracts 122 (26) 36 (17) (18) 14 17 10 23
Flood insurance recovery - (27) - - - - - - -
Expenses associated with the East Dubuque Merger - 2 3 - - - - - -
Insurance recovery - business interruption - - (2) (1) - - - - -
Adjustments attributable to noncontrolling interest (43) (52) (20) (37) (21) 22 1 (2) -
Adjusted EBITDA 474$ 499$ 182$ 258$ 49$ 86$ 103$ 172$ 410$
(In USD Millions, except per bbl data) LTM Sept.
4Q 2017 1Q 2018 2Q 2018 3Q 2018 30, 2018
Direct operating expenses 135$ 93$ 94$ 85$ 407$
Major turnaround expenses (43) 0 0 (1) (44)
Direct operating expenses excluding turnaround 92$ 93$ 94$ 84$ 363$
Throughput (bpd) 203,263 188,368 216,665 218,906
Total Throughput (mm bbls) 19 17 20 20 76
Direct operating expenses excluding turnaround expenses per total throughput barrel 4.80$
Petroleum Segment

Non-GAAP Financial Measures
26
Note: reconciliation above excludes non-controlling interest impacts as those are not estimable.
Reconciliation of Net Income attributable to CVR Energy to Projected Logistics EBITDA
USD Millions
Net Income attributable to CVR Energy 53$ - 59$
Income tax expense 11 - 13
Depreciation and amortization 6 - 8
Projected EBITDA 70$ - 80$

Organizational Structure
27
Petroleum Refining and Logistics Operating
Subsidiaries (4)
CVR Refining, LLC
CVR Refining, LP(CVRR)
Coffeyville Finance Inc.
CVR Refining Holdings, LLC
100% 100%
100%
CVR Partners, LP(UAN)
100%
Public
Public
65.6%
100%
65.9%
CVR Refining GP, LLC
IEP
15.5%
CVR GP, LLC
100%
CVR Energy, Inc. (CVI)
Coffeyville Resources, LLC
34.4%
IEP
70.8% 29.2%
100%
Coffeyville Resources Nitrogen Fertilizers,
LLC(2)
Holding Companies (1)
100%
(1) Includes Coffeyville Nitrogen Fertilizers, Inc., CL JV Holdings, LLC, Coffeyville Refining & Marketing Holdings, Inc., Coffeyville Refining & Marketing, Inc., Coffeyville Terminal, Inc., Coffeyville Crude Transportation, Inc., and Coffeyville Pipeline, Inc.
(2) Includes CVR Partners Fertilizer Business.(3) Includes East Dubuque Facility.(4) Includes Wynnewood Energy Company, LLC, Wynnewood Refining Company, LLC, Coffeyville Resources Refining & Marketing, LLC, Coffeyville Resources Crude
Transportation, LLC, Coffeyville Resources Terminal, LLC, and Coffeyville Resources Pipeline, LLC.
Public
3.9%
CVR Nitrogen, LP
East Dubuque Nitrogen Fertilizers, LLC(3)
14.7%