Investor Presentation -...
43
Investor Presentation November 2017
Transcript of Investor Presentation -...

Investor PresentationNovember 2017

Forward Looking Statements
Certain statements in this presentation are forward‐looking statements within the meaning of Section 27A of the Securities Act of 1933, as amended, and Section21E of the Securities Exchange Act of 1934, as amended. Statements other than statements of historical fact including words such as “look”, "will", “anticipate”,“believe”, “estimate”, “expect”, "forecast", “consider” and “plan” and statements in the future tense are forward looking statements. The statements inthis presentation that could be deemed forward‐looking statements include statements regarding our expectations for our financial results for the second fiscalquarter of 2018 and full fiscal year 2018 and statements regarding expectations related to our cash position, expenses, days sales outstanding in accountsreceivable, number of distributors and resellers, shipments, the roll‐out of our consumer retail channel, introduction of new consumer products, gross margin,research and development, sales, general and administrative expenses, tax rates, inventory turns, growth opportunities and rates, demand and long term globalenvironment for our products, our markets and market share for our products, new products, and financial performance estimates including revenues, GAAPdiluted EPS and non‐GAAP diluted EPS for the Company’s second fiscal quarter of 2018 and full fiscal year 2018, and any statements or assumptions underlyingany of the foregoing. Forward‐looking statements are subject to certain risks and uncertainties that could cause our actual future results to differ materially, orcause a material adverse impact on our results. Potential risks and uncertainties include, but are not limited to, fluctuations in our operating results; varyingdemand for our products due to the financial and operating condition of our distributors and their customers, and distributors' inventory management practices;political and economic conditions and volatility affecting the stability of business environments, economic growth, currency values, commodity prices and otherfactors that may influence the ultimate demand for our products in particular geographies or globally; impact of counterfeiting and our ability to contain suchimpact; our reliance on a limited number of distributors; inability of our contract manufacturers and suppliers to meet our demand; our dependence onQualcomm Atheros for chipsets without a short‐term alternative; as we move into new markets competition from certain of our current or potential competitorswho may be more established in such markets; our ability to keep pace with technological and market developments; success and timing of new productintroductions by us and the performance of our products generally; our ability to effectively manage the significant increase in our transactional sales volumes; wemay become subject to warranty claims, product liability and product recalls; that a substantial majority of our sales are into countries outside the United Statesand we are subject to numerous U.S. export control and economic sanctions laws; costs related to responding to government inquiries related to regulatorycompliance; our reliance on the Ubiquiti Community; our reliance on certain key members of our management team, including our founder and chief executiveofficer, Robert J. Pera; adverse tax‐related matters such as tax audits, changes in our effective tax rate or new tax legislative proposals; whether the finaldetermination of our income tax liability may be materially different from our income tax provisions; the impact of any intellectual property litigation and claimsfor indemnification; litigation related to U.S. Securities laws; and economic and political conditions in the United States and abroad. We discuss these risks ingreater detail under the heading “Risk Factors” and elsewhere in our Annual Report on Form 10‐K for the year ended June 30, 2017, and subsequent filings filedwith the U.S. Securities and Exchange Commission (the “SEC”), which are available at the SEC's website at www.sec.gov. Copies may also be obtained bycontacting the Ubiquiti Networks Investor Relations Department, by email at [email protected] or by visiting the Investor Relations section of the Ubiquiti Networkswebsite, http://ir.ubnt.com. Given these uncertainties, you should not place undue reliance on these forward‐looking statements. Also, forward‐lookingstatements represent our management's beliefs and assumptions only as of the date made. Except as required by law, Ubiquiti Networks undertakes noobligation to update information contained herein. You should review our SEC filings carefully and with the understanding that our actual future results may bematerially different from what we expect.
2Copyright © Ubiquiti Networks, Inc. 2017

A Different Kind of Networking Technology CompanyWith a Successful, Disruptive Business Model
1. Diluted EPS for the fiscal year ending June 30, 2013 of $0.89 through the fiscal year ending June 30, 2017 of $3.09 3
Underserved & Underpenetrated
Innovative, high performance,
easily deployable
Up to80%
lower cost than competitors
37%CAGR
Global MarketsTargeted Products Disruptive
PricingEPS Growth2013‐20171
Copyright © Ubiquiti Networks, Inc. 2017

T H E U B I Q U I T I S T O R Y
Disruptive Business Model. Delivering High Performance
4
A high performance company
Disruptive business model
Two growth segments
Long growth runway
Copyright © Ubiquiti Networks, Inc. 2017

A T A G L A N C E
Two Segments. Strong Global FootprintYear Ending June 30, 2017
5
Revenue Breakdown$865M
Key Metrics(Consolidated)
ByProductMix
ByGeography
>200
>100
62%
~60%
$485M2
Countries & territories
Distributors
Sales outside N. America
Employees in R&D
~$5B
Stock repurchases
Market cap
1. Enterprise segment includes Consumer Technology. 2. For the period July 1, 2014 through October 6, 2017.
Enterprise1 47% 53% ServiceProvider
11%
39% 12%
38%Asia Pacific
EMEA
North America
South America
Copyright © Ubiquiti Networks, Inc. 2017

Global Exposure to Rapidly Growing Markets
• 62% of Ubiquiti’s revenue from outside N. America.
• Serving fast growing and underserved & underpenetrated markets
6
Revenue Breakdown by Region ‐ Fiscal 2017
38%N. America
12%S. America
39%EMEA
11%Asia Pacific
Copyright © Ubiquiti Networks, Inc. 2017

A Company on the Move
7
2005 ‐ 2011 2011 ‐ 2016 2017+
• Built disruptive business model– targeted initial
market
• Expanded into adjacent markets– leveraged low
operating costmodel
• Long growth runway– multiple
opportunities
Copyright © Ubiquiti Networks, Inc. 2017

• Targeted and transformed wireless broadband in underserved markets
• Superior product at disruptive price
• Shipped 45+ million airMAX® units to ~60 countries (life‐to‐date)
Success in Initial Target Market Demonstrated Power of Our Business Model
8
Built $2B airMAX®business
Copyright © Ubiquiti Networks, Inc. 2017

Expanded into Adjacent Markets that Leveraged Core Expertise
9
Ubiquiti Platform Target Market Total Addressable
Market1
UniFi • Enterprise Wi‐Fi (AP, Switches, Routers) $30B
UniFi Video • Video Surveillance $ 5B
AmpliFi • Consumer Home Wi‐Fi $4B
EdgeMax • Carrier Routing and Switching $ 4B
airFiber • Wireless Backhaul $ 4B
Total $47B
1. Sources include Gartner Enterprise WLAN Network Revenue estimated global sales calendar 2016 and IDC estimates for Enterprise Wi‐Fi and Consumer Wi‐Fi (Worldwide Enterprise Networking Infrastructure 2017 Report)
Copyright © Ubiquiti Networks, Inc. 2017

Enterprise Technology
Broadband Utilization
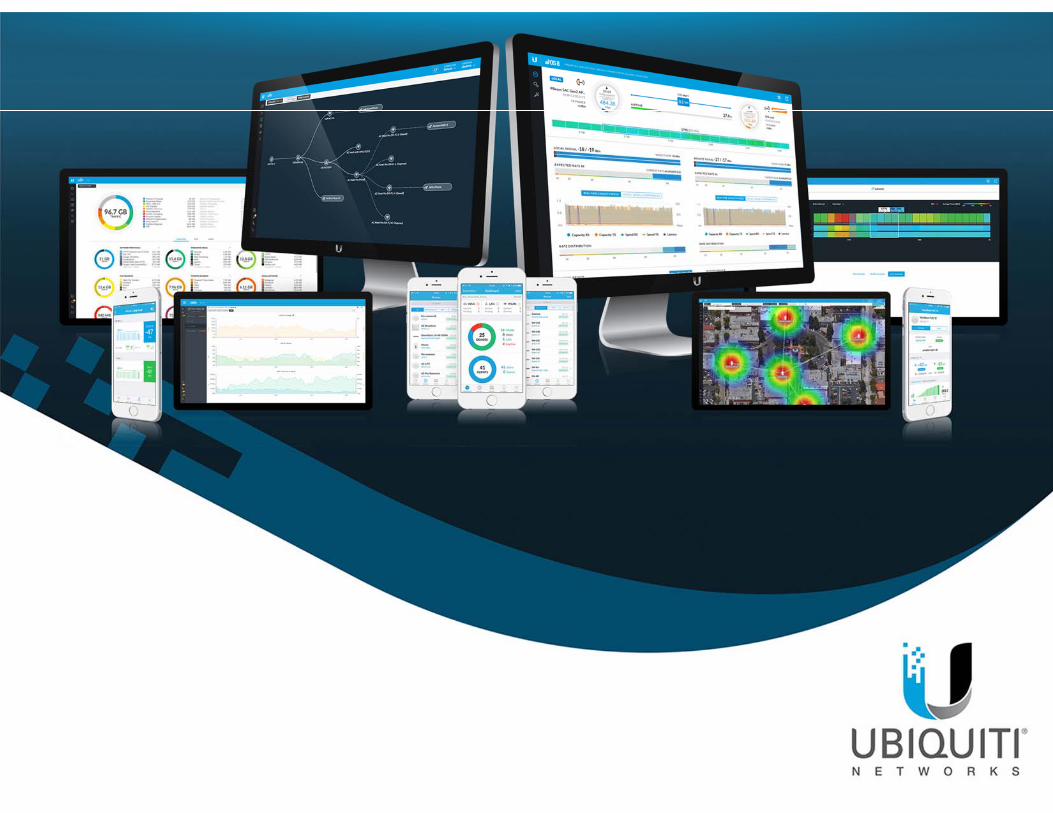
Ubiquiti Networks Provides an Integrated End‐to‐End Solution
10
Service Provider Technology
“Last Mile” Solutions
Consumer Technology
Wi‐Fi Mesh
Home Wi‐FiMesh Systems
WirelessBackhaul
EdgeRouting
Point‐to‐Multipoint
Copyright © Ubiquiti Networks, Inc. 2017
IP Video Surveillance
AdvancedSwitching
Routing andSecurity
ControllerWLAN
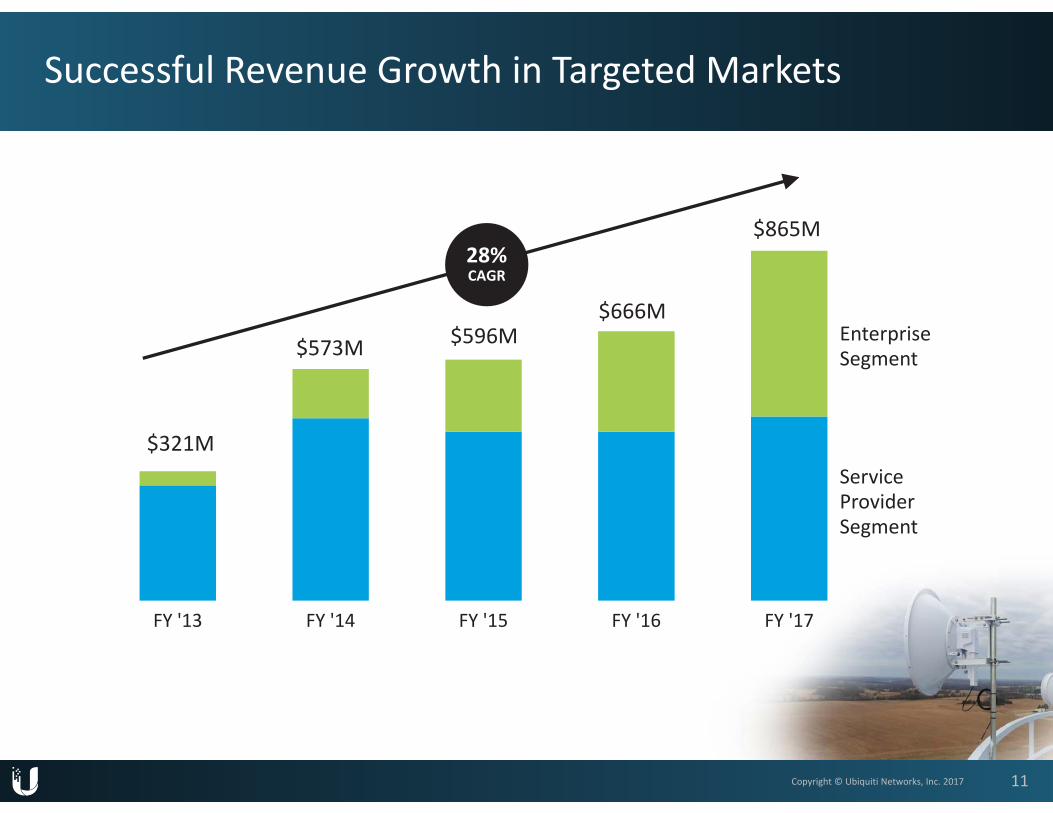
Successful Revenue Growth in Targeted Markets
11
FY '13 FY '14 FY '15 FY '16 FY '17
$865M
$321M
$573M $596M$666M
28%CAGR
EnterpriseSegment
ServiceProviderSegment
Copyright © Ubiquiti Networks, Inc. 2017

Results: An Unusual Combination –Disruptive Model + Highly Profitable
12
$321M
$865M
2013 2017Fiscal Period
Revenues($M)
EPS1($)
$0.89
$3.09
2013 2017Fiscal Period
$152M
$348M
2013 2017Fiscal Period
Net Cash($M)
2.7X 3.5X 2.3X
1. Diluted Copyright © Ubiquiti Networks, Inc. 2017

T H E U B I Q U I T I S T O R Y
Disruptive Business Model. Delivering High Performance
13
A high performance company
Disruptive business model
Two growth segments
Long growth runway
Copyright © Ubiquiti Networks, Inc. 2017

A Disruptive Business Model
14
1. Target underserved and underpenetratedmarkets
2. Deliver innovative, high performance products
3. Low cost operations and new product development
4. Disruptive pricing
5. Unmatchedfinancial profile
The UbiquitiCommunity
Copyright © Ubiquiti Networks, Inc. 2017
A T T H E C E N T E R
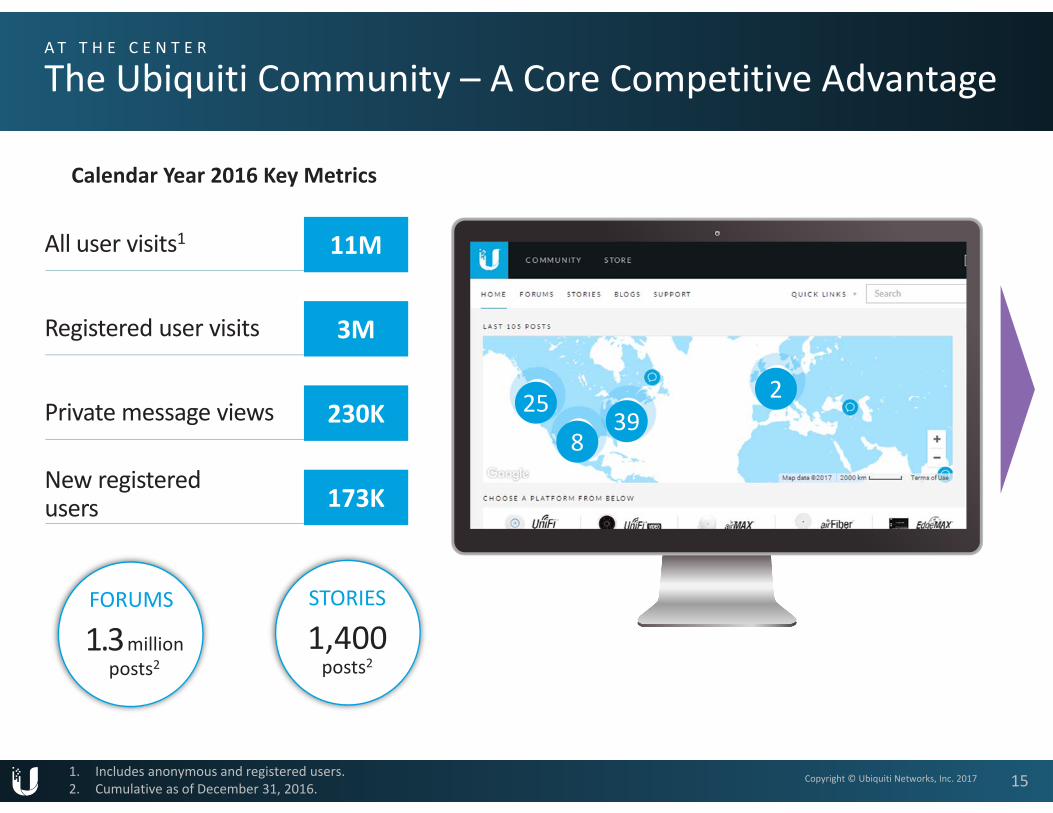
The Ubiquiti Community – A Core Competitive Advantage
15
3M
230K
11M
Registered user visits
Private message views
All user visits1
Calendar Year 2016 Key Metrics
FORUMS
1.3millionposts2
STORIES
1,400posts2
258
392
173KNew registered users
1. Includes anonymous and registered users.2. Cumulative as of December 31, 2016.
Copyright © Ubiquiti Networks, Inc. 2017

A T T H E C E N T E R
Advantages of Ubiquiti Community
16
Highly engaged and loyal evangelists
Drives market awareness, avoids the cost of a direct sales force
Real‐time feedback to R&D teams faster, lower cost product development
Scalable and self‐sustaining
Copyright © Ubiquiti Networks, Inc. 2017

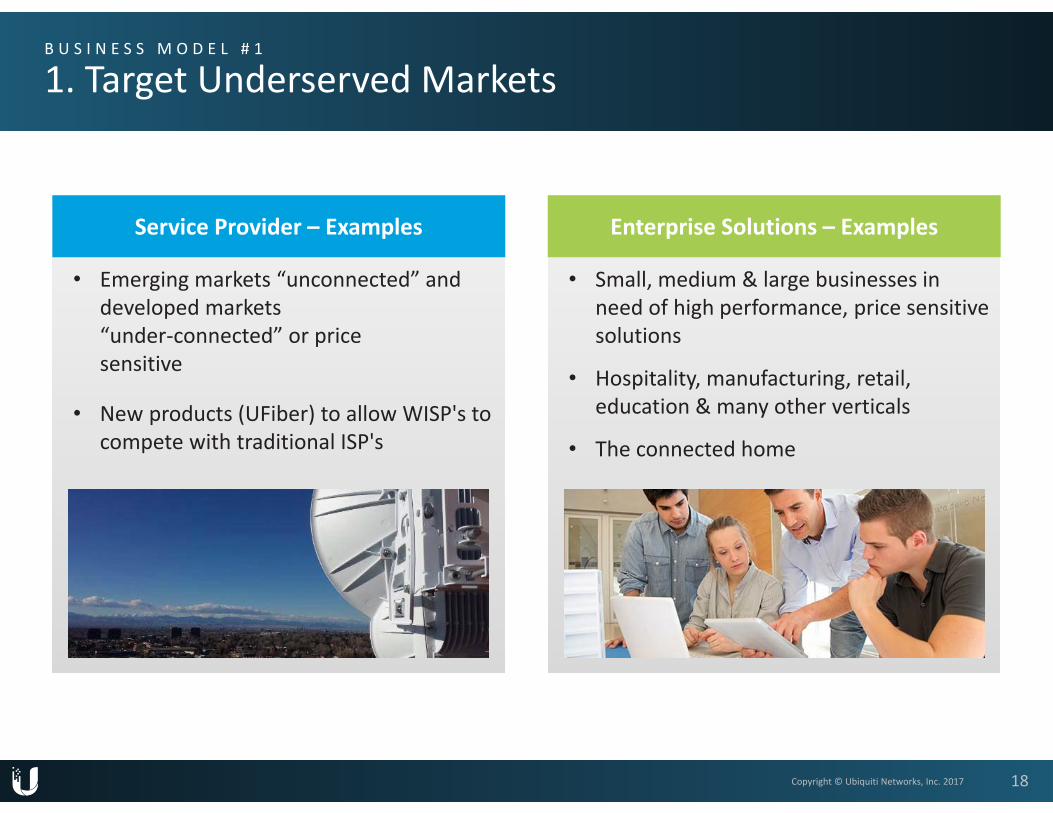
B U S I N E S S M O D E L # 1
1. Target Underserved Markets
17
Characteristicsof Targeted Markets Enterprise – UniFi AP,
Switches, Cameras…ConsumerAmpliFi
Market Examples
Underserved by traditional players
Need for high performance, easy to install and maintain products
Price sensitive
Good growth potential
Fixed WirelessairMAX
Copyright © Ubiquiti Networks, Inc. 2017
B U S I N E S S M O D E L # 1
1. Target Underserved Markets
18
Service Provider – Examples Enterprise Solutions – Examples
• Small, medium & large businesses in need of high performance, price sensitive solutions
• Hospitality, manufacturing, retail, education & many other verticals
• The connected home
Copyright © Ubiquiti Networks, Inc. 2017
• Emerging markets “unconnected” and developed markets “under‐connected” or pricesensitive
• New products (UFiber) to allow WISP's to compete with traditional ISP's

B U S I N E S S M O D E L # 2
2. Develop Innovative, High Performance Products
• High performance− include proprietary components, protocols and processes− latest technologies
• Intellectual property1− 53 patents in U.S., 34 in foreign countries, over 100 pending
• “Last entrant” advantage− designed from blank sheet of paper− focus on most valuable features, avoid fringe features
19Copyright © Ubiquiti Networks, Inc. 20171. Source: The Company’s Form 10‐K filed for the period ending June 30, 2017

• Hire elite engineers, lower cost countries (Eastern Europe & China)
• Distributors, resellers and connection with Ubiquiti Community drive sales
B U S I N E S S M O D E L # 3
3. Low Cost Operations
20
• Contract manufacturing in China
• Low cost bill of material
OperatingExpenses
12%of sales
vs. ~21‐84%for sector1
1. Source Bloomberg data for LTM period at November 7, 2017. Companies in the sector include: Arista, Arris, A10, Avigilon, Brocade, CalAmp, Cisco, Fortinet, HPE, Infinera, Juniper, Netgear, Palo Alto Networks and MSI
Avoids Cost of a Direct Sales Force
Highly Productive R&D
Low Cost Manufacturing
Copyright © Ubiquiti Networks, Inc. 2017

B U S I N E S S M O D E L # 4
4. Deliver Products at Industry Leading / Disruptive Prices
21Note: Graph is for illustrative purposes only.
Performance
Price$300 $600 $900 $1,200 $1,500
UAP AC HD
Vendor R
Vendor A
Vendor C
$0 $1,800Low
High
In February 2017, the Company launched UniFi AC HD, the highest performance access point in the industry at the best value
Copyright © Ubiquiti Networks, Inc. 2017

B U S I N E S S M O D E L # 5
5. Financial Profile of a Disruptive Player
22
Mid‐range Gross Margin (Disruptive Pricing)
Leanest OpEx to Sales
2nd Highest Sales per Employee Highest 3‐YR Operating Income Margin
Sector Avg
24%‐77%
45%
Sector Avg
21%‐84%
12%
Sector Avg
$0.3‐$1.4M
$1.3M
Sector Avg
‐15%‐24%
32%
Note: The LTM and 3 year data was data sourced from Bloomberg on November 7, 2017. Sector companies include: Arista, Arris, A10, Avigilon, Brocade, CalAmp, Cisco, Fortinet, HPE, Infinera, Juniper, Netgear , Motorola Solutions & Palo Alto Networks
52% 44%
8%$0.6
Copyright © Ubiquiti Networks, Inc. 2017
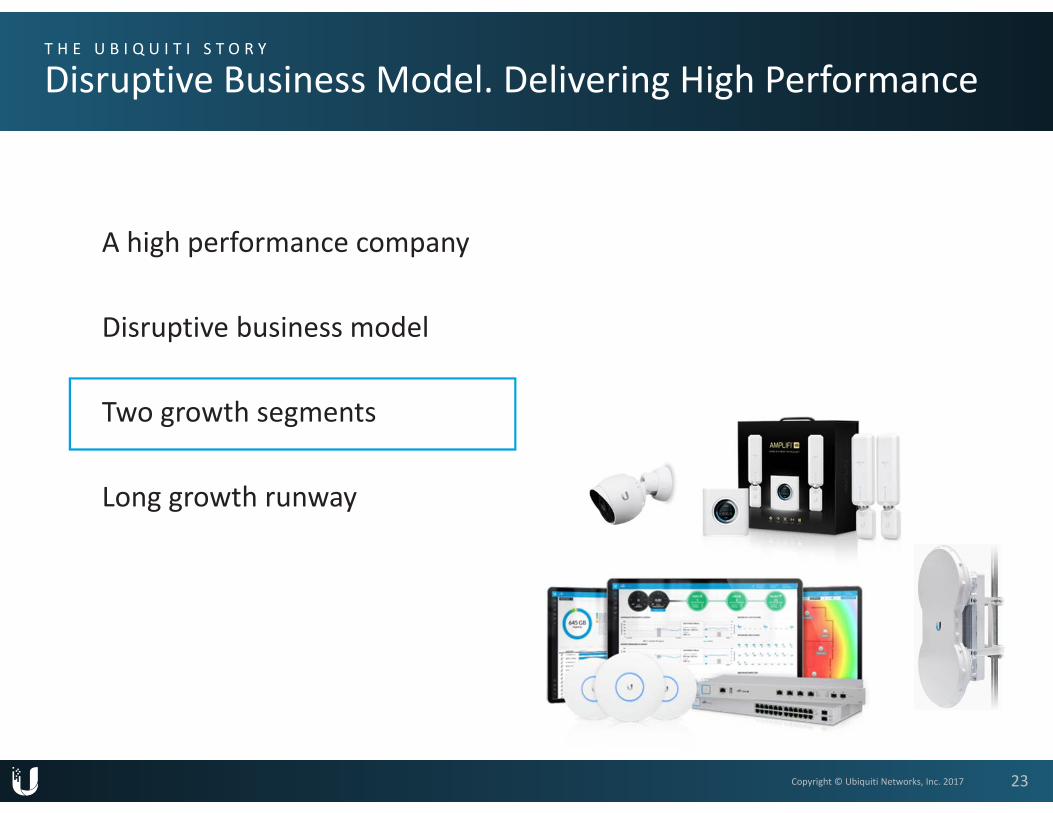
T H E U B I Q U I T I S T O R Y
Disruptive Business Model. Delivering High Performance
23
A high performance company
Disruptive business model
Two growth segments
Long growth runway
Copyright © Ubiquiti Networks, Inc. 2017

Two Growth Segments
24
Long Term Sustainable Growth
Disruptive Business Model
Service ProviderSolutions
• $455M 2017 revenues• 53% of total
EnterpriseSolutions
• $410M 2017 revenues • 47% of total
Copyright © Ubiquiti Networks, Inc. 2017

S E R V I C E P R O V I D E R
Service Provider Solutions – Consistent and Steady Growth
25
Profile Revenues
$418M $418M
$455M
2015 2016 2017Fiscal Year
4%CAGR
Q1F18 revenues of $120 million consistent with Q1F17
Key products1:
1. airMAX AC GEN2 was launched in March 2017; UFiber launch occurred in July 2017; airFiber LTU is still in development Copyright © Ubiquiti Networks, Inc. 2017

S E R V I C E P R O V I D E R
Positioned in Large, Growing Market1Note: Market size and growth here does not include GPON (new in F2018)
261. Source: IDC custom Fixed Wireless Access (FWA): Global and Regional Market Opportunity Analysis dated October 2013, and Management estimates. Total market includes FWA recurring service revenues
Market Size 2016 Market Growth 2016‐2020
$0.4B
TotalAddressable Market
$1.4B
Total Market (incl. WISP FWA subscription revenue)
$10B
5‐10%annually
Copyright © Ubiquiti Networks, Inc. 2017

S E R V I C E P R O V I D E R S O L U T I O N S
Typical airMAX® Network Setup
27
Internet CafeCorporate Buildings
Small Business
Internet Backbone ISP Network
airFiber® X Antennawith airFiber X Radio
airFiber® X Antennawith airFiber X Radio
airPrism Antenna with Rocket5ac Prism Radios
Point‐to‐Point (PtP)Backhaul Link
PtMP (Point‐to‐MultiPoint) airMAX AC Links
Copyright © Ubiquiti Networks, Inc. 2017

Two Growth Segments
28
Long Term Sustainable Growth
Disruptive Business Model
Service ProviderSolutions
• $455M 2017 revenues• 53% of total
EnterpriseSolutions
• $410M 2017 revenues• 47% of total
Copyright © Ubiquiti Networks, Inc. 2017
E N T E R P R I S E S O L U T I O N S
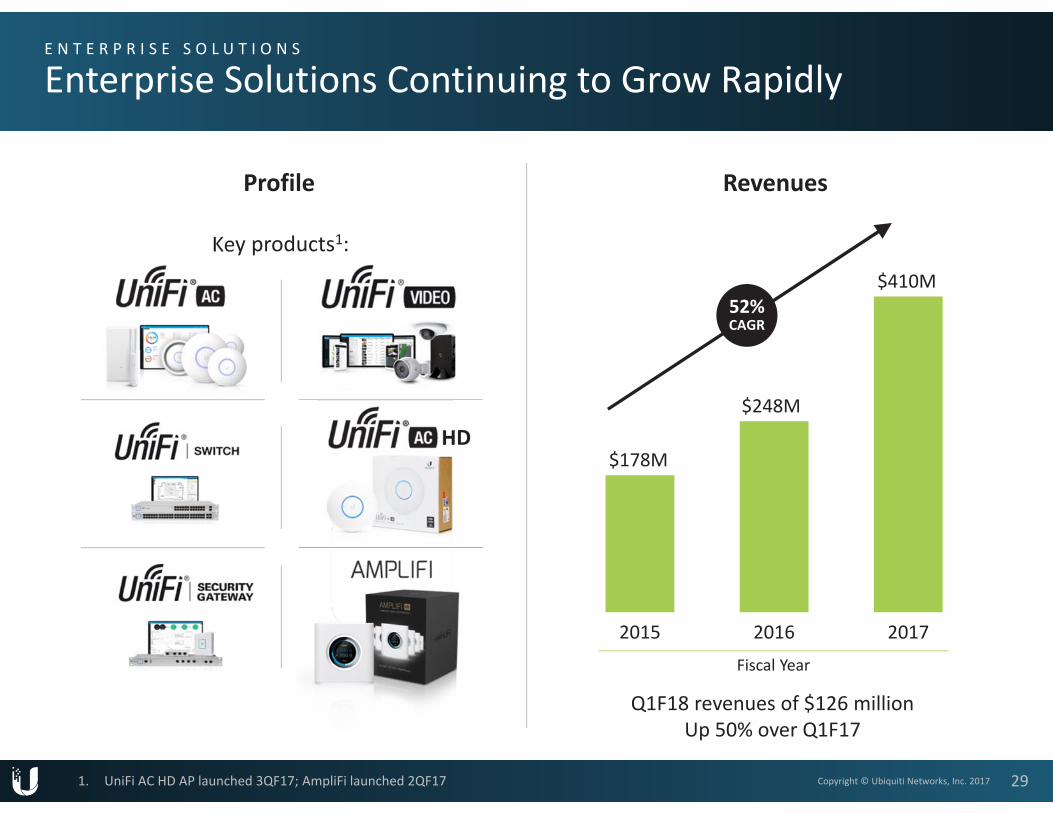
Enterprise Solutions Continuing to Grow Rapidly
29
Key products1:
Profile Revenues
$178M
$248M
$410M
2015 2016 2017Fiscal Year
52%CAGR
Q1F18 revenues of $126 millionUp 50% over Q1F17
HD
1. UniFi AC HD AP launched 3QF17; AmpliFi launched 2QF17 Copyright © Ubiquiti Networks, Inc. 2017
E N T E R P R I S E S O L U T I O N S
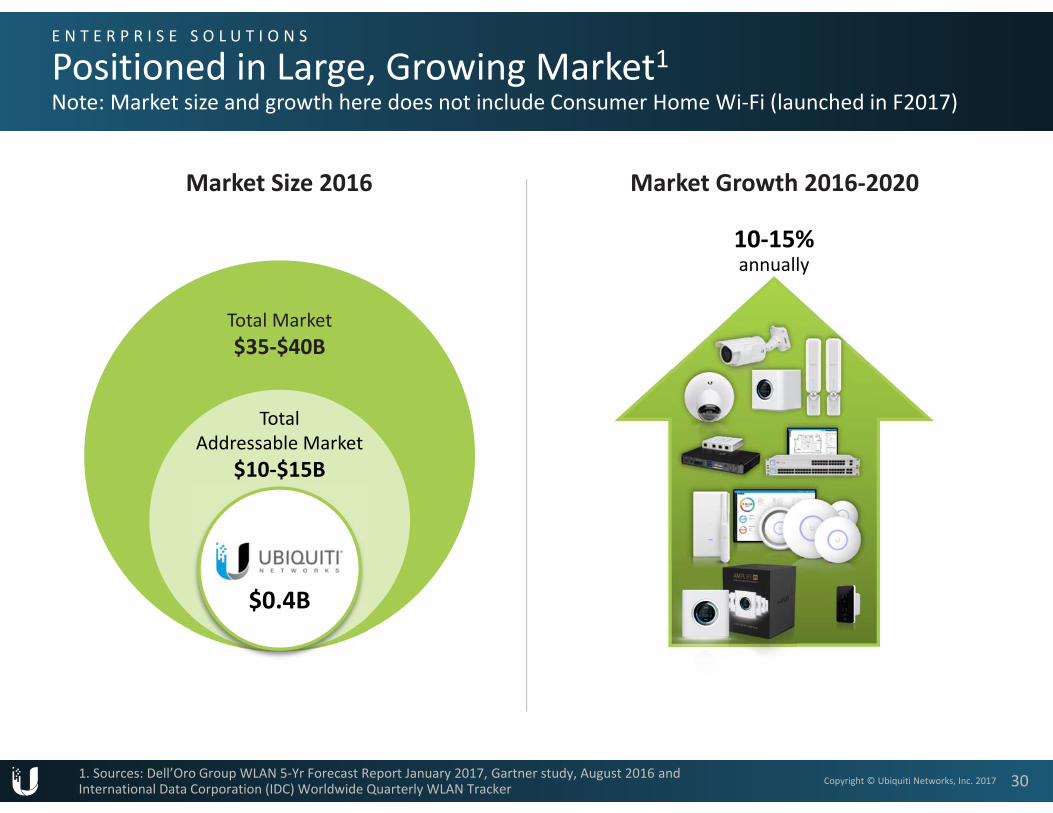
Positioned in Large, Growing Market1Note: Market size and growth here does not include Consumer Home Wi‐Fi (launched in F2017)
30
Market Size 2016 Market Growth 2016‐2020
1. Sources: Dell’Oro Group WLAN 5‐Yr Forecast Report January 2017, Gartner study, August 2016 and International Data Corporation (IDC) Worldwide Quarterly WLAN Tracker
10‐15%annually
$0.4B
TotalAddressable Market
$10‐$15B
Total Market$35‐$40B
Copyright © Ubiquiti Networks, Inc. 2017

E N T E R P R I S E S O L U T I O N S
Gaining Market Share in Wireless LAN Market1
31
$4.3B
$4.9B
2014 2016
Global Market Ubiquiti Global Access Point Sales(Per Dell’Oro)
$120M
$208M
2014 2016
12%
16%
2014 2016
Global Unit Market ShareUniFi Access Points
(Per Dell’Oro)
+13% +73% +34%
1. Data for Enterprise Wireless LAN Data Network segment source Dell’Oro February 2017 (Access Points only), and Dell’Oro 2Q’17 vendor tables dated September 2017
Copyright © Ubiquiti Networks, Inc. 2017
2017 Market Share @ >17%

E N T E R P R I S E S O L U T I O N S
Typical UniFi® Network Setup Clients Want Convergence and Flexibility1
32
Total network control on ONE screen
Controller
Internet Cafe
Dormor Residence
CorporateBuildings
Hotel
University / IndustrialCampus
1. Controller Advantage: 2016 wired and wireless access LAN infrastructure customer reference survey by Gartner found that over 70% of clients prefer a single vendor to deploy their access layer solution Copyright © Ubiquiti Networks, Inc. 2017

T H E U B I Q U I T I S T O R Y
Disruptive Business Model. Delivering High Performance
33
A high performance company
Disruptive business model
Two growth segments
Long growth runway
Copyright © Ubiquiti Networks, Inc. 2017

Continuing to Execute Consistent and Proven Strategy
34
Continue to deliver high performance products — at disruptive prices
Leverage technologies / business model into adjacent markets
Maintain / extend technology leadership
Continue to grow powerful user community
Continue to cross‐sell existing customers
1.
2.
3.
4.
5.
Copyright © Ubiquiti Networks, Inc. 2017

35
1 Excel in core businesses 2 Build leadership inadjacent markets
Fixed Wireless Broadband Enterprise
WLAN
Present / Large /Growing
Future / Growth
High Performance
airMAXASIC Chip
ConsumerAmpliFi
VideoSurveillance
ConnectedHome
UniFi Family Products
A C L O S E R L O O K A T S T R A T E G Y # 2
Continue to Innovate, Grow in Adjacent Markets
Copyright © Ubiquiti Networks, Inc. 2017

O U T L O O K
Growth Drivers Next 2‐3 Years $1B‐$1.15B in Revenue and $3.70‐$4.30 Diluted EPS Fiscal 2018
36
Service Provider
• airMAX AC GEN2 upgrade cycle
• New UFiber GPON offering to enable WISP’s to compete with traditional ISP’s in developing markets
• Other new high ASP sophisticated products containing custom ASIC chips –game changing airFiber LTU – Launch TBD
Enterprise Solutions
• AC technology upgrade cycle – enterprise and consumer
• Strong Y‐o‐Y growth in UniFi Family
• Continued share gains, attracting larger businesses globally
• New launches at higher ASP’s
• Consumer play including online and retail distribution
Company Sales CAGR Goal15%‐40%
Sales CAGR Goal5%‐30%
Sales CAGR Goal30%‐50%
Copyright © Ubiquiti Networks, Inc. 2017

Longer Term will Continue to Deliver Industry‐Leading Financial Profile
37
As % of Revenues LTM Q1F18Long TermModel
Revenues 100% 100%
Gross margin 45% 45% ‐ 50%
R&D 8% 6% ‐ 8%
SG&A 4% 3% ‐ 5%
Operating margin 33% 30% ‐ 38%
Net income margin 30% 25% ‐ 35%
Copyright © Ubiquiti Networks, Inc. 20171. Actual results may vary from Long Term Model based on changes in underlying assumptions.

Current Valuation – Set to Improve as Margin Sustainability and Growth Profile Understood
381. Prices and next 12 month analyst estimated EPS at November 7, 2017 sourced from Bloomberg. Group average is 26x.
18x
30xHigh Growth Sector
Average
High Growth Sector Companies
• Arista
• Avigilon
Forward (Next 12 Months) P/E Ratio1
• Fortinet
• NetGear
• Palo Alto Networks
Copyright © Ubiquiti Networks, Inc. 2017
S U M M A R Y
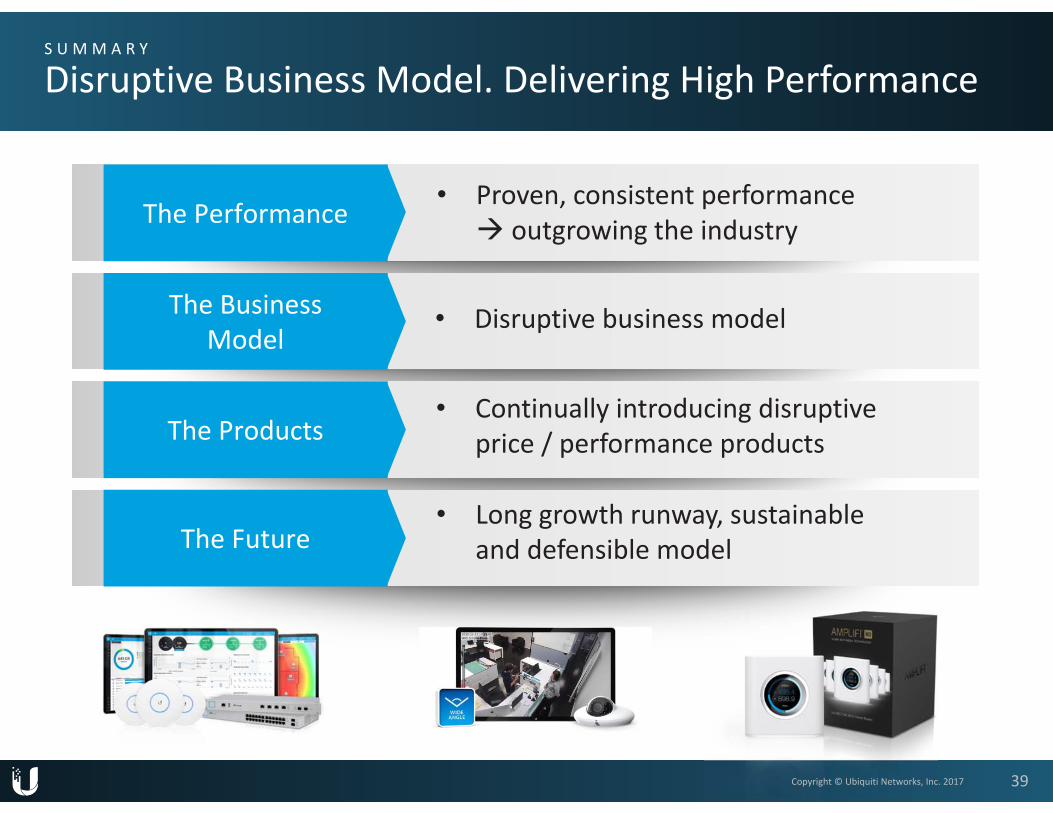
Disruptive Business Model. Delivering High Performance
39
The Performance
The BusinessModel
The Products
The Future
• Proven, consistent performance outgrowing the industry
• Disruptive business model
• Continually introducing disruptive price / performance products
• Long growth runway, sustainable and defensible model
Copyright © Ubiquiti Networks, Inc. 2017
INVESTOR RELATIONS CONTACT: Laura KiernanSVP Investor RelationsUbiquiti Networks, [email protected]: 1‐914‐598‐7733
About Ubiquiti Networks
Ubiquiti Networks, Inc. (NASDAQ: UBNT) currently focuses on 3 main technologies: high‐capacity distributed Internet access, unified information technology, and next‐genconsumer electronics for home and personal use. The majority of the company’s resourcesconsist of entrepreneurial and de‐centralized R&D teams. Ubiquiti does not employ a directsales force, but instead drives brand awareness largely through the company’s usercommunity where customers can interface directly with R&D, marketing, and support. Withover 70 million devices shipped in over 200 countries and territories in the world, Ubiquitiaims to connect everyone to everything, everywhere. Ubiquiti was founded by formerApple engineer Robert Pera in 2005. More insight about the company management can befound at www.rjpblog.com.
Ubiquiti, Ubiquiti Networks, the U logo, UBNT, airMAX, airFiber, mFi, EdgeMAX, UniFi,AmpliFi and UFiber are registered trademarks or trademarks of Ubiquiti Networks, Inc. inthe United States and other countries.
Copyright © Ubiquiti Networks, Inc. 2017 40

Appendix

UBNT Key Metrics Versus Sector1
TickerLTM
Sales/Employee
(millions)LTM Gross Margin %
Operating Expense to Sales Ratio
(%)LTM Op. Margin %
3 Year Avg. Operating Income
Margin (%)
LTM Net Income Margin %
Next 12 Months PE
Ratio
Next 12 Months
PE/Growth Ratio
UBNT $ 1.3 45% 12% 33% 32% 30% 18 0.8 CSCO $ 0.7 63 38 25 24 22 14 2.1ANET $ 0.8 64 42 27 20 18 37 1.5JNPR $ 0.5 62 44 18 9 12 12 1.6 MSI $ 0.4 47 30 19 6 12 17 3.7 BRCD $ 0.4 63 52 3 17 11 14 N/A NTGR $ 1.4 29 22 7 6 6 18 N/A HPE $ 0.3 31 21 4 5 5 12 N/A FTNT $ 0.3 74 70 8 4 3 35 1.9 AVO $ 0.3 51 46 7 10 3 17 0.4 ARRS $ 1.0 24 23 3 4 2 10 N/A CAMP $ 0.4 42 41 0 7 1 17 1.0 INFN $ 0.4 39 48 (19) 3 (2) N/A N/A ATEN $ 0.3 77 84 (6) (15) (9) 105 3.8 PANW $ 0.4 73 83 (10) (12) (11) 45 1.2 Average $ 0.6 52% 44% 8% 8% 7% 26 1.8
421. The LTM, 3 yr and next 12 month data was sourced from Bloomberg on November 7, 2017. Sector companies include: Arista, Arris, A10, Avigilon, Brocade, CalAmp, Cisco, Fortinet, HPE, Infinera, Juniper, Netgear , Motorola Solutions & Palo Alto Networks
Copyright © Ubiquiti Networks, Inc. 2017