Investor Presentation - ir.rblbank.com · ALL FIGURES IN THIS DOCUMENT ARE IN INR CRORE UNLESS...
44
Investor Presentation 4 th Quarter/FY 18 April 27, 2018
Transcript of Investor Presentation - ir.rblbank.com · ALL FIGURES IN THIS DOCUMENT ARE IN INR CRORE UNLESS...
Investor Presentation 4th Quarter/FY 18
April 27, 2018

By attending the meeting / telephonic call where this presentation is made, or by reading the presentation materials, you agree to be bound by the following limitations:
The information in this presentation has been prepared by RBL Bank Limited (the “Company”) for use in presentations by the Company at analyst and investor meetings
and does not constitute a recommendation regarding the securities of the Company. No representation or warranty, express or implied, is made as to, and no reliance
should be placed on, the fairness, accuracy, completeness or correctness of the information, or opinions contained herein. Neither the Company nor any of its advisors or
representatives shall have any responsibility or liability whatsoever (for negligence or otherwise) for any loss howsoever arising from any use of this presentation or its
contents or otherwise arising in connection with this presentation. The information set out herein may be subject to updating, completion, revision, verification and
amendment and such information may change materially. Neither the Company nor any of its advisors or representatives is under any obligation to update or keep current
the information contained herein. The information communicated in this presentation contains certain statements that are or may be forward looking. These statements
typically contain words such as "will", "expects" and "anticipates" and words of similar import. By their nature forward looking statements involve risk and uncertainty
because they relate to events and depend on circumstances that will occur in the future. Any investment in securities issued by the Company will also involve certain risks.
There may be additional material risks that are currently not considered to be material or of which the Company and its advisors or representatives are unaware. Against
the background of these uncertainties, readers should not unduly rely on these forward looking statements. The Company, its advisors and representatives assume no
responsibility to update forward-looking statements or to adapt them to future events or developments.
This presentation has been prepared for informational purposes only. This presentation does not constitute a prospectus under the (Indian) Companies Act, 1956 and will
not be registered with any registrar of companies. Furthermore, this presentation is not and should not be construed as an offer or a solicitation of an offer to buy securities
for sale in the India. This presentation and the information contained herein does not constitute or form part of any offer for sale or subscription of or solicitation or invitation
of any offer to buy or subscribe for any securities of the Company, nor should it or any part of it form the basis of, or be relied on in connection with, any contract or
commitment whatsoever. The securities of the Company have not been and will not be registered under the U.S. Securities Act of 1933, as amended (the "Securities Act"),
and may not be offered, sold or delivered within the United States or to U.S. persons absent from registration under or an applicable exemption from the registration
requirements of the United States securities laws. This presentation and the information contained herein is being furnished to you solely for your information and may not
be reproduced or redistributed to any other person, in whole or in part. In particular, neither the information contained in this presentation nor any copy hereof may be,
directly or indirectly, taken or transmitted into or distributed in the U.S., Canada, Australia, Japan or any other jurisdiction which prohibits the same except in compliance
with applicable securities laws. Any failure to comply with this restriction may constitute a violation of the United States or other national securities laws. No money,
securities or other consideration is being solicited, and, if sent in response to this presentation or the information contained herein, will not be accepted.
By reviewing this presentation, you are deemed to have represented and agreed that you and any person you represent are either (a) a qualified institutional buyer (within
the meaning of Regulation 144A under the Securities Act) or (b) not a U.S. person (as defined in Regulation S under the Securities Act) and are outside of the United States
and not acting for the account or benefit of a U.S. person.
Disclaimer
ALL FIGURES IN THIS DOCUMENT ARE IN INR CRORE UNLESS MENTIONED OTHERWISE ; 1 CRORE = 10 MILLION
2

Glossary and Key Notes AEPS Aadhaar Enabled Payment System IFI Institutional Financial Inclusion
Agri Agribusiness Banking INR Indian Rupee
API Application Programming Interface IPO Initial Public Offering
ARC Asset Reconstruction Company LAP Loan Against Property
ATM Automated Teller Machine MF Mutual Funds
BC Business Correspondent Mn Million
BIL Business Installment MSME Micro, Small and Medium Enterprises
Bps Basis Points NABARD National Bank for Agriculture and Rural Development
BVPS Book Value Per Share NFB Non Fund Based
C&IB Corporate & Institutional Banking NIM Net Interest Margin
CAGR Compounded Annual Growth Rate NNPA Net Non Preforming Assets
CASA Current Account and Savings Account NPA Non Performing Assets
CB Commercial Banking PCR Provision Coverage Ratio
CBDT Central Board for Direct Taxes PIL Personal Installment Loan
CC Credit Card Q1 3 month period ended June 30( April 1 - June 30)
CEO Chief Executive Officer Q2 3 month period ended September 30( July 1 - September 30)
CET1 Core Equity Tier 1 Q3 3 month period ended December 31( October 1 - December 31)
Cr Crore Q4 3 month period ended March 31(January 1 - March 31)
CRAR Capital to Risk Weighted Assets Ratio QoQ Quarter on Quarter
CSP Customer Service Point RBI Reserve Bank of India
CSR Corporate Social Responsibility RoA Return on Assets
DB & FI Development Banking & Financial Inclusion RoE Return on Equity
DBT Direct Benefit Transfer RWA Risk Weighted Assets
FICC Fixed Income, Currency and Commodity SDR Strategic Debt Restructuring
FPI Foreign Portfolio Investor SLR Statutory Liquidity Ratio
FY 12 month period ended March 31 UPI Unified Payments Interface
GNPA Gross Non Performing Assets US United States
G-Sec Government Securities VCF Venture Capital Funds
GST Goods and Services Tax YoY Year on Year
HUF Hindu Undivided Family
3

Table of Contents
Topic Page Number
Key Performance Highlights 5
RBL Vision 2020 12
Financial Performance 16
Distribution Network 30
Shareholding Pattern and Ratings 32
Awards and New Initiatives 34
Annexures 37
4

Key Performance Highlights
5

Q4 FY18 / FY18 Financial Highlights
6
FY 18 has tracked well to RBL Vision 2020 goals
NII growth of 45% YoY in FY18; Other Income growth of 41% YoY in FY18
Total Revenue growth in FY 18 of 38% YoY ; Net Profit growth in FY18 of 42% YoY
Advances growth of 37% YoY, Deposit growth of 27% YoY and CASA growth of 40% YoY
RoA at 1.25% for Q4 FY18 ; RoA for full year FY18 up 13 bps at 1.21%
GNPA at 1.40% ( down from 1.56% in Q3 FY18), NNPA at 0.78% ( down from 0.97% in Q3
FY18).
PCR at 57.57% ( up over 5% from previous quarter)
Total customer base of 4.5 million; addition of 0.5 million in Q4 FY18
NIM improving consistently – 3.98% in Q4 FY18 and 3.80% for FY18
Overall stressed advances at 1.48% down from 1.74% in Q3 FY18

Q4 FY 18 Highlights
Rs. 500 cr 42% 7% Net interest Income
Rs. 178 cr 37% 8% Net Profit
Rs. 383 cr 36% 15% Operating Profit
Rs. 812 cr 38% 12% Net Total Income
Rs. 270 cr 32% 18% Core Fee Income
QoQ Growth YoY Growth
7

Full Year FY 18 Highlights
Rs. 1,766 cr 45% Net interest Income
YoY Growth
Rs. 635 cr 42% Net Profit
Rs. 1,331 cr 45% Operating Profit
Rs. 2,834 cr 43% Net Total Income
Rs. 887 cr 41% Core Fee Income
8

Full Year FY 18 Highlights Contd….
Rs. 40,268 cr 37% 9% Advances
Rs. 43,902 cr 27% 14% Deposits
Rs. 16,516 cr 42% 13% Non-Wholesale
Advances
Rs. 23,752 cr 33% 6% Wholesale
Advances
Rs. 10,678 cr 40% 15% CASA
QoQ Growth YoY Growth
9

Key Indicators
FY 11 2,042
Deposits
24,349
Rs. 50
BVPS
Rs. 91 FY 16
Advances
1,905
21,229
12
Net Profit
292
Pre-IPO
Post Listing Performance
3.5% 1.19% Q1 18 31,108 141
3.7% 1.19% Q2 18 33,576 151
3.4% 1.17% Q3 17 26,773 129
3.5% 1.19% Q4 17 29,449 130
3.9% 1.22% Q3 18 36,890 165
4.0% 1.25% Q4 18 40,268 178
0.5%
RoA
1.0%
YoY Advances RoA
40%
35%
46%
39%
38%
37%
Net Profit NIM
(84% CAGR FY 11-16)
BVPS for FY 18 is Rs. 156
(88% CAGR FY 11-16)
10
(64% CAGR FY 11-16)

Key Indicators – Business Breakup
11
40.3%
18.7%
22.1%
14.1%
4.8%
CIB CB Retail Assets DB&FI Agri
Advances by Segment (%)
75.7%
12.2%
12.2%
Term Deposits Saving Deposits
Current Deposits
Deposit Breakup (%)

RBL Vision 2020
12

Performance Tracking to Vision 2020 Goals
Advances
Actual FY 18 RBL Vision 2020
(Post IPO/Sept 2016)
Other Income %
Operational Efficiency
Return Ratios
30-35% CAGR
~ 1/3rd of Net Total Income
Cost/Income ratio of
51% - 52% by 2020
~ 1.50% RoA by 2020
37%
37.7%
FY 16: 58.6%; FY 17: 53.5%
FY 18: 53.0%
FY 16 : 0.98%; FY 17: 1.08%
FY 18: 1.21%
CASA Ratio 0.75 - 1% increase
every year
FY 16: 18.6%; FY 17: 22.0%
FY 18: 24.3%
13

Key Initiatives of Vision 2020
Technology
Leveraging technology to acquire, engage and service clients
API banking, Abacus (Digital savings account); Fintech Partnerships (Moneytap,
Zeta) ; Credit card partnerships (Bajaj Finserv, BookMyShow, HyperCity)
Enhancing distribution through a combination of owned branches, BCs, Customer
Service Points ('CSPs')
265 own branches, over 800 BC branches (including 197 Banking Outlets) and 1,94,000
CSPs serve over 4.5 Mn customers pan-India
Enhancing cross-sell across all businesses
Strong analytics teams in place to analyze data to enhance cross sell and customer
targeting
Increase presence in 'Mass Banking' - internal efforts, partnerships and acquisitions
Extending network to individual loans in rural areas and offering deposits, insurance, DBT
and remittance services
Pilot partnership underway in affordable housing
Creation of Transaction and Payment platforms that leverage changes in ecosystem
driven by Aadhaar, UPI, IndiaStack, GST etc.
AEPS and UPI based mobile apps allow customers to transact through low cost channels
Better availability of data for underwriting in case of retail and MSME businesses
Distribution
Platforms
Cross-sell
Mass Banking
14

Our Fundamentals Have Resulted in Consistent Strong Performance
15
Key Pillars
Professional and experienced
management team
Broad Based Shareholder and
Strong Capital Base
Robust corporate governance
framework and processes
Eminent Board of Directors

Financial Performance
16

Strong Profitability Momentum Continues
* Not Annualized
17
Parameter Q4 18 Q4 17 YoY Q3 18 QoQ FY 18 FY 17
Net Interest Income 500 352 42% 467 7% 1,766 1,221
Other Income 312 237 32% 258 21% 1,068 755
Net Total Income 812 589 38% 726 12% 2,834 1,977
Operating Profit 383 282 36% 333 15% 1,331 920
Net Profit 178 130 37% 165 8% 635 446
Parameter Q4 18 Q4 17 Q3 18 FY 18 FY 17
Other Income/Total Income 38.4% 40.2% 35.6% 37.7% 38.2%
Cost/Income 52.9% 52.1% 54.0% 53.0% 53.5%
Net Interest Margin 4.0% 3.5% 3.9% 3.8% 3.3%
Credit Cost/Advances (bps) 24* 31* 20* 96 85
RoA 1.25% 1.20% 1.22% 1.21% 1.08%
RoE 10.90% 12.29% 10.21% 10.95% 11.67%

Strong Growth in Business; Improvement in Asset Quality
18
Parameter FY 18 FY 17 YoY
Advances 40,268 29,449 37%
Deposits 43,902 34,588 27%
Investment 15,447 13,482 15%
Parameter FY 17 Q3 18 FY 18
CASA 22.0% 24.0% 24.3%
GNPA 1.20% 1.56% 1.40%
NNPA 0.64% 0.97% 0.78%
Total Stressed Assets 1.45% 1.74% 1.48%
PCR 59.6% 52.5% 57.6%
CRAR 13.7% 15.9%* 15.3%
* including interim profits

Q4 17 Q3 18 Q4 18 FY 17 FY 18
Well Diversified Other Income Profile; Rising Core Fee Income
Other Income
19
Q4 17 Q3 18 Q4 18 FY 17 FY 18
Core Fee Income Breakup
258
237
86%
71%
270
230
16%
15%
38%
19%
31%
15% 14%
83%
887
205
29%
12%
19%
37%
14%
14%
17%
1,068
13%
87%
83%
17%
24%
6%
14%
10%
28%
16%
28%
14%
10%
89%
11%
627 311
10%
755
4% 4%
9%
9%
33%
4%
16%
3%
10%
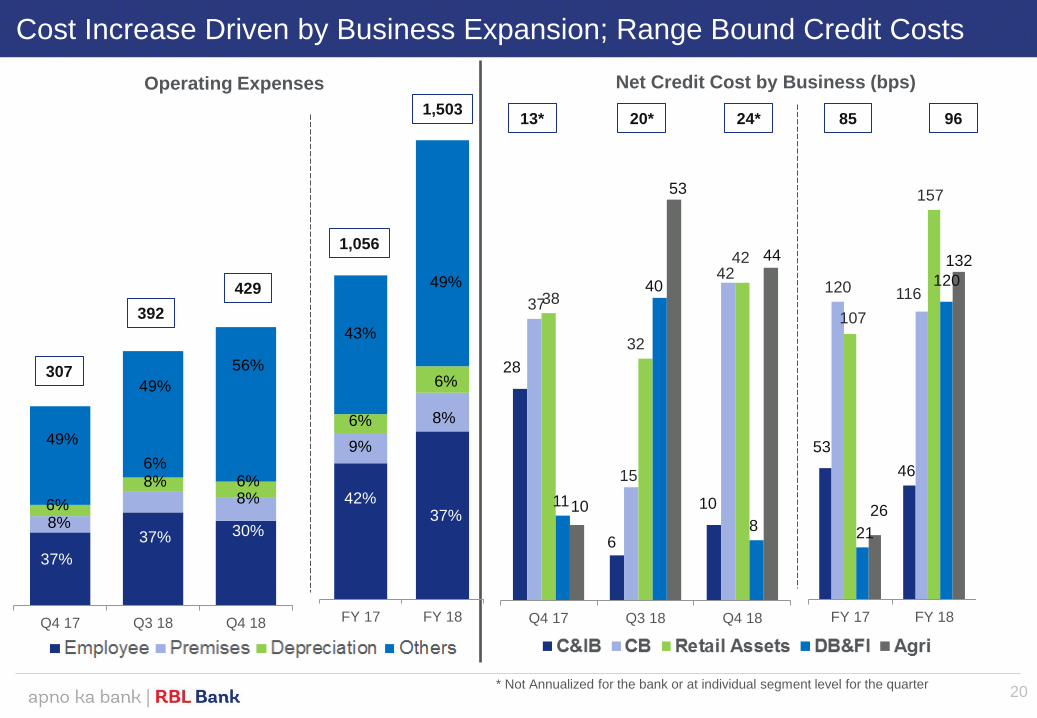
Cost Increase Driven by Business Expansion; Range Bound Credit Costs
Operating Expenses Net Credit Cost by Business (bps)
28
6
10
37
15
42
38
32
42
11
40
8
10
53
44
Q4 17 Q3 18 Q4 18
13* 20* 24* 96
* Not Annualized for the bank or at individual segment level for the quarter 20
53
46
120
116
107
157
21
120
26
132
FY 17 FY 18FY 17 FY 18Q4 17 Q3 18 Q4 18
392
429
1,056
37%
37%
6%
49%
8%
85 1,503
307
8% 6%
49%
42%
9%
6%
43%
30%
6%
56%
8% 37%
6%
49%
8%

Changing Advances Mix and Lower Cost of Funds Helping NIMs
FY 18 FY 17 YoY Yield
FY 18 Proportion
C&IB 16,240 12,339 32%
8.76%
(9.89%) 59% CB 7,512 5,510 36%
Wholesale 23,752 17,849 33%
Retail Assets 8,891 5,370 66%
13.40%
(13.38%) 41%
DB & FI 5,684 4,122 38%
Micro-banking 3,560 2,161 65%
IFI 1,543 1,631 -5%
MSME 581 330 76%
Agri 1,940 2,109 -8%
Non-Wholesale 16,516 11,600 42%
Total 40,268 29,449 37% FY 17 yields in brackets
21

FY 17 Q3 18 FY 18
Secured Unsecured
Diversified Loan Portfolio
Break up of advances -
Secured/Unsecured
22
By Geography
68%
29,449
FY 17 Q3 18 FY 18
North West South East
29,449
36,890
68%
32%
32%
25%
38%
16%
21%
40,268
68%
32%
36,890
40,268
22%
42%
19%
17%
24%
41%
18%
17%

Stable Borrowers’ Rating Profile and Tenor of Advances
Breakup of rated exposures*
23
Tenor of Advances
23
FY 17 Q3 18 FY 18
<1 year 1-3 years 3-5 years >5 years
29,449
40,268
61%
23%
8%
8%
68%
18%
6%
8%
0.9% 0.9% 0.8% 6.6% 5.3% 4.7%
22.0% 23.1% 24.6%
24.6% 24.5% 22.4%
16.6% 17.2% 17.7%
14.4% 13.4% 14.6%
7.0% 7.2% 7.7%
7.8% 8.3% 7.5%
FY 17 Q3 18 FY 18
BB & BELOW BB+ BBB-
BBB A-/ BBB+ A+/ A
AA- AAA/ AA+/AA A+ or higher
BBB- or higher
29.0% 29.7%
93.8% 94.5%
* Borrower ratings, not facility ratings; Based on internal ratings
92.5%
29.2% 36,890
66%
20%
7%
7%

Industry Exposure FB-NFB Split % of Exposure
Construction 4,561 44:56 6.7%
Retail / Distribution 3,599 76:24 5.3%
Power 2,928 54:46 4.3%
Engineering 2,758 53:47 4.1%
Real estate 2,658 95:5 3.9%
Pharma 2,589 82:18 3.8%
Professional services 2,544 80:20 3.7%
Metals 1,627 29:71 2.4%
Financial services 1,563 84:16 2.3%
Oil & gas storage / pipeline 1,504 30:70 2.2%
Well Diversified Industry Exposure & Growing NFB Exposure
Particulars FY 18 FY 17 Q3 18
Guarantees 9,655 7,548 9,029
Letter of Credit 1,257 910 1,781
Acceptances, Endorsements and other
Obligations 1,582 840 1,029
Non Fund Based Book
Top 10 industry exposures*
* As of March 31, 2018 excluding cash-backed exposures
24

Asset Quality Continues to Remain Strong
Q4 18 FY 18 FY 17
Movement of Gross
NPAs
Opening Balance 580 357 208
(+) Additions during the
period 115 569 533
(-) Upgrade 56 70 13
(-) Recoveries 50 130 303
(-) Write Offs 22 159 69
Closing Balance 567 567 357
Gross NPA (%) 1.40% 1.40% 1.20%
Net NPA 314 314 190
Net NPA (%) 0.78% 0.78% 0.64%
Provisioning Coverage
Ratio (PCR) (%) 57.57% 57.57% 59.58%
Slippage Ratio 0.31% 1.93%
2.51%
Restructured % 0.08% 0.08% 0.25%
Total Stressed Assets% 1.48% 1.48% 1.45%
Security Receipts as a percentage of total advances at 0.07%
1 ARC sale for the quarter
25
Gross NPA by business segment
Business
segment
FY 17 Q3 18 FY 18
C&IB 103.8 142.2 83.1
% 0.84% 0.91% 0.51%
CB 138.9 105.7 126.4
% 2.53% 1.56% 1.67%*
Retail Assets 76.3 110.8 113.0
% 1.42% 1.41% 1.26%*
LAP 19.9 25.3 25.9
BIL 15.9 25.7 31.6
PIL 4.3 8.5 11.8
Cards 9.8 19.3 19.9
Others 26.4 32.0 23.7
Agri 18.1 57.6 81.5
% 0.86% 2.89% 4.15%
DB&FI 19.7 163.5 162.8
% 0.48% 3.38% 2.84%
Total 356.8 579.9 566.7
Total (%) 1.20% 1.56% 1.40%
*For CB the GNPA % would be 2.23% for FY 18 with the addition of wholesale agri; For
Retail Assets GNPA % would 1.36% for FY18 with the addition of retail agri

Capital Adequacy - Well Capitalized to Support Growth
Particulars FY 18 FY 17 Q3 18
Tier 1 Capital Funds* 6,544 4,231 6,407
Tier 2 Capital Funds 826 867 814
Total Capital Funds 7,370 5,097 7,222
Total RWA 48,079 37,155 45,324
Tier 1 CRAR* 13.6% 11.4% 14.1%
Total CRAR* 15.3% 13.7% 15.9%
RWA/Total Assets 77.7% 76.3% 81.8%
* CRAR and Tier 1 Capital Funds for interim financial periods has been computed after adding interim profit for better comparison
26

FY 17 Q3 18 FY 18
Term Deposits Savings Account Current Account
34,588
CASA : 22.0%
78.0%
10.9%
11.1%
CASA : 7,603
CASA : 24.3%
CASA : 10,678
75.7%
12.2%
12.2%
43,902
CASA : 24.0%
CASA : 9,280
76.0%
10.5%
13.5%
38,623
Sustained Growth in Deposits, Led by CASA
40% yoy growth in CASA, while total deposits grew by 27%
27

FY 17 Q3 18 FY 18
G-Sec Debentures & Bonds Money Market /Equities/MF Others
Steady Investment Book
Yield Q4 18 Q4 17 Q3 18 FY 18 FY 17
Total Investments 7.2% 7.7% 7.2% 7.4% 7.8%
SLR 7.3% 7.4% 7.3% 7.4% 7.5%
Non SLR 7.0% 8.2% 6.8% 7.3% 8.5%
Investment Breakup
Yield
13,482
28
15%
7% 5%
73%
15,447
13%
13%
1%
73%
13,071
15%
7% 2%
76%

NIM Improvement Helped by Lower Cost of Funds and Stable Yields
Yield on Advances
Cost of Funds
Pre-IPO
Cost of Deposits
FY 12
12.6%
8.3%
8.1%
FY 13
13.1%
9.6%
8.9%
FY 14
12.9%
9.4%
8.8%
FY 16
11.7%
7.6%
7.7%
FY 15
12.3%
8.4%
8.3%
Yield on Advances
Cost of Funds
Cost of Deposits
Q3 17
11.3%
6.9%
6.9%
Q4 17
10.8%
6.7%
6.8%
Q1 18
10.6%
6.5%
6.7%
Q2 18
10.6%
6.4%
6.6%
Q4 18
10.5%
6.2%
6.5%
Q3 18
10.4%
6.1%
6.4%
Post Listing Performance
FY 11
10.9%
5.8%
5.8%
29

Distribution Network
30

4
5
Our Growing, Multi-Layered Distribution Network
Locations Customers (Mn.)
Channels Number of transaction points
FY 18 Q3 18 FY 17
Branches 265 246 239
Metro 92 83 78
Urban 43 41 40
Semi-urban 76 68 68
Rural 54 54 53
Banking Outlets (BOs) 197 188 -
BC Branches (incl. BOs) 807 757 568
Microbanking 646 590 497
MSME 161 167 71
CSPs 194,296 100,017 57,614
ATMs 388 394 375
Channel Breakup
2.80 3.15 3.54 3.98 4.50
Q4 17 Q1 18 Q2 18 Q3 18 Q4 18
Branch, ATM, BC, CSP
ATM, CSP
BC, CSP
CSP
97
7
10
24 15
5
6
1
Daman
& Diu
1
Dadra &
Nagar Haveli
8
Goa
13
New Delhi
23
9
1
2 Chandigarh
7
1 Branch, BC, CSP
31
Figures in circles refer to
number of branches in given
state/union territory
100
28
GIFT
city
branch

Shareholding Pattern &
Ratings
32
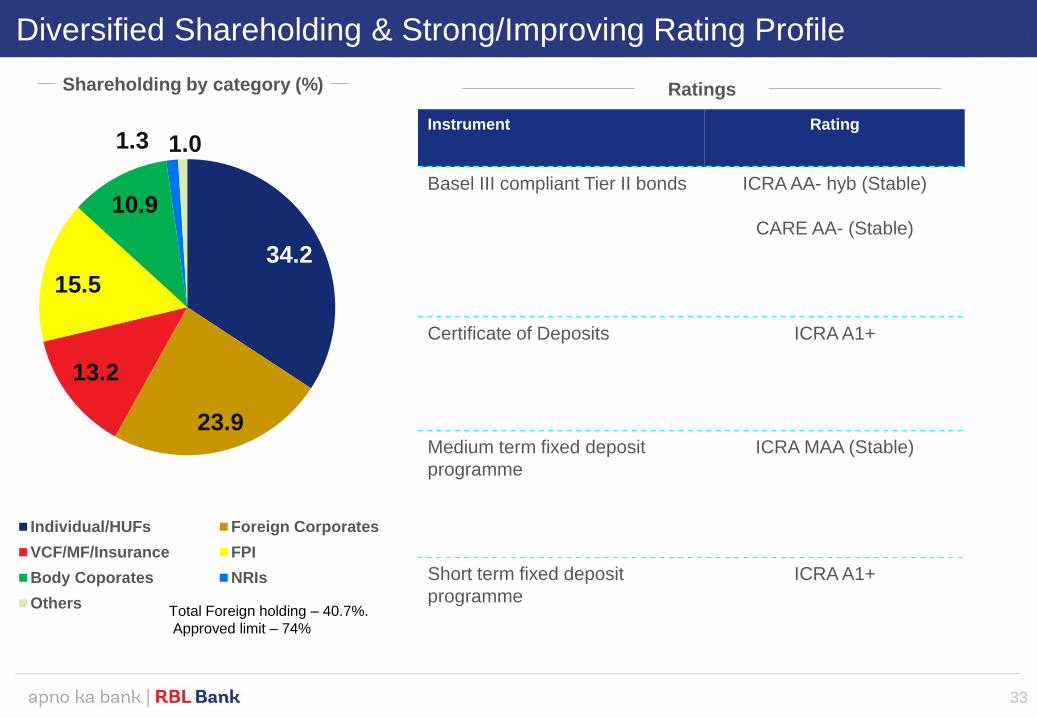
Diversified Shareholding & Strong/Improving Rating Profile
Shareholding by category (%) Ratings
33
Instrument Rating
Basel III compliant Tier II bonds ICRA AA- hyb (Stable)
CARE AA- (Stable)
Certificate of Deposits ICRA A1+
Medium term fixed deposit
programme
ICRA MAA (Stable)
Short term fixed deposit
programme
ICRA A1+
34.2
23.9
13.2
15.5
10.9
1.3 1.0
Individual/HUFs Foreign Corporates
VCF/MF/Insurance FPI
Body Coporates NRIs
OthersTotal Foreign holding – 40.7%.
Approved limit – 74%

Awards & New Initiatives
34

Awards and Initiatives
35
‘Best Small Bank’ &
‘Fastest Growing Bank’
(2017) at Business World
Magna Awards
‘Best Bank’ (2017)
at the Outlook Money
Awards
‘Most Promising
Company Of The Year’
(2017) at CNBC TV18 –
India Business Leader
Awards
‘
‘Best Small Bank’ (2017)
Business Today Banking
Awards
• Launched Rupay Powered Prepaid Cards with Indian Oil Corporation
• Partnered with CreditVidya for better underwriting of salaried and instant employee verification.
• Launched a co-branded prepaid FX card with Thomas Cook
Awards
Launches

Awards and Initiatives (contd.)
36

Annexures
37

Board of Directors
Mr. Narayan Ramachandran
Chairman
Previously, CEO and Country Head of Morgan Stanley, India
Mr. Vishwavir Ahuja
Managing Director and CEO
Previously, Managing Director & Country Executive Officer of Bank
of America for Indian Sub-continent
Mr. Jairaj Purandare
Independent Director
Previously, Regional Managing Partner of PWC
Mr. Palepu Sudhir Rao
Independent Director
Currently, Associated with a Number of Corporates including Aditya
Birla Money Ltd and Radhakrishna Foodland Pvt Ltd
Ms. Rama Bijapurkar
Independent Director
Wide Experience in Market Research, Market Strategy and
Management Consulting
Mr. Sivanandhan Dhanushkodi
Independent Director
Currently, Part-Time Security Advisor to RBI
Previously, Director General of Police, Maharashtra
Mr. Vimal Bhandari
Independent Director
Director ,Indostar Capital Finance Limited
Mr. Prakash Chandra
Independent Director
Previously, Chairman of Central Board of Direct Taxes (CBDT)
Mr. Ishan Raina
Independent Director
Previously, Founder of Out of Home (OOH) India, Associated with J.
Walter Thompson (JWT) and Lintas Advertising
38
Mr. Rajeev Ahuja
Executive Director
Previously, associated with Citibank India, Bank of America, India
and Bankers Trust Company

Professional and Experienced Leadership Team
Mr. Vishwavir Ahuja
Managing Director and CEO
Managing Director & Country Executive Officer of Bank of America
for Indian Sub-continent from 2007-2009
Mr. Harjeet Toor
Head - Retail, Inclusion and Rural Business, Credit Cards, Retail
and MSME Lending
Previously, associated with Bank of America, ABN AMRO Bank and
Fullerton India Credit Company
Mr. Rajeev Ahuja
Executive Director
Previously, associated with Citibank India, Bank of America, India
and Bankers Trust Company
Mr. Andrew Gracias
Head - Financial Markets
Previously, associated with Bank of America and UBS
Mr. Vincent Valladares
Head - Commercial Banking
Previously, Middle East Head – Commercial Banking, Citibank
Mr. Surinder Chawla
Head – Geography, Branch and Business Banking
Previously, associated with Standard Chartered Bank, ABN Amro
Bank and HDFC Bank
Mr. R. Gurumurthy
Head – Risk & Governance
Previously, associated with Standard Chartered Bank, Bank of
America, Credit Lyonnais and State Bank of India with leadership
roles in India and Asia-Pacific region
Mr. Brijesh Mehra
Head – Corporate, Institutional & Transaction Banking
Previously, Country Manager, Royal Bank of Scotland N.V. and prior
to that associated with Grindlays Bank Public Limited Company
Figures in brackets are years of work experience in financial services
(35)
(32)
(31)
(23)
(25)
(31)
(22)
(20)
39
Ms. Shanta Vallury Gandhi
Head - HR, CSR & Internal Branding
Previously, Vice President of Acquisitions and Partnerships Division in
American Express Bank Ltd (Gurgaon) (25)
Mr. Jaideep Iyer
Head - Strategy
Previously, Group President and Deputy CFO – Yes Bank (20)

Professional and Experienced Leadership Team (Contd.)
Ms. Neeta Mukerji
Chief Credit Officer
Previously, associated with ICICI Bank, Asset Reconstruction
Company (India) and GE Capital
Mr. Bhaskar Niyogi
Chief Risk Officer
Previously, Chief General Manager at State Bank of India
(28)
Figures in brackets are years of work experience in financial services
Mr. Bhavtaran Singh (Sunny) Uberai
Head – Client Services
Previously, associated with ABN Amro Bank and Arete Financial
Partners, Singapore (32)
40
Mr. Shrinath Bolloju
Chief Operations Officer
Previously, Global Head Securities Transformation – Deutsche Bank
Singapore (25) (40)
Mr. Ujual George
Chief of Staff and Head of Transformation
Previously, associated with Abu Dhabi Commercial Bank and
Barclays Bank (23)
Mr. Mohit Kapoor
Head - Legal
Previously, associated with Hewitt Associates, Max New York Life,
Citibank India (25)

Profit & Loss Statement
Particulars Q4 18 Q4 17 Q3 18 FY 18 FY 17
Income
Interest Earned 1,223 986 1,151 4,508 3,713
Interest Expended 722 634 683 2,741 2,492
Net Interest Income 500
352 467 1,766
1,221
Other Income 312
237 258 1,068
755
Total Income 812
589 726 2,834
1,977
Expenditure
Operating Expenses 429 307 392 1,503 1,056
Employee Cost 131 113 144 551 446
Premises Cost 35 25 32 126 99
Depreciation 25 17 22 87 62
Other Operating Expenses 238 152 195 739 449
Operating Profit 383 282 333 1,331 920
Provisions 113 82 82* 365 239
On advances 74 83 68 300 197
On others 39 -1 14 65 41
Profit Before Tax 270 200 251 967 681
Tax 92 70 86 332 235
Profit After Tax 178 130 165 635 446
41

Balance Sheet Statement
Particulars FY18 FY 17 Q3 18
Liabilities
Capital 420 375 418
Reserves and Surplus 6,264 3,960 6,059
Deposits 43,902 34,588 38,623
Borrowings 9,261 7,980 8,297
Other Liabilities 2,003 1,771 1,972
Total 61,851 48,675 55,369
Assets
Cash & Balances with RBI 2,589 2,948 2,318
Balances with other banks 1,695 1,246 1,113
Investments (Net) 15,448 13,482 13,071
Advances (Net) 40,268 29,449 36,890
Fixed and Other Assets 1,851 1,550 1,977
Total 61,851 48,675 55,369
42

Our Recent History
Particulars FY 11 FY 12 FY 13 FY 14 FY 15 FY 16 FY 17 FY 18
Net Worth 1,075 1,131 1,594 2,012 2,224 2,960 4,242 6,544
Deposits 2,042 4,739 8,341 11,599 17,099 24,349 34,588 43,902
Advances (Net) 1,905 4,132 6,376 9,835 14,450 21,229 29,449 40,268
Investments (Net) 892 2,334 5,571 6,518 9,792 14,436 13,482 15,448
Net Profit 12 66 92 93 207 292 446 635
CRAR (%) 56.4 23.2 17.1 14.6 13.1 12.9 13.7 15.3
Gross NPA (%) 1.12 0.80 0.40 0.79 0.77 0.98 1.20 1.4
Net NPA (%) 0.36 0.20 0.11 0.31 0.27 0.59 0.64 0.78
Business per employee 4.4 6.7 7.9 7.7 9.1 11.8 13.1 15.9
No. of employees 907 1,328 1,859 2,798 3,465 3,872 4,902 5,300
Return on Assets (%) 0.53 1.33 1.05 0.66 1.02 0.98 1.08 1.21
Return on Equity (%) 1.7 5.9 6.73 5.44 9.58 11.32 11.67 10.95
43

Thank you
Contact us at:
+91-22-4302 0600
Please email us your contact details at the above id to get added to our investor relations mailing list
Please visit our Investor Relations website – https://ir.rblbank.com/
44


![Untitled-1 [corrugex.com] · Machinery, Technology & Allied Industries TM ... Corrugation industry in India India corrugated box market is expected to reach over INR 63,000 Crore](https://static.fdocuments.in/doc/165x107/5fb43ece3dfe3548c72e7212/untitled-1-machinery-technology-allied-industries-tm-corrugation.jpg)