INVESTOR PRESENTATION - Groupe Casino FR · INVESTOR PRESENTATION APRIL 2015 . CONTENTS Casino’s...
35
INVESTOR PRESENTATION APRIL 2015
Transcript of INVESTOR PRESENTATION - Groupe Casino FR · INVESTOR PRESENTATION APRIL 2015 . CONTENTS Casino’s...
INVESTOR
PRESENTATION
APRIL 2015
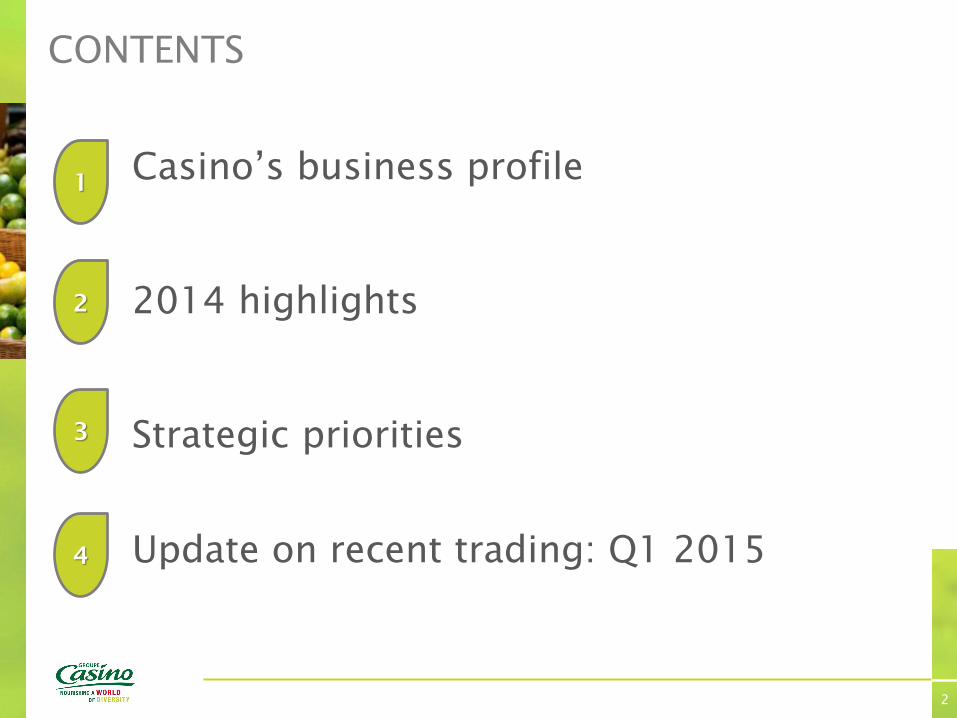
CONTENTS
Casino’s business profile
2014 highlights
Strategic priorities
Update on recent trading: Q1 2015
2
1
2
3
1
2
4

CASINO’S BUSINESS PROFILE
1

CASINO HAS A UNIQUE BUSINESS PROFILE
2014 Group sales
4
Strong mix of formats in France
Leadership positions in a limited number of attractive countries
Fast-growing non-food E-commerce platform
France Retail 39%
International Retail 54%
E-commerce 7%
CASINO HAS A DIVERSIFIED AND RESILIENT MIX OF FORMATS
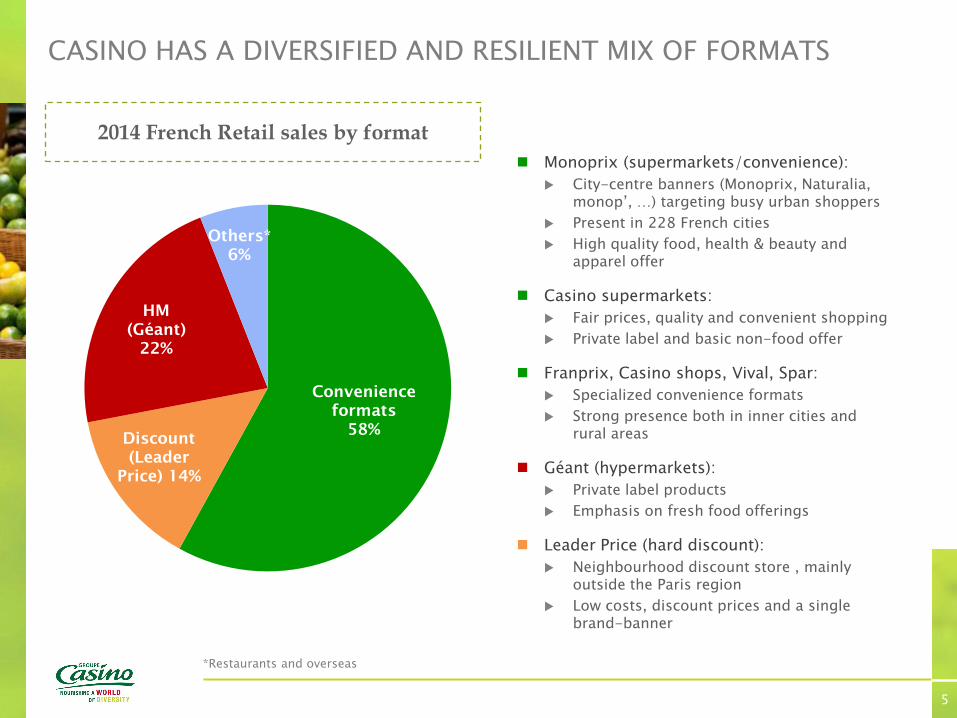
2014 French Retail sales by format
*Restaurants and overseas
5
Monoprix (supermarkets/convenience):
City-centre banners (Monoprix, Naturalia, monop’, …) targeting busy urban shoppers
Present in 228 French cities
High quality food, health & beauty and apparel offer
Casino supermarkets:
Fair prices, quality and convenient shopping
Private label and basic non-food offer
Franprix, Casino shops, Vival, Spar:
Specialized convenience formats
Strong presence both in inner cities and rural areas
Géant (hypermarkets):
Private label products
Emphasis on fresh food offerings
Leader Price (hard discount):
Neighbourhood discount store , mainly outside the Paris region
Low costs, discount prices and a single brand-banner
Convenience
formats
58% Discount
(Leader
Price) 14%
HM
(Géant)
22%
Others*
6%

CASINO HAS BUILT ITS INTERNATIONAL EXPOSURE WITH A CLEAR FOCUS ON ATTRACTIVE COUNTRIES
Casino has favored countries with the following characteristics:
Fast-growing markets
Large and young population
Business friendly environment
Casino has leading positions in 4 such countries representing c.400 million inhabitants : Brazil: GPA; Colombia: Exito; Thailand and Vietnam: Big C
Large and young populations
Thailand Vietnam Colombia Brazil
Modern trade* Traditional trade
Still low formal distribution Fast-growing markets
France
197
87 70
47
Millions of inhabitants
Thailand Vietnam Colombia Brazil
% of population below 15 years old
20% 25% 27% 26%
Sources: CIA World Factbook (May 2012), IMF World Economic Outlook Database (April 2012), AC Nielsen , World Bank, Economists Consensus
*as opposed to traditional retail shops, modern trade refers to a full range of sale methods based on marketing techniques
-0,7
3,6 3,8
6,0
1,3
3,7 3,9
6,1 2015
2016
Expected GDP growth
58%
86%
53% 52%
42%
14%
47% 48%
6

1
11
21
31
41
51
61
10
110
210
310
410
510
610
710
2010 2011 2012 2013 2014
Sales
EBITDA
200
300
400
500
600
700
800
900
1000
2000
3000
4000
5000
6000
7000
8000
9000
10000
11000
12000
2010 2011 2012 2013 2014
Sales
EBITDA
2
4
6
8
10
12
14
16
20
40
60
80
100
120
140
160
2010 2011 2012 2013 2014
Sales
EBITDA
BIG C, EXITO AND GPA HAVE POSTED STEADY AND REGULAR GROWTH IN SALES AND EARNINGS SINCE THEIR ACQUISITION BY CASINO
SALES (in BRL billions)
EBITDA (in BRL billions)
SALES (in THB billions)
EBITDA (in THB billions)
SALES (in COP billions)
EBITDA (in COP billions)
7
0
50
100
150
200
250
300
350
400
2009 2010 2011 2012 2013 2014 2015
Exito
IGBC
0
50
100
150
200
250
300
350
400
2009 2010 2011 2012 2013 2014 2015
GPA
IBOV
0
100
200
300
400
500
600
700
800
2009 2010 2011 2012 2013 2014 2015
Big C
SET
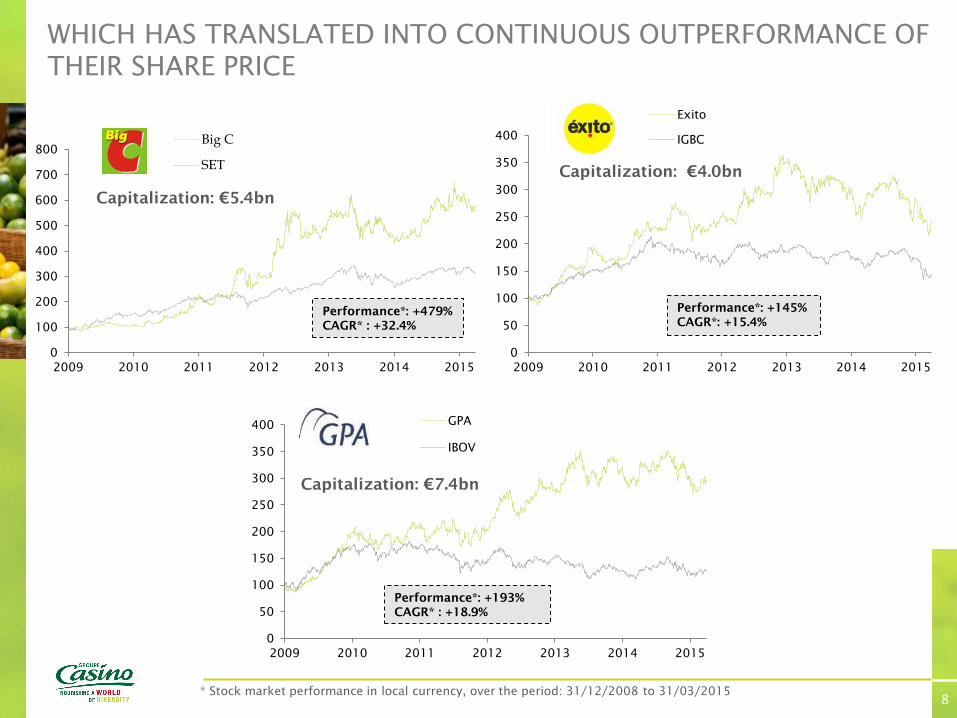
WHICH HAS TRANSLATED INTO CONTINUOUS OUTPERFORMANCE OF THEIR SHARE PRICE
* Stock market performance in local currency, over the period: 31/12/2008 to 31/03/2015
Performance*: +479%
CAGR* : +32.4%
Performance*: +193%
CAGR* : +18.9%
8
Capitalization: €5.4bn
Capitalization: €4.0bn
Capitalization: €7.4bn
Performance*: +145%
CAGR*: +15.4%
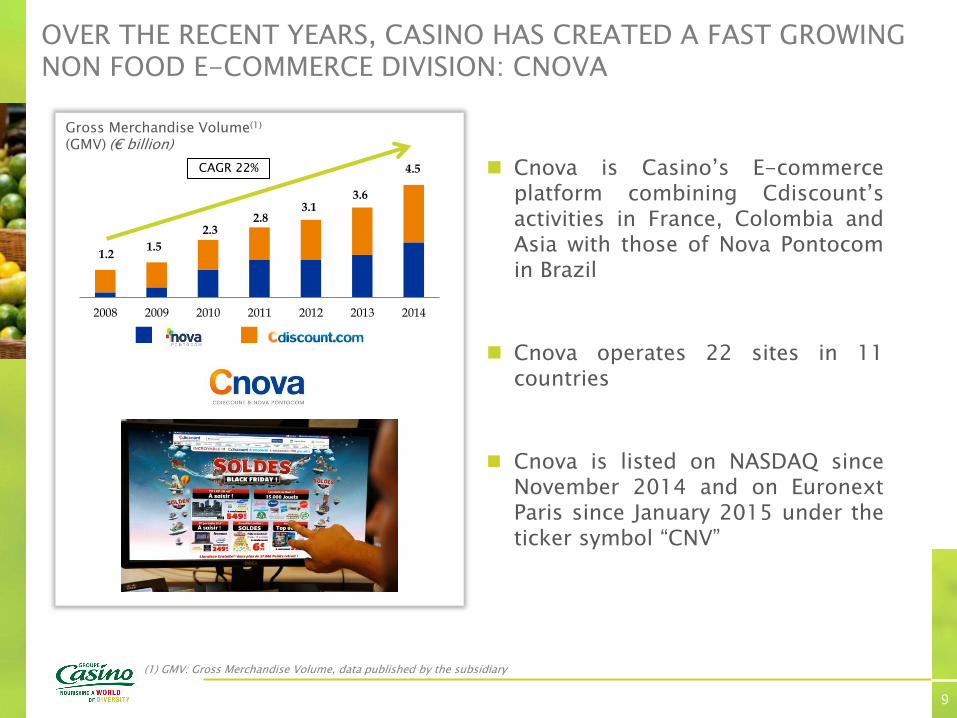
OVER THE RECENT YEARS, CASINO HAS CREATED A FAST GROWING NON FOOD E-COMMERCE DIVISION: CNOVA
Cnova is Casino’s E-commerce platform combining Cdiscount’s activities in France, Colombia and Asia with those of Nova Pontocom in Brazil
Cnova operates 22 sites in 11 countries
Cnova is listed on NASDAQ since November 2014 and on Euronext Paris since January 2015 under the ticker symbol “CNV”
(1) GMV: Gross Merchandise Volume, data published by the subsidiary
2008 2009 2010 2011 2012 2013 2014
3.6 3.1
2.8 2.3
1.5 1.2
CAGR 22%
Gross Merchandise Volume(1) (GMV) (€ billion)
4.5
9

2
2014 HIGHLIGHTS
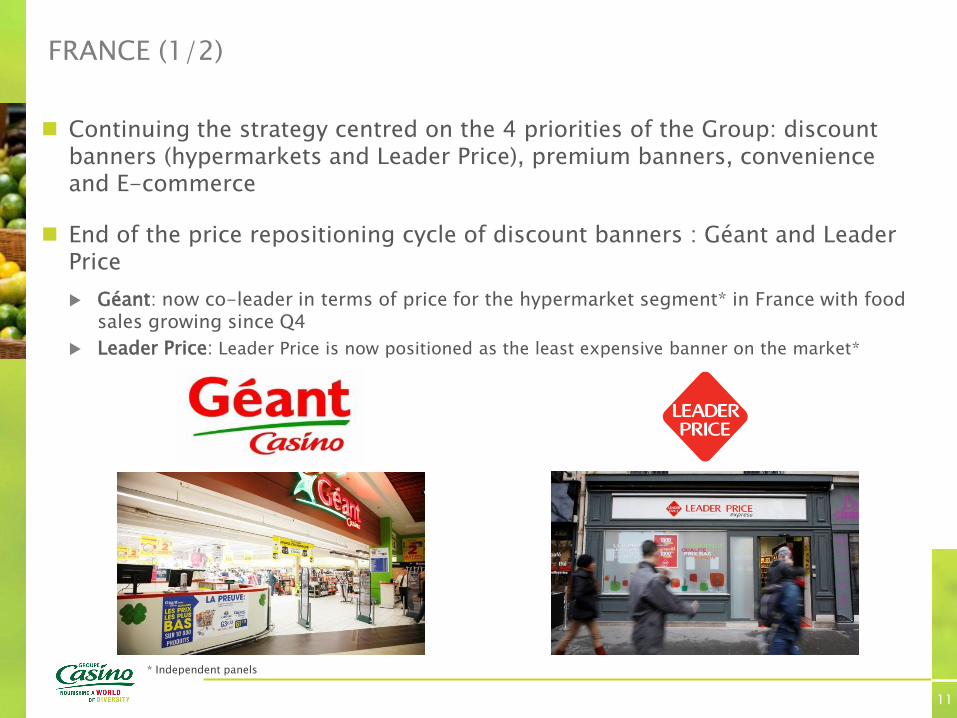
Continuing the strategy centred on the 4 priorities of the Group: discount banners (hypermarkets and Leader Price), premium banners, convenience and E-commerce
End of the price repositioning cycle of discount banners : Géant and Leader Price
Géant: now co-leader in terms of price for the hypermarket segment* in France with food sales growing since Q4
Leader Price: Leader Price is now positioned as the least expensive banner on the market*
* Independent panels
FRANCE (1/2)
11

Satisfactory development of premium and convenience banners
Monoprix: continued expansion in different formats (Monoprix, Monop’, Naturalia, etc.) and high margin maintained
Convenience banners: substantial increase in sales, success of renovations and resumption of expansion (Leader Price Express)
Partnership agreement in the area of purchasing signed with Intermarché
* Independent panels
FRANCE (2/2)
12
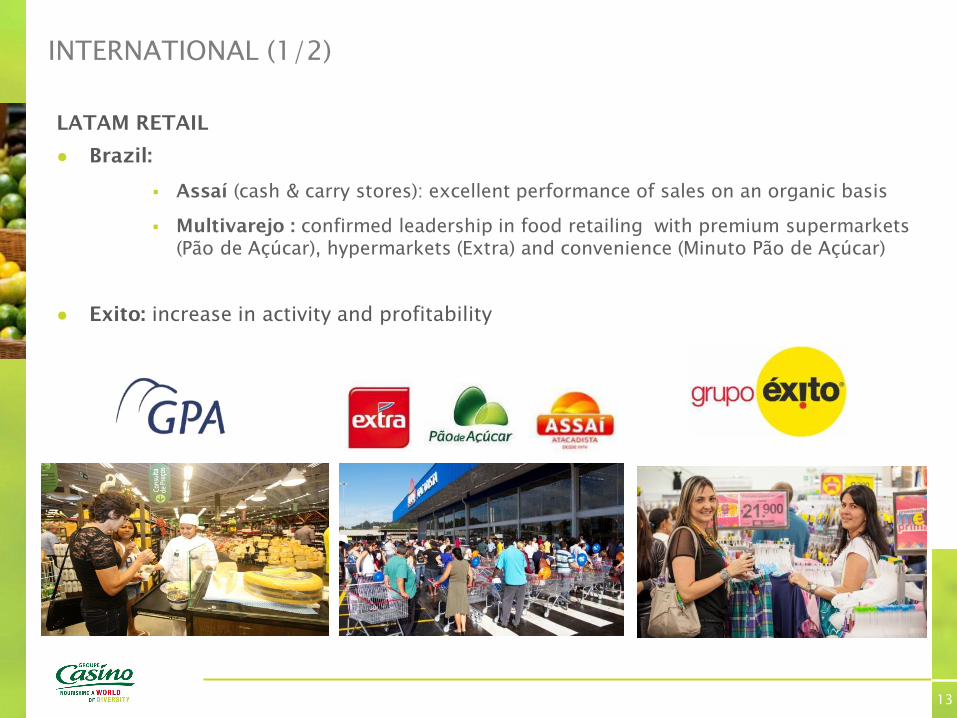
LATAM RETAIL
● Brazil:
Assaí (cash & carry stores): excellent performance of sales on an organic basis
Multivarejo : confirmed leadership in food retailing with premium supermarkets
(Pão de Açúcar), hypermarkets (Extra) and convenience (Minuto Pão de Açúcar)
● Exito: increase in activity and profitability
INTERNATIONAL (1/2)
13

LATAM ELECTRONICS
Viavarejo: leader in South America in the distribution of electronic products and furniture,
gaining market share
ASIE
● Very satisfactory operating and financial performances
● Big C Thailand : Improvement in profitability in an unfavorable local context
● Big C Vietnam : Organic growth of sales in a context of macroeconomic slowdown
INTERNATIONAL (2/2)
THAILAND VIETNAM
14

CNOVA: ANOTHER QUARTER OF STRONG GROWTH OF GMV AND NET SALES IN 2015
GMV(1) of €4.5bn (+28.2%)
Net sales of €906mn (+17,7%)
14.8m active customers(2) in the world (+27.6%)
9.3m orders(3) (+38.2%)
16.0m units sold (+38.9%)
(1) GMV: Gross Merchandise Volume, data published by the subsidiary (2) Active customers at the end of March having purchased at least once through our sites over the last 12 months (3) Total placed orders before cancellation due to fraud or customers not paying for their order
15

CASINO CONTINUOUSLY MAINTAINS A STRONG FINANCIAL DISCIPLINE
16
All international subsidiaries are FCF positive:
Strong cash-flow
Rigorous monitoring of capex and positive working capital generation
Casino operates in countries where dividends are fully convertible and can be repatriated without significant tax leakage
Our balance sheet no longer carries significant put options
Casino has a proven track record of optimizing its capital allocation through:
Disposals
Asset rotation
Partial recap
STRATEGIC PRIORITIES
3

● Casino’s revenue rose by +67% over the past 5 years, exceeding €48bn in 2014 to rank 11th among worldwide food distributors
● This strong growth, topping the largest distribution companies according to the most recent Deloitte study*, was built by prioritizing development in the most buoyant countries and formats
2010
2014
2010
2014
2010
2014
2010
2014
2010
2014
Casino Group
GPA
€48.5bn
€29.1bn
R$65.5bn
R$32.1bn
Cnova Exito Big C Thailand
€4.5bn
€2.3bn
COP11.420bn
COP7.325bn
THB121.8bn
THB83.9bn
CAGR: +19.5% CAGR: +18.3% CAGR: +11.7% CAGR: +9.8%
* Global Powers of Retailing 2015, published January 2015 – Growth rate of +11.1% for Casino between 2008 and 2013
CAGR: Compound Annual growth Rate of sales (except for Cnova – data in GMV)
CAGR +13.6%
THE GROUP IN 2015
18
● After their pricing repositioning, develop discount banners in France and accelerate international roll-out
● Strengthen leadership position in premium formats
● Boost expansion in convenience formats
● Cnova: maintain strong growth and Cash Flow generation
● Continue to improve operational efficiency: optimize costs and purchasing
CONTINUED ROLLOUT OF THE GROUP’S 5 STRATEGIC PRIORITIES
19

● Success of the overhaul of Géant and Leader Price’s business model
• Géant currently co-leader in terms of prices for hypermarkets*
• Leader Price now the lowest priced banner in the market* and in recovery since Q4 2014
● Roll-out of new concepts such as Leader Price Express,
a discount convenience format
● Internationally, continued and sustained Cash & Carry expansion
• Ongoing improvement in Assaí market share,
currently No. 2 in the segment in Brazil
• In Columbia, rapid roll-out of Surtimax using a single
membership model in addition to expansion
• Adaptation of Cash & Carry model in Asia: Big C compact
AFTER THEIR PRICING REPOSITIONING, DEVELOP DISCOUNT BANNERS IN FRANCE AND ACCELERATE INTERNATIONAL ROLL-OUT
* Independent panels
20

STRENGTHEN LEADERSHIP POSITION IN PREMIUM FORMATS
● Leading position in three of the Group’s key countries with 900 stores at the end of 2014:
• 540 Monoprix stores / 92 Naturalia in France
• 181 Pão de Açúcar in Brazil
• 71 Carulla in Colombia
● Accelerate expansion to strengthen this unique position
• In France, expansion into the profitable Monoprix formats: City Marché, Monop’, Naturalia, ...
• In Colombia and Brazil, an ambitious plan to open some 40 stores a year under existing banners
21
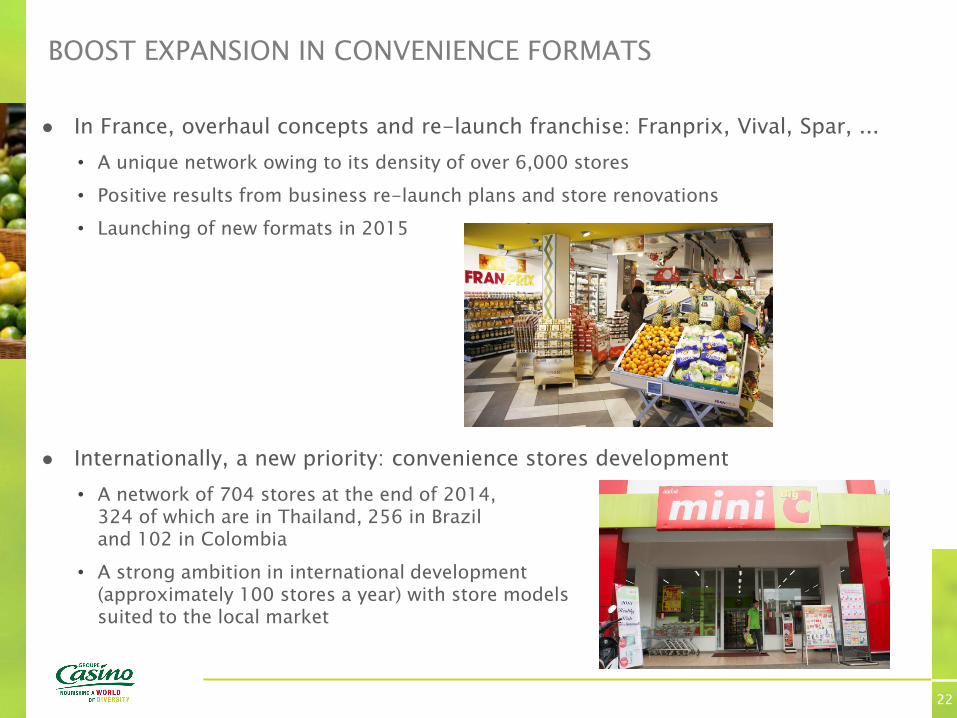
BOOST EXPANSION IN CONVENIENCE FORMATS
● In France, overhaul concepts and re-launch franchise: Franprix, Vival, Spar, ...
• A unique network owing to its density of over 6,000 stores
• Positive results from business re-launch plans and store renovations
• Launching of new formats in 2015
● Internationally, a new priority: convenience stores development
• A network of 704 stores at the end of 2014, 324 of which are in Thailand, 256 in Brazil and 102 in Colombia
• A strong ambition in international development (approximately 100 stores a year) with store models suited to the local market
22
● Continue solid sales growth and GMV
● Maintain price positioning for sites and broaden their assortment
● Sharply accelerate development of marketplaces and mobile sales
● Continue to launch new international and specialized sites
● Continue to improve synergies with the Group: procurement, logistics and pickup points
CNOVA: MAINTAIN STRONG GROWTH AND CASH FLOW GENERATION
23

● In France, agreement signed with Intermarché to create a shared buying group
● Internationally, the Group’s size is a major asset in business negotiations with international suppliers
● In non-food, improved purchasing synergies between Cnova, Viavarejo and Casino
OPERATIONAL EFFICIENCY: IMPROVING PURCHASING TERMS
24

● Proactive and highly disciplined approach to controlling costs at all banners in all of the Group’s geographic regions
● Lowering operational and structural costs: a systematic approach based on productivity benchmarks and shared processes
● Investment optimization: reducing per square meter building costs and expansion using models that require less capital
● Gradual implementation of synergies between banners
• Budget for IT and advertising agencies
• Sourcing and own brands (Casino, Finlandek, etc.)
• Multichannel: Click & Collect (France, Brazil, etc.)
• Etc.
OPERATIONAL EFFICIENCY: COST CONTROL AND SYNERGIES
25

UPDATE ON RECENT TRADING : Q1 2015
4
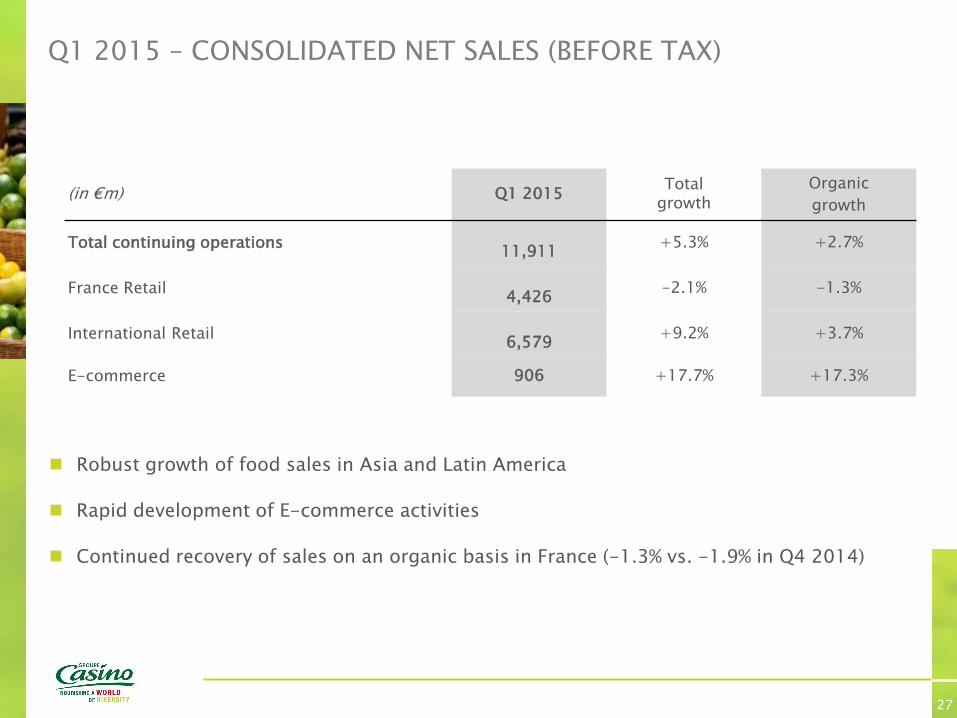
Q1 2015 – CONSOLIDATED NET SALES (BEFORE TAX)
27
(in €m) Q1 2015 Total
growth
Organic
growth
Total continuing operations
11,911 +5.3% +2.7%
France Retail
4,426 -2.1% -1.3%
International Retail
6,579 +9.2% +3.7%
E-commerce 906 +17.7% +17.3%
Robust growth of food sales in Asia and Latin America
Rapid development of E-commerce activities
Continued recovery of sales on an organic basis in France (-1.3% vs. -1.9% in Q4 2014)

Q1 2015 – PERFORMANCE BY SEGMENT
28
France Retail: price cuts in 2014 continue to impact sales in France of -1.9%. Same-store sales for all banners improved sequentially compared to the previous quarter. Volumes are up both in same-store sales (+0.3%) and organic (+0.6%)
Food sales in Latin America: strong growth due to an acceleration in organic growth and the integration of Super Inter in Colombia
Viavarejo: broadly stable excluding the impact of the store closings
Food retailing business in Asia: organic growth improved compared to the previous quarter and same-store growth is now positive
Cnova: strong growth in net sales with an increase in customer loyalty; very high rate of marketplace growth in both regions
(in €m) Q1 2015 Total growth Organic growth Same-store growth
France Retail 4,426 -2.1% -1.3% -1.6%
Latam Retail 3,870 +10.2% +6.1% +2.6%
Latam Electronics 1,666 -0.8% -1.3% -2.7%
Asia 1,043 +25.4% +3.7% +0.3%
E-commerce 906 +17.7% +17.3% +17.0%

APPENDICES

Q1 2015 FRANCE RETAIL – PERFORMANCE BY BANNERS
30
(in €m) Q1 2015 Total growth Organic growth Same-store growth
Géant Casino 1,053 -3.8% -1.5% -1.5%
Casino Supermarkets 741 -5.7% -3.7% -1.4%
Monoprix 1,016 +0.6% +0.9% +0.3%
Franprix – Leader Price 1,013 -1.8% -2.4% -5.6%
Convenience & Other* 602 +0.8% -0.3% +1.3%
* Includes the cafeterias, real estate, other and Indian Ocean activities
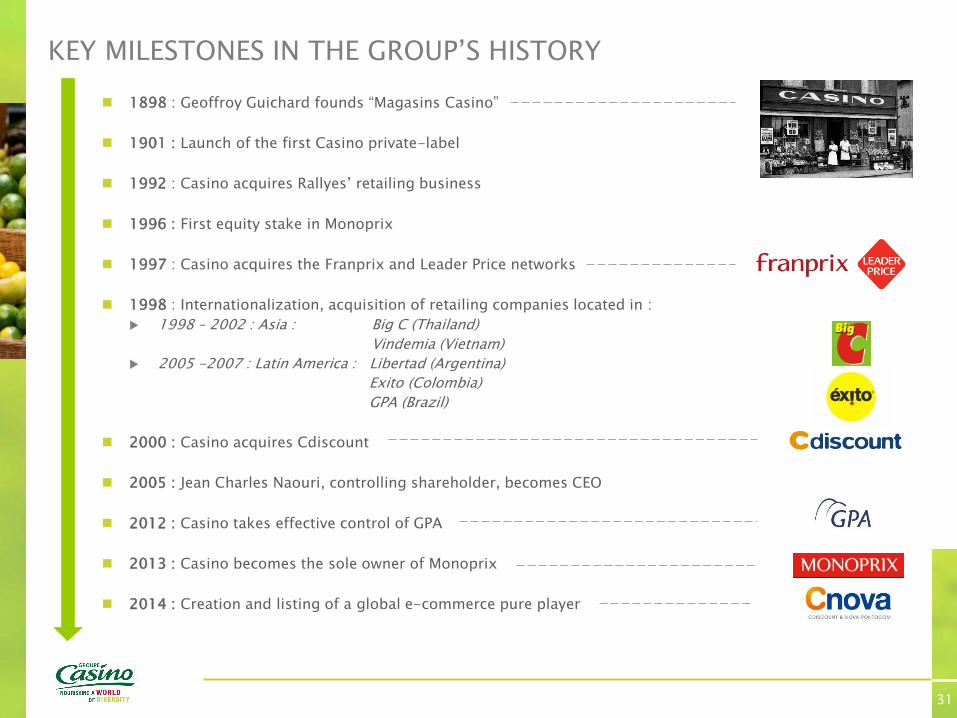
KEY MILESTONES IN THE GROUP’S HISTORY
1898 : Geoffroy Guichard founds “Magasins Casino”
1901 : Launch of the first Casino private-label
1992 : Casino acquires Rallyes’ retailing business
1996 : First equity stake in Monoprix
1997 : Casino acquires the Franprix and Leader Price networks
1998 : Internationalization, acquisition of retailing companies located in :
1998 – 2002 : Asia : Big C (Thailand)
Vindemia (Vietnam)
2005 -2007 : Latin America : Libertad (Argentina)
Exito (Colombia)
GPA (Brazil)
2000 : Casino acquires Cdiscount
2005 : Jean Charles Naouri, controlling shareholder, becomes CEO
2012 : Casino takes effective control of GPA
2013 : Casino becomes the sole owner of Monoprix
2014 : Creation and listing of a global e-commerce pure player
31

IN FRANCE, CASINO HAS UNDISPUTED LEADERSHIP IN CONVENIENCE FORMATS
Q1 2015 figures
32
Number
of stores
Average retail
space in sqm
444 c.1,600
632 c.1,200
860 c.430
1,267 c.160
200 c.180
889 c.270
1,726 c.100
Others (corners,…) 2,717 ns
Casino believes in smaller formats:
Various, segmented and flexible, they perfectly fit
the customers’ needs and behaviors for a more
diversified and easy-to-reach choice
Casino’s proximity stores in France
North-West
North-East
South-West
South-East
6%
39%
14%
41%

CASINO OPERATES IN A UNIQUE MIX OF COUNTRIES THROUGH LEADING RETAILERS
33
Q1 2015 Market capitalization (as of 31 March 2015): Bloomberg
#1 retailer
#2 e-tailer
2,159 stores
1.3m m²
#1 retailer
#1 e-tailer
1,397 stores
0.6m m² Co-leader
in HM
643 stores
1.7m m²
#1 in HM 40 stores 0.1m m²
#4 food retailer
#1 e-tailer
10,515 stores
4.1m m²
France
Vietnam
Thailand Brazil
Colombia Uruguay
€4.0bn market cap.
#1 retailer
54 stores
0.1m m²
€9.3bn market cap.
€7.4bn market cap.
€5.4bn market cap.

CNOVA SHAREHOLDER STRUCTURE
Economic interest
In % Cnova
Casino Group 58.1%
Minority 41.9%
Minority interests
43.3% 41.3%
52.3% 43.9% 43.3% 0.1%
54.8%
Management
50.0% 3.7%
6.6%
% of capital
Nova HoldCo
34

DISCLAIMER
This presentation contains forward-looking information and statements about Casino. Forward-looking statements are statements that are not historical facts. These statements include financial projections and estimates and their underlying assumptions, statements regarding plans, objectives and expectations with respect to future operations, products and services, and statements regarding future performance. Forward-looking statements are generally identified by the words “expects,” “anticipates,” “believes,” “intends,” “estimates” and similar expressions. Although the management of Casino believes that the expectations reflected in such forward-looking statements are reasonable, investors and holders of Casino securities are cautioned that forward-looking information and statements are subject to various risks and uncertainties, many of which are difficult to predict and generally beyond the control of Casino, that could cause actual results and developments to differ materially from those expressed in, or implied or projected by, the forward-looking information and statements. These risks and uncertainties include those discussed or identified in Casino’s public filings with the Autorité des marchés financiers (“AMF”), including those listed under “Risk Factors and Insurance” in the Registration Document filed by Casino on 28 March 2013. Except as required by applicable law, Casino undertakes no obligation to update any forward-looking information or statements.
This material was prepared solely for informational purposes and is not to be construed as a solicitation or an offer to buy or sell any securities or related financial instruments. Likewise it does not give and should not be treated as giving investment advice. It has no regard to the specific investment objectives, financial situation or particular needs of any recipient. No representation or warranty, either express or implied, is provided in relation to the accuracy, completeness or reliability of the information contained herein. It should not be regarded by recipients as a substitute for the exercise of their own judgement. All opinions expressed in this material are subject to change without notice.
This presentation and its contents are proprietary information and may not be reproduced or otherwise disseminated in whole or in part without the prior written consent of Casino Group.