Investor Presentation FY18
24
Investor Presentation FY18 52 weeks to 24 March 2018
Transcript of Investor Presentation FY18

Investor Presentation FY18
52 weeks to 24 March 2018
This presentation has been prepared by New Look Retail Group Limited and its subsidiaries (“New Look”) solely for informational purposes and does not constitute, and should not be construed as, an offer to sell or issue securities or otherwise constitute an invitation or inducement to any person to purchase, underwrite, subscribe to or otherwise acquire securities in any of the New Look entities. For the purposes of this disclaimer, the presentation that follows shall mean and include the slides that follow, the oral presentation of the slides by New Look or any person on its behalf, any question-and-answer session that follows the oral presentation, hard copies of this document and any materials distributed in connection with the presentation. By attending the meeting at which the presentation is made, dialing into the teleconference during which the presentation is made or reading the presentation, you will be deemed to have agreed to all of the restrictions that apply with regard to the presentation and acknowledged that you understand the legal regulatory sanctions attached to the misuse, disclosure or improper circulation of the presentation.
Certain statements contained in this presentation that are not statements of historical fact, including, without limitation, any statements preceded by, followed by or including the words “targets,” “believes,” “expects,” “aims,” “intends,” “may,” “anticipates,” “would,” “could” or similar expressions or the negative thereof, constitute forward-looking statements, notwithstanding that such statements are not specifically identified. Examples of forward-looking statements include, but are not limited to: (i) statements about future financial and operating results; (ii) statements of strategic objectives, business prospects, future financial condition, budgets, projected levels of production, projected costs and projected levels of revenues and profits of New Look or its management or boards of directors; (iii) statements of future economic performance; and (iv) statements of assumptions underlying such statements.
Forward-looking statements are not guarantees of future performance and involve certain risks, uncertainties and assumptions which are difficult to predict and outside of the control of the management of New Look. Therefore, actual outcomes and results may differ materially from what is expressed or forecasted in such forward-looking statements. We have based these assumptions on information currently available to us, and if any one or more of these assumptions turn out to be incorrect, actual market results may differ from those predicted. While we do not know what impact any such differences may have on our business, if there are such differences, our future results of operations and financial condition, could be materially adversely affected. You should not place undue reliance on these forward-looking statements. Forward-looking statements speak only as of the date on which such statements are made. New Look expressly disclaims any obligation or undertaking to disseminate any updates or revisions to any forward-looking statement to reflect events or circumstances after the date on which such statement is made, or to reflect the occurrence of unanticipated events.
This presentation is not for publication, release or distribution in Canada, Japan or Australia. Any failure to comply with this restriction may constitute a violation of securities laws. This presentation and the information contained herein are not an offer of securities for sale in the United States or to US persons. Any securities referred to herein have not and will not be registered under the Securities Act and may not be offered or sold in the United or to US persons. Any public offering of securities to be made in the United States would have to be made by means of a prospectus that would be obtainable from New Look and would contain detailed information about New Look, of any securities and its management, as well as financial statements. No money, securities or other consideration is being solicited, and, if sent in response to the information contained herein, will not be accepted.
The information contained in this presentation has not been subject to any independent audit or review. A significant portion of the information contained in this presentation, including all market data and trend information, is based on estimates or expectations of New Look, and there can be no assurance that these estimates or expectations are or will prove to be accurate. Our internal estimates have not been verified by an external expert, and we cannot guarantee that a third party using different methods to assemble, analyze or compute market information and data would obtain or generate the same results. We have not verified the accuracy of such information, data or predictions contained in this presentation that were taken or derived from industry publications, public documents of our competitors or other external sources. Further, our competitors may define our and their markets differently than we do. In addition, past performance of New Look is not indicative of future performance. The future performance of New Look will depend on numerous factors which are subject to uncertainty.
Certain financial measures and ratios related thereto in this presentation are not specifically defined under IFRS or any other generally accepted accounting principles. These measures are presented here because we believe that they and similar measures are widely used in our industry as a means of evaluating a company’s operating performance and financing structure. Our management believes this information, along with comparable IFRS measures, is useful to investors because it provides a basis for measuring the operating performance in the periods presented. These measures are used in the internal management of our business, along with the most directly comparable IFRS financial measures, in evaluating the operating performance. These measures may not be comparable to other similarly titled measures of other companies and are not measurements under IFRS or other generally accepted accounting principles, and you should not consider such items as alternatives to net income (loss), operating income or any other performance measures derived in accordance with IFRS, and they may be different from similarly titled measures used by other companies.
2

AGENDA KEY HEADLINES Alistair McGeorge, Executive Chairman TURNAROUND PLAN Alistair McGeorge FINANCIAL REVIEW Richard Collyer, CFO SUMMARY & OUTLOOK Alistair McGeorge Q&A Alistair McGeorge Richard Collyer
3

KEY HEADLINES
ALISTAIR MCGEORGE Executive Chairman
4

Key Headlines • We have had a difficult year:
• Product focussed on ‘young’ & ‘edgy’ customers • Higher priced offering compromised our reputation for value • Drive for improved margins impacted our speed to market • Chased e-commerce sales at the expense of profitability • Performance impacted by excessive stock clearance and one-offs • UK High street headwinds
• Total sales declined 7.3% to £1,347.8m (FY17: £1,454.7m) • Adjusted EBITDA declined to a loss of £10.7m (FY17: £155.0m) • The first phase of our recovery is to achieve financial and operational stability
• Our turnaround plan is well underway and concentrates on six areas of strategic focus:
• Return to proven broad appeal product • Lower prices delivering better value • Fundamentally realigned supply chain • Symbiotic commercial multichannel model • Efficiency & cost savings • People
• International performance remains disappointing, with the strategic review continuing
5
TURNAROUND PLAN ALISTAIR MCGEORGE Executive Chairman
6

• We’re returning to the compelling proposition of value-led fast
seasonal fashion and wardrobe basics with reduced emphasis on directional fashion
• Thorough review of individual product areas during H2 FY18 (and continuing) led by Roger Wightman and Tom Singh
• We have seen a very positive reaction throughout Q1 on the areas of clothing where we have focussed our initial attention. Improvements to footwear, accessories and denim will happen in Q2/Q3
• Menswear continues to be complementary to our womenswear product in both dual gender stores and online, however we will not progress further standalone stores
Return to proven broad appeal product
7

• Robust revision of our pricing framework to ensure we reclaim our historical reputation for exceptional value:
• Compelling entry prices
• Over 80% of our Spring/Summer range planned to be priced under £20
Lower prices delivering better value
• Focus on full price sales and profitability – ‘first price, right price’
• Stronger messaging in stores and online to convey our great value prices
8

• Collaboration is closer than ever with our suppliers, cementing longstanding key relationships
• Re-established focus on speed to market and regaining our agility
• Overall product options reduced by 15%-20% v. last year
• Tighter management of stock commitment has created greater flexibility, with the opportunity to trade into winning trends more quickly
• We will enter Q2 with no excessive stock. Current stock levels (June) are 10% below last year and targeted to be 15% below last year at end of H1
Fundamentally realigned supply chain
9

Multichannel • Leveraging our store and online presence
• Pricing now aligned between channels • Improved & consistent imagery and value messaging • ‘Click and Collect’ now first in delivery options hierarchy
• ‘Store Stock Look Up’ functionality launched to drive footfall to stores
E-commerce • Focus on full price sales and profitability • Unprofitable delivery options discontinued • Initial anticipated implementation issues with new Hybris platform
being resolved • Up front investment will support long term growth:
• Improved product search functionality • App development reflects the continued trend of mobile
commerce
Stores • Product layout being simplified for customers with product
‘blocking’ and reduced options – further enhancements planned for Q2
• Improved visual merchandising and store standards
Symbiotic commercial multichannel model
10

• Certainty and confidence in significant cost savings
• Approval of Company Voluntary Agreement (CVA) in March 2018addressed the over-rented position of UK estate with estimatedannual cost savings of c.£40m:
• Rent reductions across 393 stores• 60 stores in the UK identified for potential closure (plus further
6 sites sub-let to third parties)• Working capital benefit from rent payments for all stores
moving to monthly in advance
• Additional annual cost savings of £30m already identified and arenow being actioned
• Planned relocation of our London offices to larger space in KingsCross cancelled
• Further cost reduction initiatives being pursued
Efficiency and cost savings 11

People • Structure
• Changes made to senior leadership team
• Stores: • Reduced excessive task load and product double-handling • Re-investment to improve customer service
• Returned to the 5 core values our employees connect with:
• Think Customer • Take Responsibility • Keep it Simple • Act with Pace • Be Brave
• Improved internal communication and engagement with employees • Key focus on retention and reducing vacancy rates
• Targeted training and development
12

FINANCIAL REVIEW
RICHARD COLLYER CFO
13
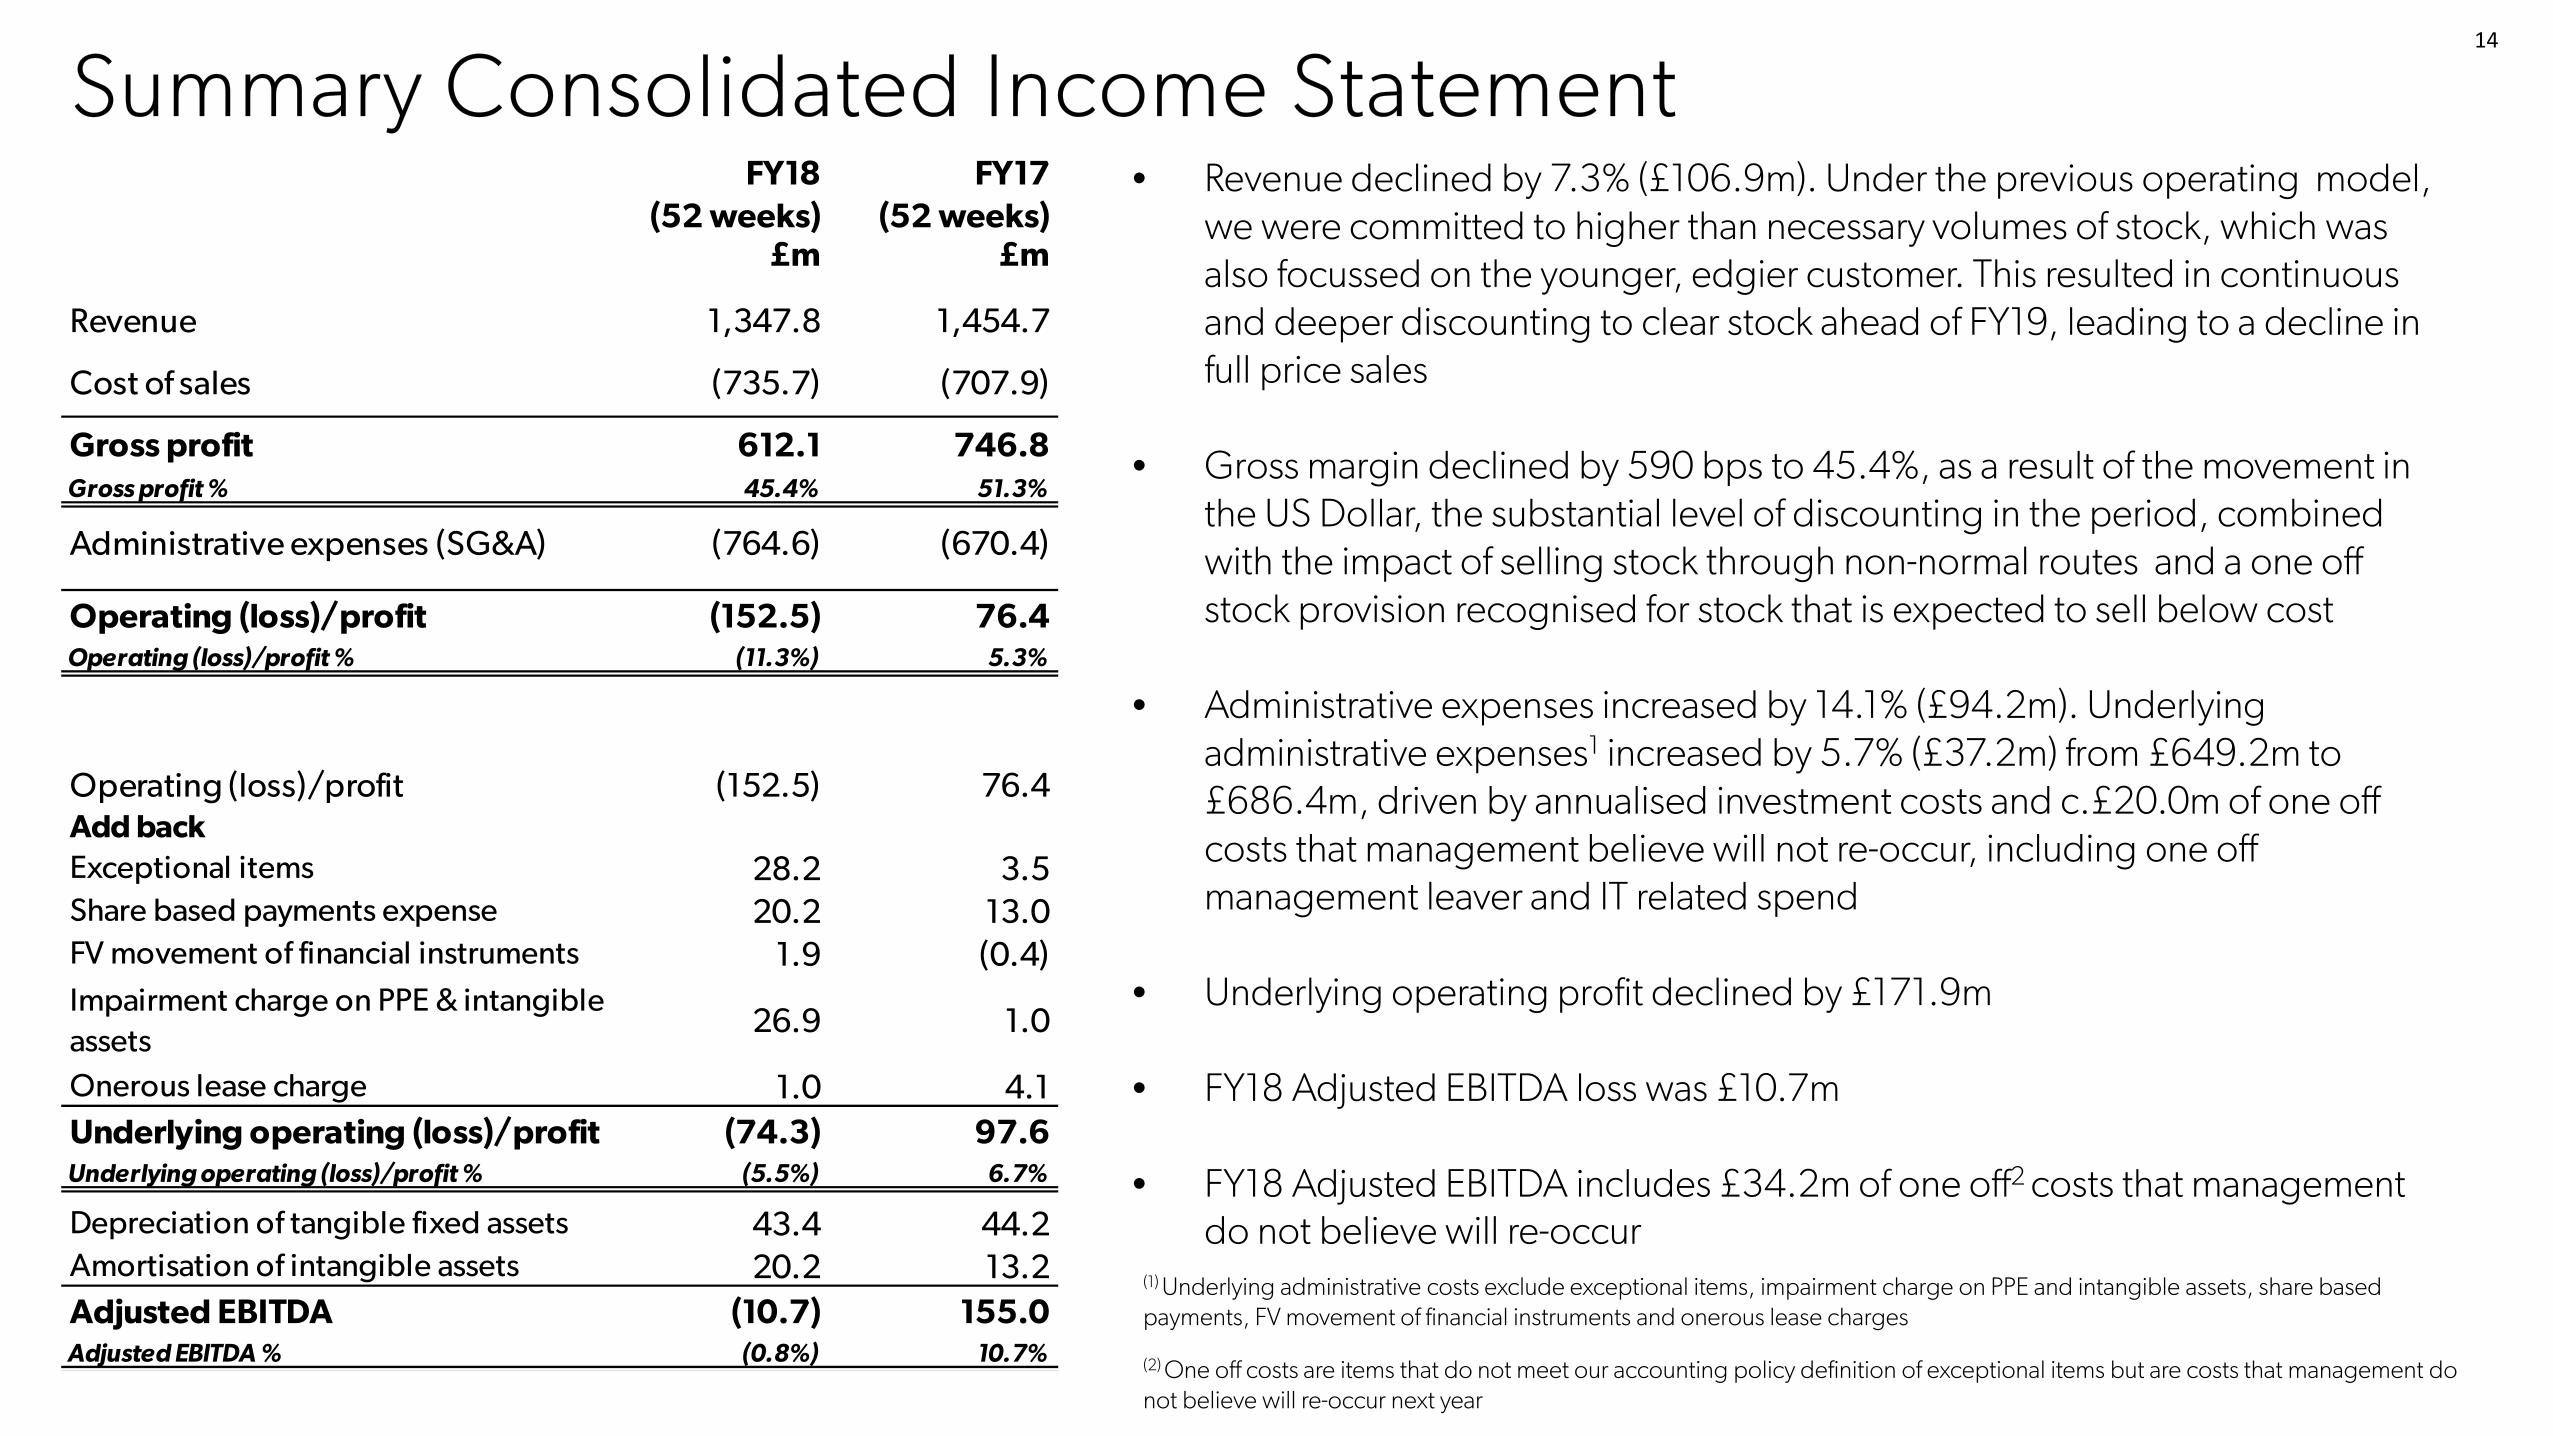
Summary Consolidated Income Statement • Revenue declined by 7.3% (£106.9m). Under the previous operating model,
we were committed to higher than necessary volumes of stock, which was also focussed on the younger, edgier customer. This resulted in continuous and deeper discounting to clear stock ahead of FY19, leading to a decline in full price sales
• Gross margin declined by 590 bps to 45.4%, as a result of the movement in
the US Dollar, the substantial level of discounting in the period, combined with the impact of selling stock through non-normal routes and a one off stock provision recognised for stock that is expected to sell below cost
• Administrative expenses increased by 14.1% (£94.2m). Underlying administrative expenses1 increased by 5.7% (£37.2m) from £649.2m to £686.4m, driven by annualised investment costs and c.£20.0m of one off costs that management believe will not re-occur, including one off management leaver and IT related spend
• Underlying operating profit declined by £171.9m
• FY18 Adjusted EBITDA loss was £10.7m
• FY18 Adjusted EBITDA includes £34.2m of one off2 costs that management do not believe will re-occur
(1) Underlying administrative costs exclude exceptional items, impairment charge on PPE and intangible assets, share based payments, FV movement of financial instruments and onerous lease charges
(2) One off costs are items that do not meet our accounting policy definition of exceptional items but are costs that management do not believe will re-occur next year
14
FY18 (52 weeks)
FY17 (52 weeks)
£m £m
Revenue 1,347.8 1,454.7
Cost of sales (735.7) (707.9)
Gross profit 612.1 746.8Gross profit % 45.4% 51.3%
Administrative expenses (SG&A) (764.6) (670.4)
Operating (loss)/profit (152.5) 76.4Operating (loss)/profit % (11.3%) 5.3%
Operating (loss)/profit (152.5) 76.4Add backExceptional items 28.2 3.5Share based payments expense 20.2 13.0FV movement of financial instruments 1.9 (0.4)Impairment charge on PPE & intangible assets
26.9 1.0
Onerous lease charge 1.0 4.1Underlying operating (loss)/profit (74.3) 97.6Underlying operating (loss)/profit % (5.5%) 6.7%
Depreciation of tangible fixed assets 43.4 44.2Amortisation of intangible assets 20.2 13.2Adjusted EBITDA (10.7) 155.0Adjusted EBITDA % (0.8%) 10.7%

Segmental Performance SALES(1) • UK Retail sales declined by 7.4% (£72.3m) due to significant promotional
and discounting activity, coupled with a decline in footfall • E-commerce (2) sales declined by 19.2% (£44.2m) due to the same
promotional strategy as UK Retail and lower traffic • 3PE sales continued to perform strongly, growing by 15.5% (£9.8m) • International sales declined by 2.7% (£4.8m), challenging trading
conditions across Europe were partially offset by year on year growth in China. In constant currencies, International sales declined by 7.4%
• Franchise sales improved by 11.7% (£3.4m)
UNDERLYING OPERATING PROFIT (UOP)
• UK Retail UOP declined by £139.4m due to the reduced margin from promotional activity and the one off stock provision, annualising of investments and other one off costs
• E-commerce(2) UOP was £11.9m, a decline of 51.6%, driven predominantly by lower sales and gross margin. This was partly offset by volume related savings as we shifted our focus to profitable sales in the second half of the year
• 3PE UOP declined by £2.5m due to an increase in partner discounts
• International UOP declined by £14.3m, primarily driven by challenging market conditions across Europe and investment in China
(1) Sales refers to Gross Transactional Value excluding adjustment to state concession income on a net basis for statutory
reporting purposes (FY18: £17.0m, FY17: £18.2m). (2) Ecommerce Sales and UOP include UK, French, German and RoW E-commerce sales and costs.
15
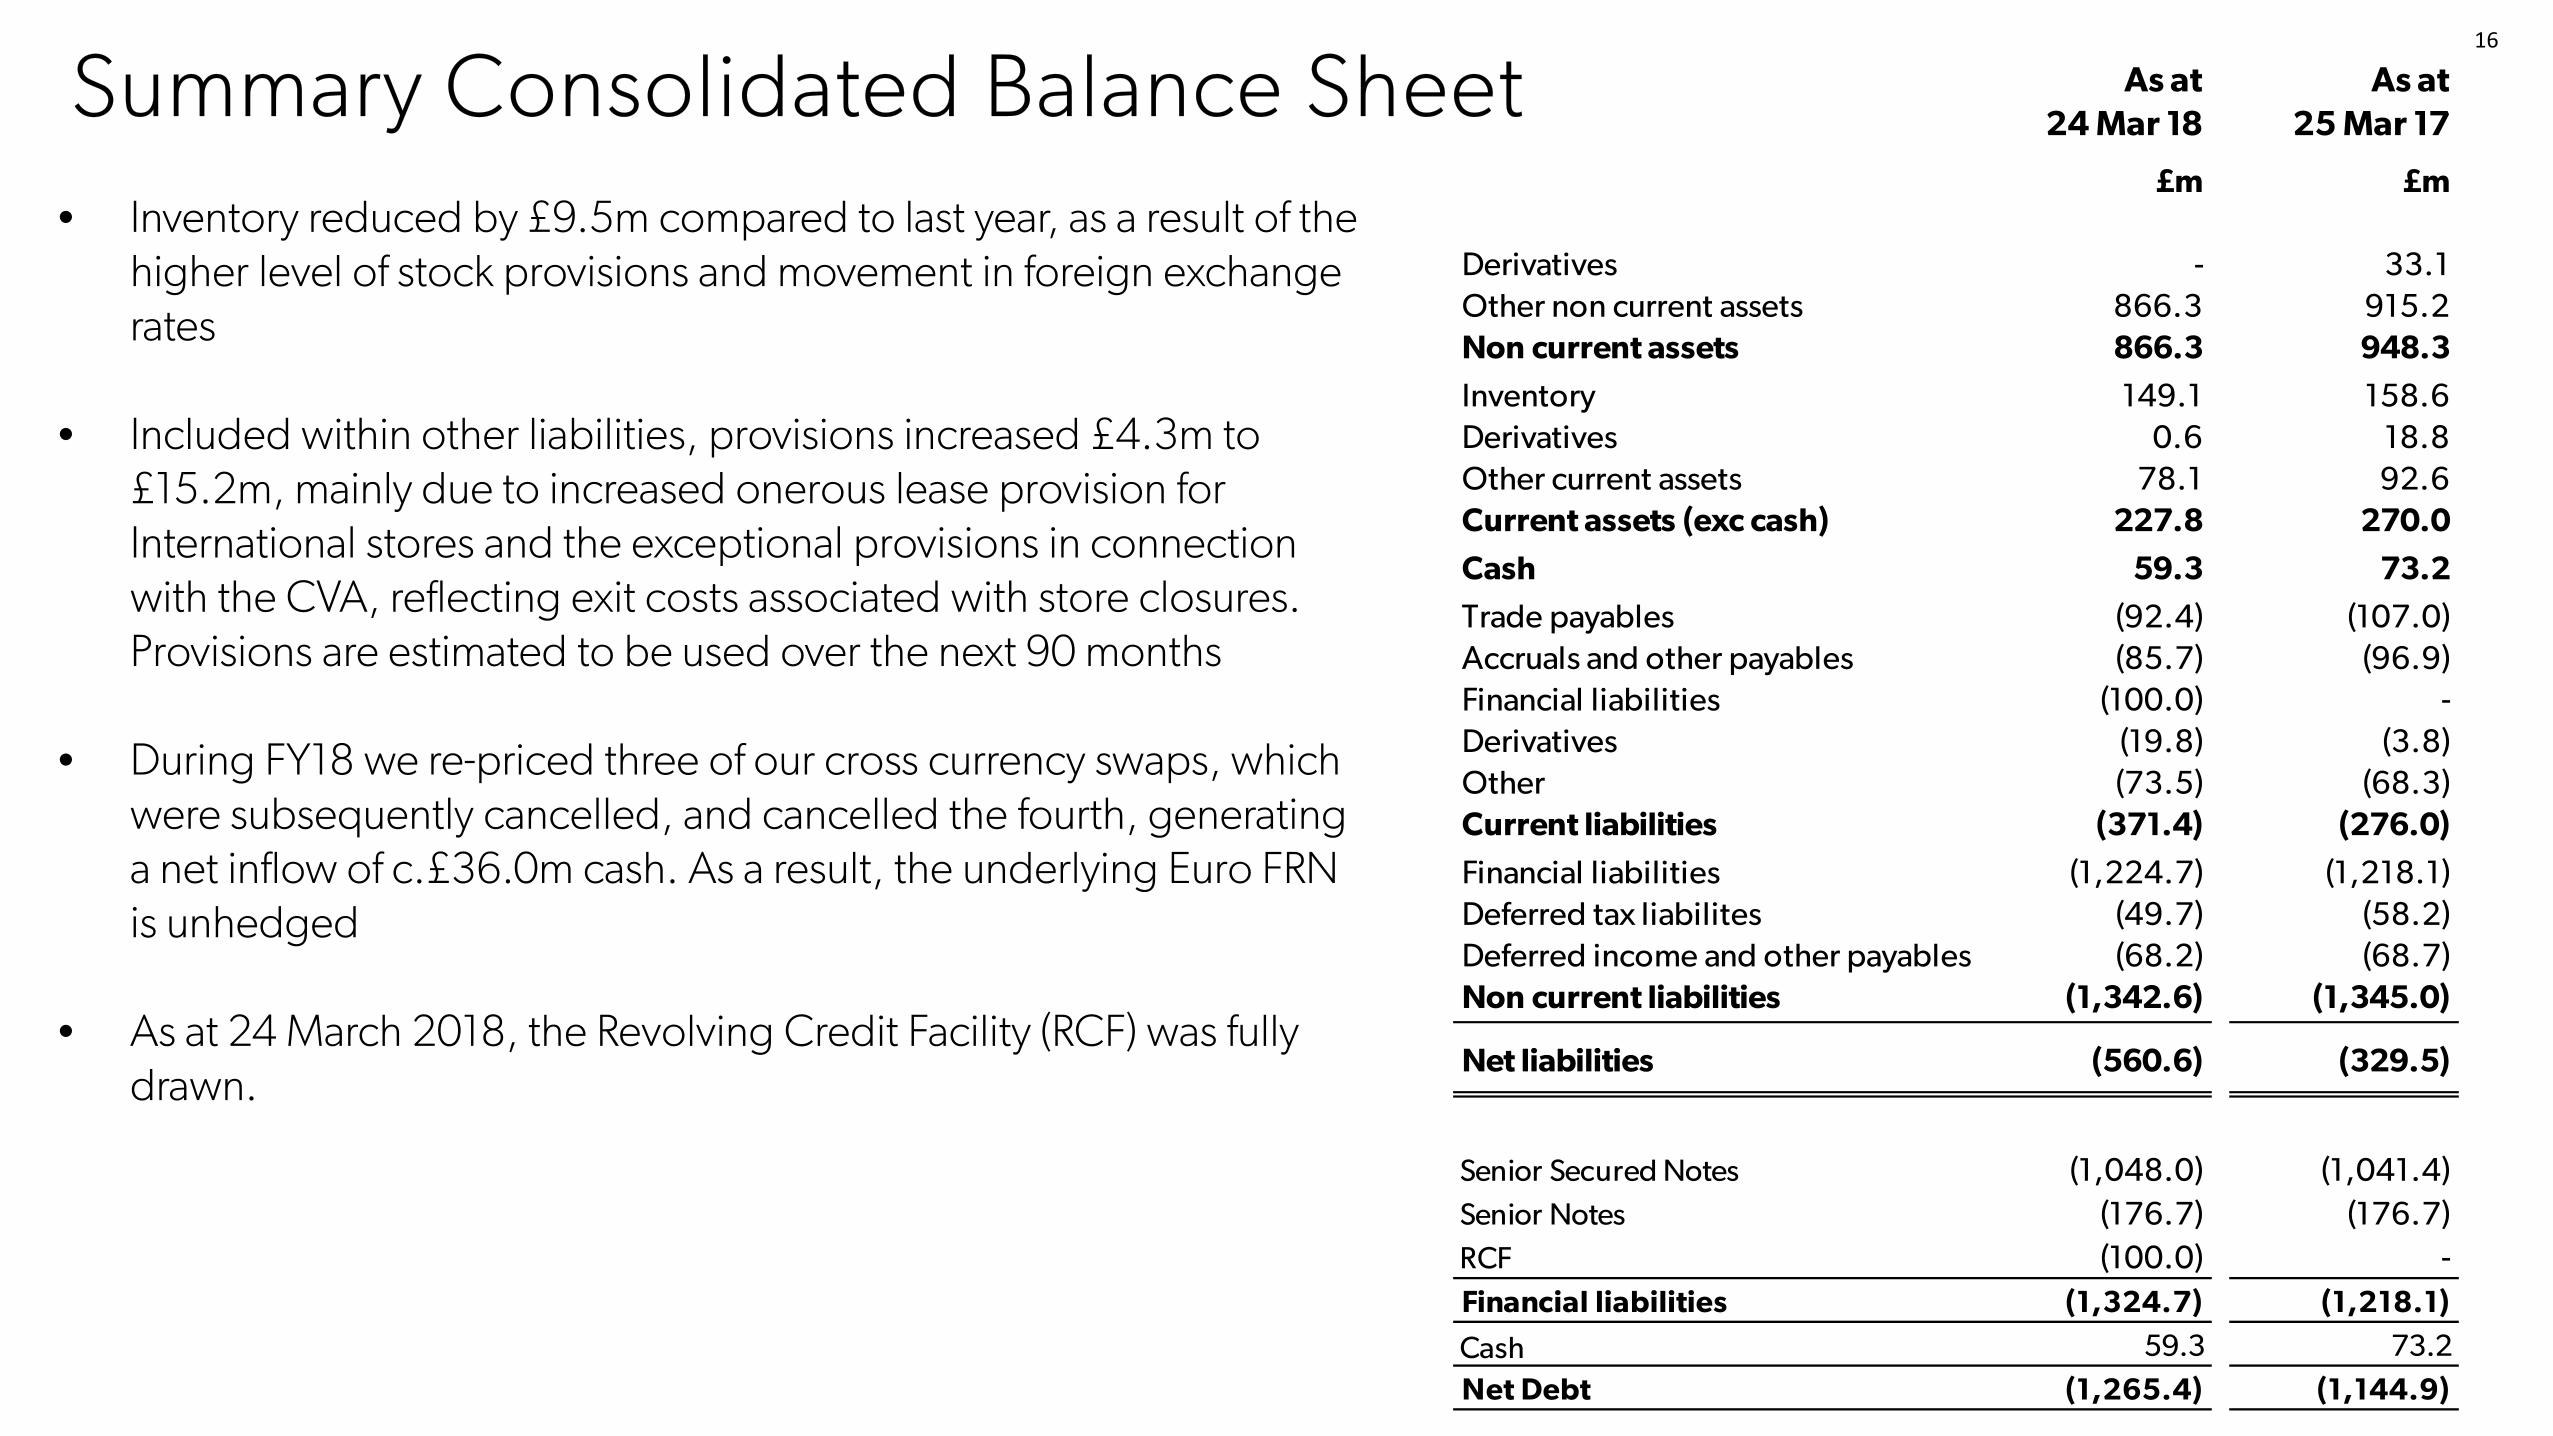
Summary Consolidated Balance Sheet • Inventory reduced by £9.5m compared to last year, as a result of the
higher level of stock provisions and movement in foreign exchange rates
• Included within other liabilities, provisions increased £4.3m to £15.2m, mainly due to increased onerous lease provision for International stores and the exceptional provisions in connection with the CVA, reflecting exit costs associated with store closures. Provisions are estimated to be used over the next 90 months
• During FY18 we re-priced three of our cross currency swaps, which
were subsequently cancelled, and cancelled the fourth, generating a net inflow of c.£36.0m cash. As a result, the underlying Euro FRN is unhedged
• As at 24 March 2018, the Revolving Credit Facility (RCF) was fully drawn.
As at 24 Mar 18
As at 25 Mar 17
£m £m
Derivatives - 33.1Other non current assets 866.3 915.2Non current assets 866.3 948.3
Inventory 149.1 158.6Derivatives 0.6 18.8Other current assets 78.1 92.6Current assets (exc cash) 227.8 270.0
Cash 59.3 73.2-
Trade payables (92.4) (107.0)Accruals and other payables (85.7) (96.9)Financial liabilities (100.0) -Derivatives (19.8) (3.8)Other (73.5) (68.3)Current liabilities (371.4) (276.0)
Financial liabilities (1,224.7) (1,218.1)Deferred tax liabilites (49.7) (58.2)Deferred income and other payables (68.2) (68.7)Non current liabilities (1,342.6) (1,345.0)
Net liabilities (560.6) (329.5)
Senior Secured Notes (1,048.0) (1,041.4)Senior Notes (176.7) (176.7)RCF (100.0) -Financial liabilities (1,324.7) (1,218.1)
Cash 59.3 73.2Net Debt (1,265.4) (1,144.9)
16

Summary Consolidated Cash Flow Statement • Operating profit declined by £228.9m compared to FY17 as
a result of the decline in sales and increase in cost of sales and administrative expenses
• Cash inflows from working capital increased year on year
primarily as a result of the CVA which reduced rents and changed payment terms from quarterly in advance to monthly in advance
• Cash outflows from investing activities decreased year on year as a result of reduced capital investment
• Underlying free cash outflow of £78.3m was £120.8m lower than FY17 as the decline in operating profit was only partially offset by cash inflows from working capital and non cash items
• Cash outflows from financing activities reduced year on year due to the restrike and cancellation of swaps and draw down of the RCF, and the repurchase of Senior Notes in FY17
(2) Free cash flow, a non-IFRS measure, is pre-tax cash flow from operating activities less investing activities (3) Includes cash equivalents and bank overdrafts as at 25 March 2017 and 26 March 2016 respectively
(1) A full reconciliation of working capital cash flows to working capital balance sheet movements is available in the Annual Bond Report
17
FY18 (52 weeks)
FY17 (52 weeks)
£m £m
Operating (loss)/profit (152.5) 76.4
Non cash items 100.1 51.7
Changes in working capital (1):Decrease/(increase) in inventories 9.4 (9.5)
Decrease/(increase) in trade and other receivables 17.0 (6.2)
Decrease in trade and other payables (4.7) (0.1)Net change in working capital 21.7 (15.8)
Other 12.8 5.3
Net cash flow from operating activities (17.9) 117.6
Tax received (8.5) (2.0)
Net cash flow from investing activities (51.9) (73.1)
Free cash flow(2) (78.3) 42.5
Net cash flow from/(used in) financing activities 56.7 (111.9)
Net decrease in cash (13.1) (67.4)
Opening cash(3) 73.2 134.5
Exchange (losses)/gains on cash (0.8) 6.1Closing cash 59.3 73.2

Capital Expenditure Q4 FY18
(52 weeks)Q4 FY17
(52 weeks)£m £m
Total UK 32.6 54.0
New Space 12.8 15.9Refurbishments 2.3 4.1IT Infrastructure 9.0 22.9Logistics 0.3 3.6Retail Infrastructure 8.2 7.5Other - -
E-Commerce 13.4 9.4
Europe 4.0 7.0
China 5.8 3.3
Capital expenditure cash paid 55.8 73.7
(Decrease)/Increase in capital accrual (9.0) 2.0
Capital additions 46.8 75.7
Q4 FY18(52 weeks)
Q4 FY17(52 weeks)
£m £m
Capex paid in the period (55.8) (73.7)
Proceeds from sale of PPE 3.9 0.6
Proceeds from sale of Intangibles - -
(51.9) (73.1)Net cash flow from investing activities
• Capital additions have reduced £28.9m during FY18
• Capital expenditure during FY18 focussed primarily on the UK and E-commerce; • UK new space – opened 10 core stores, 1 mens standalone with 10 store
closures
• UK Store Refurbishment programme paused during Q3 to preserve cash
• IT Infrastructure - Completion of our ATLAS Retail Stock Management program during FY18
• Logistics - E-commerce expansion project completed in FY17 with only small projects in FY18
• E-commerce - New platform launched in FY18 as well as continuous investment to keep pace with the continually evolving market
• Europe - 3 new stores in FY18 (FY17: 4) and investment in upgrading the EPOS (tills) system in FY17
• China - 52 stores opened in FY18 (FY17: 40)
18

Liquidity and Operating Facilities
• Total Liquidity and Operating facilities £200.0m • £100.0m RCF (fully drawn) • £100.0m Operating Trade and Import Facilities and
Overdraft
• Impact of withdrawal of supplier credit insurance has been successfully managed to date
• As at 9 June 2018 we had c.£103m of Cash, Liquidity and Operating facilities available
19
FY18 (52 weeks)
FY17 (52 weeks)
£m £m
Cash, cash equivalents and bank overdrafts1 59.3 73.2
Available liquidity facilitiesOverdraft facility 15.0 5.0 Revolving Credit Facility2 - 100.0 Available liquidity facilities 15.0 105.0
Total available cash and liquidity facilities 74.3 178.2
Available Operating (Trade and Import) facilities3FY18
(52 weeks)FY17
(52 weeks)
£m £mOperating (Trade and Import) facilities - Total 85.0 73.0 Operating (Trade and Import) facilities - (Drawn) (76.9) (24.9)Available Operating (Trade and Import) facilities 8.1 48.1
Total cash, liquidity and operating facilities 82.4 226.3
1 Includes restricted cash, which can only be utilised for the benefits of the employees and guarantees held for leases in mainland Europe. It also includes cash in transit.
3 Multi-currency Revolving Credit Facility (RCF), Import Facility and overdraft are available to the Borrower for financing working capital or general corporate purposes and for the issuance of advance payment to eligible suppliers.The facility terminates on 31 January 2019 and interest is charged at Libor/Euribor + margin of 1.00 to 1.75%
2 The RCF termination date is 25 June 2021.

Underlying Earnings Contributors
• Management is confident in our ability to deliver on the turnaround plan from FY19
• This confidence is underpinned by several key measures we have identified and actioned:
• £34m of one-off items in FY18 EBITDA that management does not believe will re-occur
• Approximately £40m of savings flowing from the CVA approved in March 2018
• Other identified and in-progress cost saving initiatives amounting to £30m annual savings
• £7m of EBITDA improvement from the annualisation of FY18 store openings and new FY19 openings
• Strong certainty that these initiatives are deliverable before adding benefit from improvements in trading performance
20
34.0
40.0
30.0 7.0
(10.7)
100.3
FY18 Adjusted EBITDA
One off costs CVA Cost savings Annualised store openings

SUMMARY & OUTLOOK
ALISTAIR MCGEORGE Executive Chairman
21

Summary & Outlook • Significant progress has been made to achieving financial and
operational stability
• Turnaround plan well under way
• Considerably improved stock position to start the new financial year – and will be clean into Q2
• Certainty and confidence in cost savings already delivered with further opportunities
• Q1 performance showing clear positive signs
• Retail environment clearly still tough
• Liquidity continues to improve
• We strongly believe in the fundamental strength and appeal of our brand – we are still No. 1 in our core age 18-35 target UK Womenswear market*
*Measured by KantarWorldPanel published data 52 weeks ended 11 March 2018 (Womenswear by value.)
22

Q&A
ALISTAIR McGEORGE Executive Chairman
RICHARD COLLYER
CFO
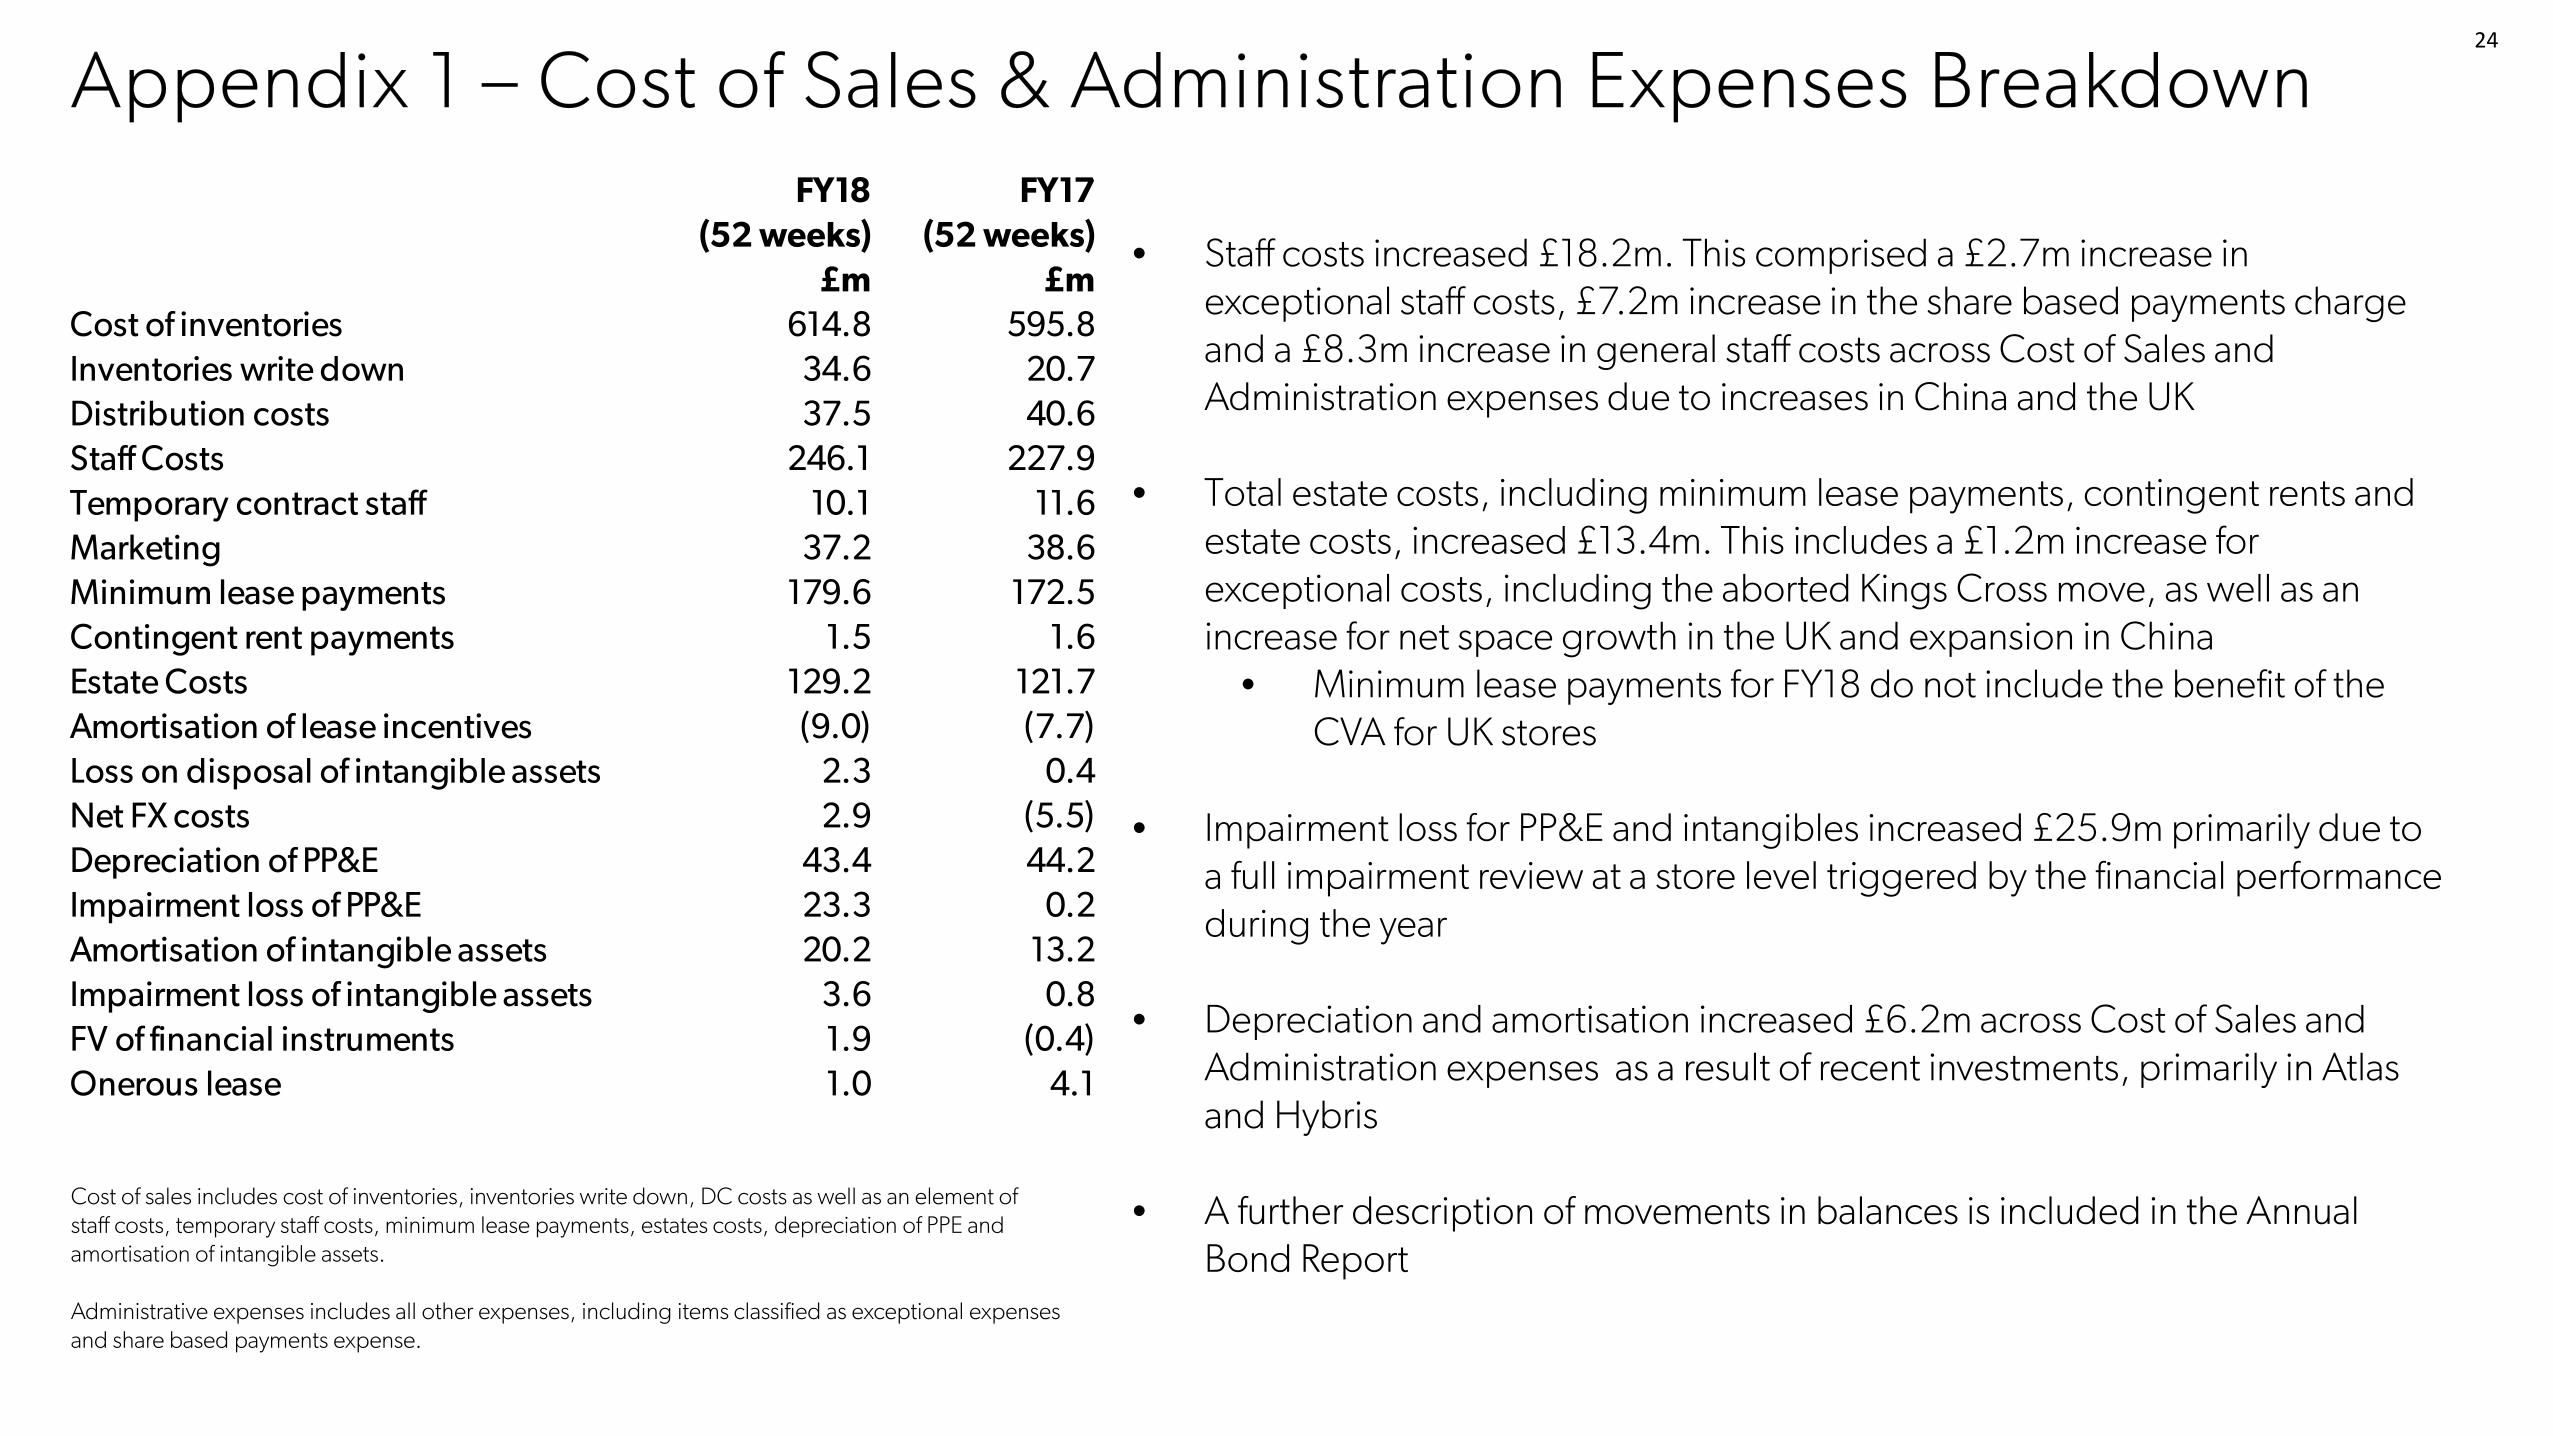
Appendix 1 – Cost of Sales & Administration Expenses Breakdown
Cost of sales includes cost of inventories, inventories write down, DC costs as well as an element of staff costs, temporary staff costs, minimum lease payments, estates costs, depreciation of PPE and amortisation of intangible assets. Administrative expenses includes all other expenses, including items classified as exceptional expenses and share based payments expense.
• Staff costs increased £18.2m. This comprised a £2.7m increase in exceptional staff costs, £7.2m increase in the share based payments charge and a £8.3m increase in general staff costs across Cost of Sales and Administration expenses due to increases in China and the UK
• Total estate costs, including minimum lease payments, contingent rents and estate costs, increased £13.4m. This includes a £1.2m increase for exceptional costs, including the aborted Kings Cross move, as well as an increase for net space growth in the UK and expansion in China
• Minimum lease payments for FY18 do not include the benefit of the CVA for UK stores
• Impairment loss for PP&E and intangibles increased £25.9m primarily due to
a full impairment review at a store level triggered by the financial performance during the year
• Depreciation and amortisation increased £6.2m across Cost of Sales and Administration expenses as a result of recent investments, primarily in Atlas and Hybris
• A further description of movements in balances is included in the Annual Bond Report
24
FY18 (52 weeks)
FY17 (52 weeks)
£m £mCost of inventories 614.8 595.8Inventories write down 34.6 20.7Distribution costs 37.5 40.6Staff Costs 246.1 227.9Temporary contract staff 10.1 11.6Marketing 37.2 38.6Minimum lease payments 179.6 172.5Contingent rent payments 1.5 1.6Estate Costs 129.2 121.7Amortisation of lease incentives (9.0) (7.7)Loss on disposal of intangible assets 2.3 0.4Net FX costs 2.9 (5.5)Depreciation of PP&E 43.4 44.2Impairment loss of PP&E 23.3 0.2Amortisation of intangible assets 20.2 13.2Impairment loss of intangible assets 3.6 0.8FV of financial instruments 1.9 (0.4)Onerous lease 1.0 4.1