Investor Presentation Full year 2009 Resultsfiles.shareholder.com/downloads/ABEA-5ASMJV... ·...
25
Investor Presentation Full year 2009 Results 11 March 2010
Transcript of Investor Presentation Full year 2009 Resultsfiles.shareholder.com/downloads/ABEA-5ASMJV... ·...

Investor Presentation Full year 2009 Results
11 March 2010

2
Forward-looking Statements
Forward-looking statementsThis presentation may contain forward-looking statements. Statements herein, other than statements of historical fact, regarding future events or prospects, are forward-looking statements. The words ‘‘may’’, “will”, “should”, ‘‘expect’’, ‘‘anticipate’’, ‘‘believe’’, ‘‘estimate’’, ‘‘plan’’, "predict," ‘‘intend’ or variations of these words, as well as other statements regarding matters that are not historical fact or regarding future events or prospects, constitute forward-looking statements. ISS has based these forward-looking statements on its current views with respect to future events and financial performance. These views involve a number of risks and uncertainties, which could cause actual results to differ materially from those predicted in the forward-looking statements and from the past performance of ISS. Although ISS believes that the estimates and projections reflected in the forward-looking statements are reasonable, they may prove materially incorrect, and actual results may materially differ, e.g. as the result of risks related to the facility service industry in general or ISS in particular including those described in the annual report 2009 of ISS Holding A/S and other information made available by ISS.
As a result, you should not rely on these forward-looking statements. ISS undertakes no obligation to update or revise any forward-looking statements, whether as a result of new information, future events or otherwise, except to the extent required by law.
The Annual Report 2009 of ISS Holding A/S is available from the Group’s website, www.issworld.com.

3
Agenda
Senior Appointment
Key Events
Interim Report
Capital Structure
Outlook

Key Events

5
Senior Appointment
CEO Jørgen Lindegaard will at the end of March 2010 step down after almost 4 years as CEO for the ISS Group. Jørgen Lindegaard will subsequently join the Board of Directors.
COO Jeff Gravenhorst will succeed Jørgen Lindegaard as CEO for the ISS Group.
Jeff Gravenhorst Group COO (Joined 2002)
Previous positions:ISS Group CFOISS UK, CFOALTO Danmark, Managing Director of the European DivisionALTO U.S., Vice PresidentClarke Industries, CFOWittenborg UK, Finance DirectorArthur Andersen, Manager
Jørgen Lindegaard Group CEO (Joined 2006)
Previous positions:SAS, CEOTelenor, Board memberGN Great Nordic, CEOKTAS, CEO

6
Key Events 2009
Solid financial performance in bleak macro economic environment
Focus on operational priorities sustained
1. Cash Flow 2. Operating Margin 3. Organic Growth
Cash conversion of 96%
Debtor Days improved year-on-year by more than 1 day
Nordic, Asia/Pacific and Latin America - increased margins
Eastern Europe hit by severe macro economic downturn
Parts of Western Europe impacted by slowdown in automotive and manufacturing industries as well as a decrease in non-portfolio business
North America – impacted by economic slowdown, especially affecting non-portfolio business
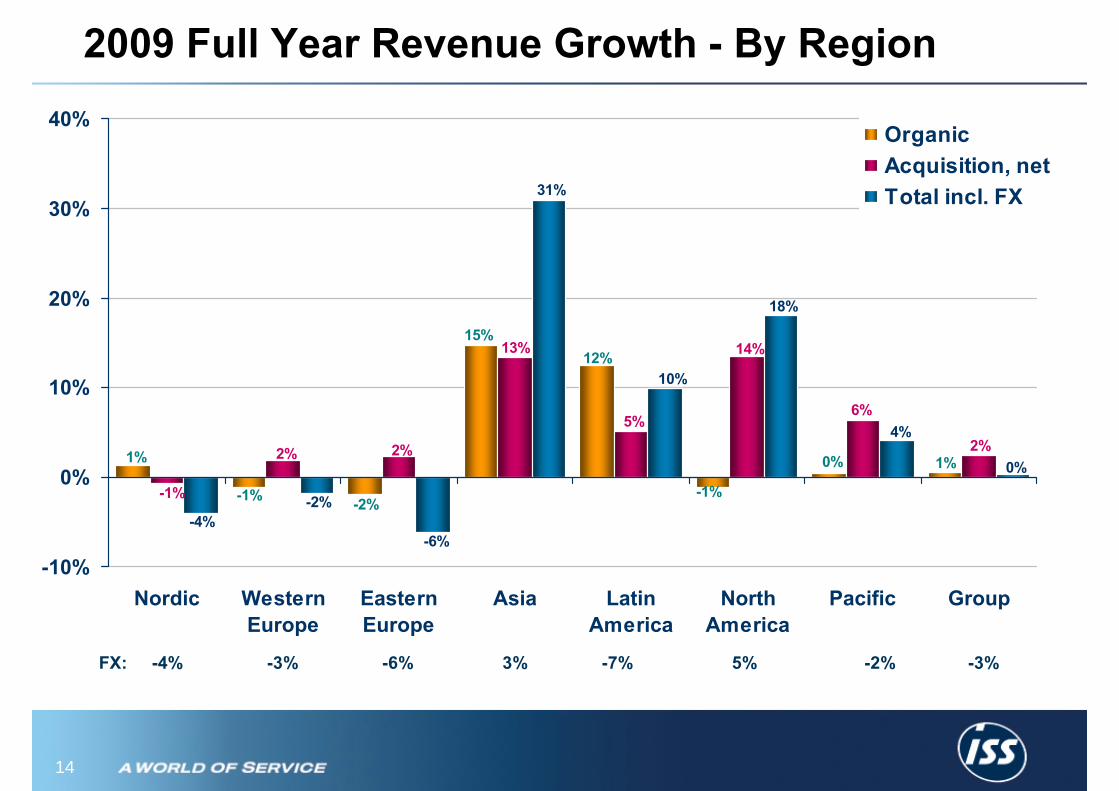
4 of 7 regions achieved positive organic growth in 2009, with Asia and Latin America delivering double-digit organic growth.
Contract portfolio growth continues, new international contract wins in 2009
Demand for non-portfolio additional work significantly down in current environment
Some projects cancelled or postponed (e.g. in landscaping)

7
Key Events 2009 (cont.)
Adjustment of cost baseRestructuring projects to adapt capacity in Western Europe to current demand
The initiative to reduce fixed costs globally delivered good results in 2009
Refinancing of 2010 EMTNs (EUR 850 million)Issuance of EUR 525 million Senior Notes successfully completed in July
Securitisation of trade receivables is progressing as planned
Tender offer for EUR 150 million of outstanding 2010 EMTNs completed in January 2010

8
Key Events 2009 (cont.)
Implementation of The ISS Way strategy continues
Deep deployment of the ISS Value Chain in the current regional/country strategy process
Strategic approach to portfolio decisionsAcquisitions, divestments, organic growth targets
Restructurings in key Western European countries
Continued expansion of International IFS contracts

Annual Results 2009

10
9610399102
0
20
40
60
80
100
120
2006 2007 2008 2009
Key Operational Priorities - Sustained
5.9%
5.6%
5.8%6.0%
0.0%
2.0%
4.0%
6.0%
8.0%
2006 2007 2008 2009
0.6%
5.3%6.0%5.5%
0%
2%
4%
6%
8%
10%
2006 2007 2008 2009
Priority 1: LTM Cash Conversion (%)1 Priority 2: Operating Margin (% revenue)
Priority 3: Organic Growth (%)
1 Cash conversion is defined as operating profit before other items plus Changes in working capital as a percentage of operating profit before other items
Operational PerformanceSolid cash conversion of 96% LTM December3% top line growth at constant exchange ratesOrganic growth of 0.6%Operating margin at 5.6%

11
2009 Full Year Key Figures
DKKm 2009 2008 Δ FX C*)
Revenue 69,004 68,829 +0% -3% +3%
Operating profitbefore other items 3,874 4,061 -5% -3% -2%
Operating marginbefore other items 5.6% 5.9%
Operating profit 3,277 3,753 -13% -2% -11%
Organic growth 0.6% 5.3%
*) C: Growth at constant exchange rates

12
6.0%
4.3%
6.5%
5.7%
6.0%6.1%
4.7%
6.5%
6.0%
6.3%
4%
5%
6%
7%
Q4-08 Q1-09 Q2-09 Q3-09 Q4-09 Q2-YTD Q3-YTD Q4-YTD
Current yearPrevious year
Restoring profitability - Operating Margin before Other Items
36bp
52bp
Year to date
29bp

13
5.3%
6.3%6.8%
5.6%
6.9%7.5%
5.3%
7.4%
5.9%
7.4%
6.4%5.8%
6.7%6.0% 6.0%
7.0%
0%
2%
4%
6%
8%
10%
Nordic WesternEurope
EasternEurope
Asia LatinAmerica
NorthAmerica
Pacific Group
2009 2008
Full Year Operating Margin - By Region Operating Profit before Other Items
% of 2009 Full year Revenue YTD
24% 56% 2% 6% 3% 4% 5%
14
15%12%
-1%
0%
-2%
1%
-1%
1%
6%5%
14%
-1%
13%
2% 2% 2%4%
10%
31%
-6%
-2%-4%
18%
0%
-10%
0%
10%
20%
30%
40%
Nordic WesternEurope
EasternEurope
Asia LatinAmerica
NorthAmerica
Pacific Group
OrganicAcquisition, netTotal incl. FX
2009 Full Year Revenue Growth - By Region
FX: -4% -3% -6% 3% -7% 5% -2% -3%

15
Full year 2009 – Acquisitions and Divestments
Acquisitions
Strategic decision to slow-down acquisitions
22 acquisitions completed until 31 December 2009
Average multiple: 5.8x EBITA
Average revenue: DKK 45m
Average revenue bolt-ons: DKK 20m
One acquisition completed in Q4
Divestments
Activities which are either non-core or lack critical mass have been evaluated
Eight divestments completed in 2009 and certain activities held for sale
9.7x
8.0x
9.5x
7.2x
9.9x
8.3x 7.9x 7.6x
5.8x7.5x 7.2x8.3x
5.8x
7.8x
7.2x6.8x7.3x
8.6x
6.5x 6.2x
0
1,000
2,000
3,000
4,000
5,000
6,000
7,000
8,000
9,000
2000 2001 2002 2003 2004 2005 2006 2007 2008 2009
(DK
K m
illion
)
0
2
4
6
8
10
12
14
Revenue acquired (lhs) All acquisitions Price/EBITABolt-On acquisitions Price / EBITA
Average EV/EBITA acquisition multiples

16
Debt Service Capacity (LTM)
1,855
3,732
4,495
4,1994,3014,334
3,990
3,853
3,594
636928 952 991 940
210
2,5032,458
2,304 2,2672,176 2,172 2,103 2,205
694
2,586
1,7781,839 1,823
2,0211,472
1,180 892
517 695 720
64
0
1,000
2,000
3,000
4,000
5,000
6,000
Q1 2008 Q2 2008 Q3 2008 Q4 2008 Q1 2009 Q2 2009 Q3 2009 Q4 2009 Q4 2009(QTD)
(DK
K m
illion
)
0
1,000
2,000
3,000
4,000
5,000
6,000
Cash Flow from Operations Capex Interest Paid Acquisitions, net
Quarterlyfigures
Capital Structure

18
Pro Forma Adjusted EBITDA
Pro Forma calculation(1)
DKKm 12 months ended 31 December, 2009
Adjusted EBITDA 4,742
Estimated PF adjusted EBITDA ofacquired and divested businesses 31
Estimated PF Adjusted EBITDA 4,773
Capital Structure
Note: (1) The calculations of pro forma adjusted EBITDA are based in part on management estimates and the unaudited internal management accounts of the acquired businesses. These numbers have not been, and cannot be, audited. The Pro Forma EBITDA is based on “Last Twelve Months” figures.

19
Capital Structure (cont.)
Notes: (1) This Capitalisation table reflects the table of Net Debt in the section Capital Structure of ISS Holding A/S Annual Report 2009.(2) Converted to DKK as per exchange rate of 31 December, 2009.
Pro Forma Capital Structure – 31 December, 2009
Capitalisation (1) DKKm (2) % of TotalCash and securities (3,461) (11%)Other Indebtedness 368 1%Senior Facilities 18,241 58%EMTNs 3,426 11%Senior Notes 3,907 13%Total Net Senior Debt 22,481 72%Second Lien 4,465 14%Senior Subordinated Notes 3,378 11%Securitisation 937 3%Total Net Debt 31,261 100%

20
Total Net Debt 31,261
PF Adjusted EBITDA 4,773
PF Net Debt / PF EBITDA 6.55x
Pro Forma Credit Ratio
CAPITALISATION (DKKm) 2009

21
Pro Forma Credit Ratios Q4 2009
Pro Forma Credit Ratios
PF Net Senior Debt (excl. EMTNs & Senior Notes) / PF EBITDA
PF Net Debt / PF EBITDA
PF Net Senior Debt (incl. EMTNs & Senior Notes) / PF EBITDA
6.55x
4.63x
3.10x

22
Maturity Of Credit Facilities
0
2,000
4,000
6,000
8,000
10,000
12,000
14,000
16,000
2010 2011 2012 2013 2014 2015 2016
DK
K m
illio
ns
Senior EMTNs Senior Notes Second Lien High Yield Securitisation
22
*
*) Rolling programme with 3 year back stop facility

Outlook

24
OutlookThe outlook set out below should be read in conjunction with ”Forward-looking statements” on page 2 of this presentation
The Group will continue focusing onKey operational objectives
(i) cash flow, (ii) operating margin and (iii) profitable organic growth
Implementation of “The ISS Way” – the strategy planBroadening facility services and strengthening single service excellenceContinued development of value propositions to specific customer segments Refinancing of the remaining 2010 EMTN’s
Outlook(1)
Organic revenue growth is expected to steadily increase during 2010The operating margin is expected to be slightly higher compared with 2009ISS will focus on managing the absolute level of debt supported by significantly less acquisition spend and a continued high cash conversion
(1) See the Outlook section on page 8 in the interim report

Investor Presentation - Full year 2009 Results -
11 March 2010