Investor Presentation - First Resources · 6 Upstream Agri-Business Focus Active Cost Containment...
23
First Resources Limited Delivering Growth and Returns Investor Presentation Nov 2015
Transcript of Investor Presentation - First Resources · 6 Upstream Agri-Business Focus Active Cost Containment...

First Resources Limited
Delivering Growth and Returns
Investor Presentation Nov 2015

2
Table of Contents
Group Overview 3
9M/3Q2015 Financial Performance 8
9M/3Q2015 Operational Performance 14
Group Updates 19

Group Overview
4
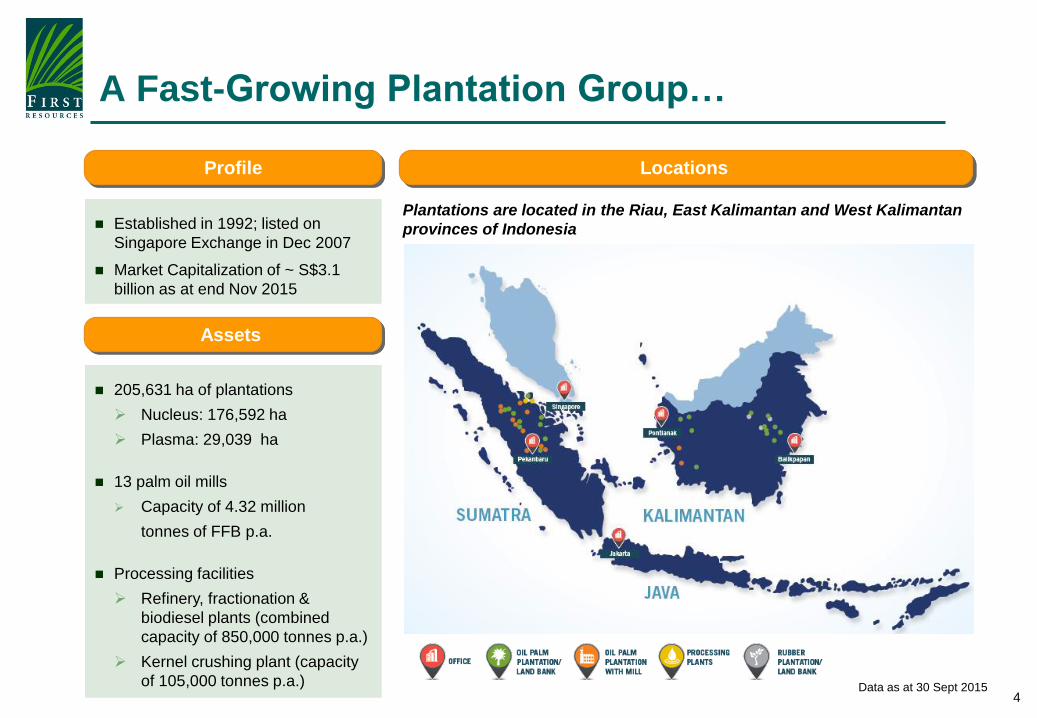
A Fast-Growing Plantation Group…
205,631 ha of plantations
Nucleus: 176,592 ha
Plasma: 29,039 ha
13 palm oil mills
Capacity of 4.32 million
tonnes of FFB p.a.
Processing facilities
Refinery, fractionation &
biodiesel plants (combined
capacity of 850,000 tonnes p.a.)
Kernel crushing plant (capacity
of 105,000 tonnes p.a.)
Plantations are located in the Riau, East Kalimantan and West Kalimantan
provinces of Indonesia
Locations
Assets
Profile
Established in 1992; listed on
Singapore Exchange in Dec 2007
Market Capitalization of ~ S$3.1
billion as at end Nov 2015
Data as at 30 Sept 2015

5
With a Strong Growth Profile
Strong growth expected from existing plantation assets due to young age profile
FFB Yield vs. Tree Age
(tonnes/ha)
Expected Growth from Existing Asset Base
CPO Production
(‘000 tonnes)
Estimated production potential based on
current planted hectarage
Prime Production from 8th – 17th year
Data as at 30 Sept 2015
Young Plantation Profile

6
Upstream Agri-
Business Focus
Active Cost
Containment
Responsible
Cultivation
Maintain our low-cost structure through best-in-class operational
efficiency and stringent cost management
To achieve superior margins and greater resilience to price cycles by
being at the low end of the industry cost curve
Continuously strengthen our multi-faceted sustainability policy across
the Group’s entire operations
To maximise market access through sustainable palm oil production
Growth Strategy: Building on our Core Expertise
Develop and maintain high-quality plantation assets, and ensure
optimal milling capacity in line with FFB production growth
To achieve sustainable production growth

7
A Leading Plantation Group with Integrated
Operations Throughout the Value Chain
Plantations Milling Processing
Fresh Fruit Bunches RBDPO
PFAD
RBD Olein
RBD Stearin
Biodiesel
Crude
Glycerine
PKE
PKO
Crude Palm Oil
Palm Kernel
Ac
tivit
y
As
se
ts
Pro
du
cts
205,631 ha of plantations
• Nucleus : 176,592 ha
• Plasma : 29,039 ha
13 CPO mills
Capacity of 4.32 million tonnes
of FFB p.a.
Refinery, fractionation &
biodiesel plants (with combined
capacity of 850,000 tonnes p.a.)
Kernel crushing plant (capacity
of 105,000 tonnes p.a.)
Note: Data as at 30 Sept 2015
9M/3Q2015 Financial Performance
9
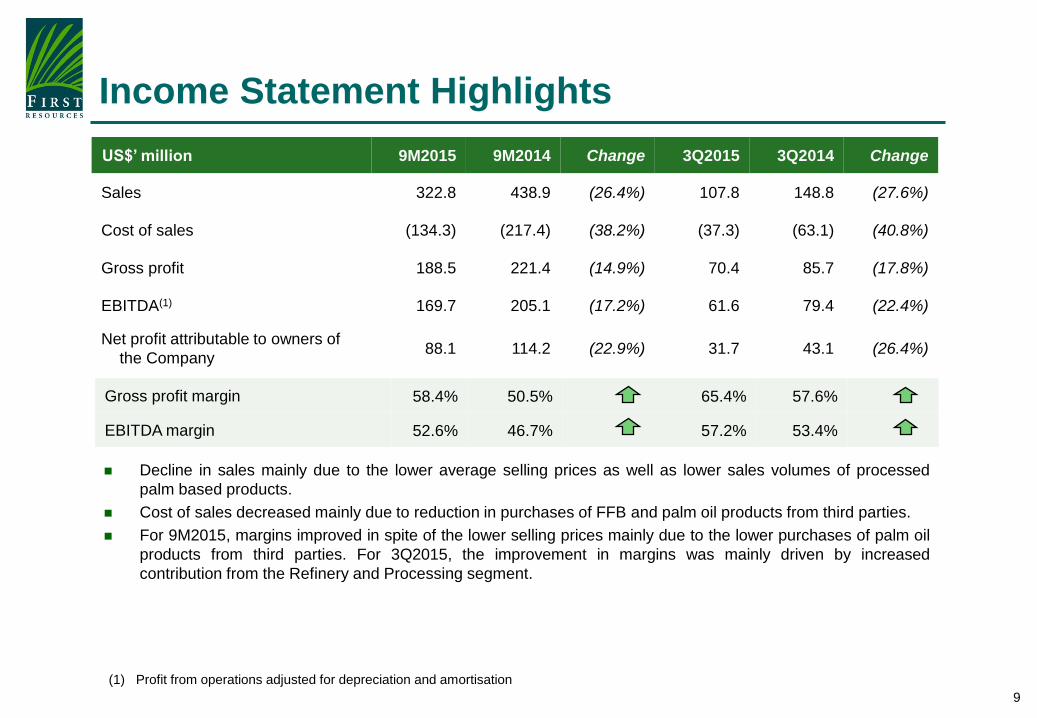
Income Statement Highlights
US$’ million 9M2015 9M2014 Change 3Q2015 3Q2014 Change
Sales 322.8 438.9 (26.4%) 107.8 148.8 (27.6%)
Cost of sales (134.3) (217.4) (38.2%) (37.3) (63.1) (40.8%)
Gross profit 188.5 221.4 (14.9%) 70.4 85.7 (17.8%)
EBITDA(1) 169.7 205.1 (17.2%) 61.6 79.4 (22.4%)
Net profit attributable to owners of
the Company 88.1 114.2 (22.9%) 31.7 43.1 (26.4%)
(1) Profit from operations adjusted for depreciation and amortisation
Gross profit margin 58.4% 50.5% 65.4% 57.6%
EBITDA margin 52.6% 46.7% 57.2% 53.4%
Decline in sales mainly due to the lower average selling prices as well as lower sales volumes of processed
palm based products.
Cost of sales decreased mainly due to reduction in purchases of FFB and palm oil products from third parties.
For 9M2015, margins improved in spite of the lower selling prices mainly due to the lower purchases of palm oil
products from third parties. For 3Q2015, the improvement in margins was mainly driven by increased
contribution from the Refinery and Processing segment.
10
Segmental Results
(1) Inter-segment elimination of EBITDA relates to the elimination of unrealised profit on inter-segment sales
US$’ million 9M2015 9M2014 Change 3Q2015 3Q2014 Change
Sales
Plantations and Palm Oil Mills 319.6 385.1 (17.0%) 93.3 140.6 (33.6%)
• Crude Palm Oil 275.1 336.8 (18.3%) 81.1 121.8 (33.4%)
• Palm Kernel 39.7 44.4 (10.6%) 11.0 17.1 (35.8%)
• Fresh Fruit Bunches 4.9 3.9 25.5% 1.2 1.7 (29.2%)
Refinery and Processing 184.1 305.8 (39.8%) 84.0 131.4 (36.1%)
Inter-segment elimination (180.9) (252.0) (28.2%) (69.6) (123.2) (43.5%)
322.8 438.9 (26.4%) 107.8 148.8 (27.6%)
EBITDA
Plantations and Palm Oil Mills 163.2 188.7 (13.5%) 51.3 79.9 (35.8%)
Refinery and Processing 16.6 27.5 (39.4%) 14.4 9.1 58.6%
Inter-segment elimination(1) (10.1) (11.1) (8.5%) (4.1) (9.6) (57.5%)
169.7 205.1 (17.2%) 61.6 79.4 (22.4%)
11
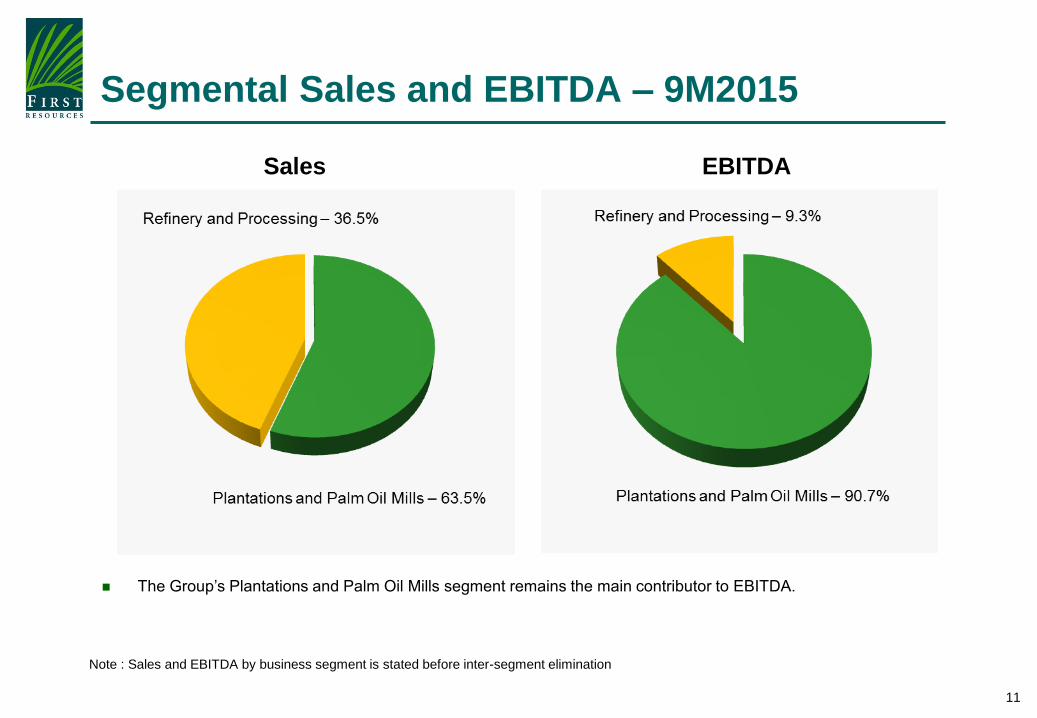
Segmental Sales and EBITDA – 9M2015
Sales EBITDA
Note : Sales and EBITDA by business segment is stated before inter-segment elimination
The Group’s Plantations and Palm Oil Mills segment remains the main contributor to EBITDA.
12
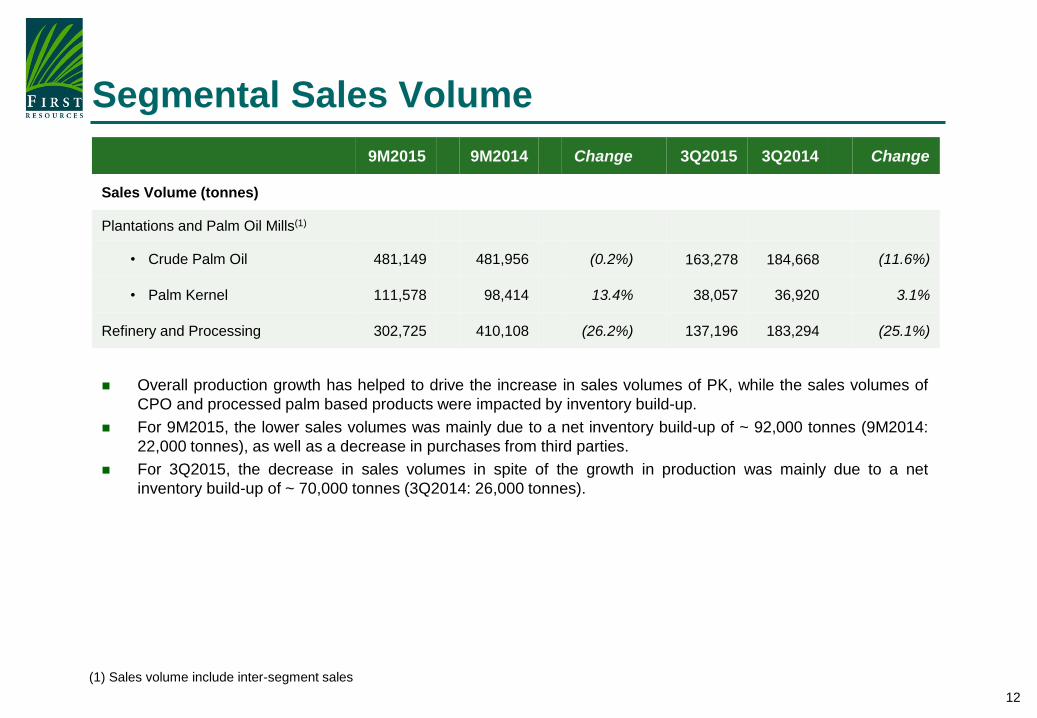
9M2015 9M2014 Change 3Q2015 3Q2014 Change
Sales Volume (tonnes)
Plantations and Palm Oil Mills(1)
• Crude Palm Oil 481,149 481,956 (0.2%) 163,278 184,668 (11.6%)
• Palm Kernel 111,578 98,414 13.4% 38,057 36,920 3.1%
Refinery and Processing 302,725 410,108 (26.2%) 137,196 183,294 (25.1%)
(1) Sales volume include inter-segment sales
Segmental Sales Volume
Overall production growth has helped to drive the increase in sales volumes of PK, while the sales volumes of
CPO and processed palm based products were impacted by inventory build-up.
For 9M2015, the lower sales volumes was mainly due to a net inventory build-up of ~ 92,000 tonnes (9M2014:
22,000 tonnes), as well as a decrease in purchases from third parties.
For 3Q2015, the decrease in sales volumes in spite of the growth in production was mainly due to a net
inventory build-up of ~ 70,000 tonnes (3Q2014: 26,000 tonnes).

13
Balance Sheet Highlights
US$’ million 30 Sept 2015 31 Dec 2014
Total Assets 1,837.5 1,997.9
Cash and bank balances 245.2 350.9
Total Liabilities 896.1 882.1
Borrowings and debt securities(1) 489.5 583.1
Total Equity 941.4 1,115.8
Net Debt 244.3 232.2
Net Debt(2)/Total Equity 0.26x 0.21x
Net Debt(2)/EBITDA(3) 1.08x 0.77x
EBITDA/Interest Expense(4) 9.6x 15.5x
(1) Sum of Islamic MTNs and borrowings from financial institutions
(2) Borrowings and debt securities less cash and bank balances
(3) Annualised
(4) Total interest/profit distribution paid/payable on borrowings and debt securities

9M/3Q2015 Operational Performance

15
9M2015 9M2014 Change 3Q2015 3Q2014 Change
Production
FFB harvested (tonnes) 2,061,920 1,802,681 14.4% 849,087 776,394 9.4%
• Nucleus 1,861,975 1,618,199 15.1% 771,344 695,089 11.0%
• Plasma 199,945 184,482 8.4% 77,743 81,305 (4.4%)
FFB purchased (tonnes) 243,439 267,265 (8.9%) 86,645 103,638 (16.4%)
CPO (tonnes) 514,499 460,855 11.6% 210,488 194,643 8.1%
PK (tonnes) 119,158 107,093 11.3% 47,944 44,977 6.6%
Efficiency
FFB Yield (tonnes/ha) 13.9 13.7 5.7 5.9
CPO Yield (tonnes/ha) 3.2 3.1 1.3 1.3
CPO Extraction Rate (%) 22.8 22.6 23.0 22.5
PK Extraction Rate (%) 5.3 5.3 5.2 5.2
Production Highlights
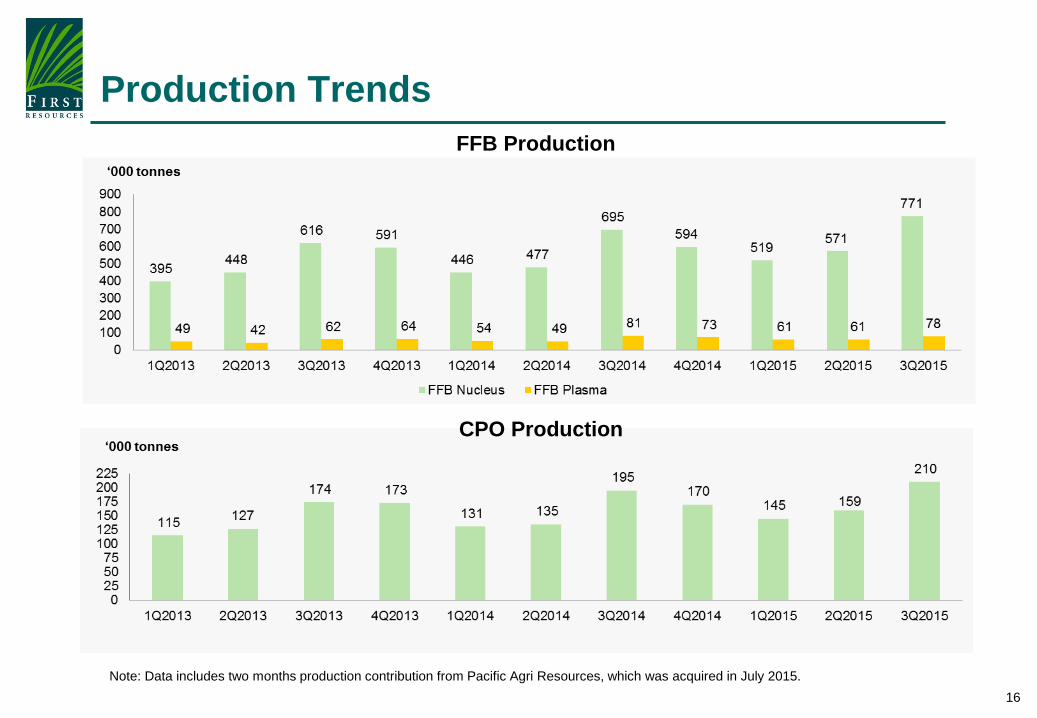
Overall increase in production due to contribution from newly mature hectarage and yield recovery in plantations.
Overall yields improvement experienced in Riau estates during 2015.
Note: Data includes two months production contribution and mature hectarage from Pacific Agri Resources, which was acquired in July 2015
16
Production Trends
FFB Production
CPO Production
Note: Data includes two months production contribution from Pacific Agri Resources, which was acquired in July 2015.

17
Oil Palm Plantation Area
As at 30 Sept 2015 As at 30 Sept 2014 As at 31 Dec 2014
Area (ha) % of Total Area (ha) % of Total Area (ha)
Planted Nucleus 176,592 86% 160,745 85% 165,936
- Mature 128,034 62% 114,143 60% 114,377
- Immature 48,558 24% 46,602 25% 51,559
Planted Plasma 29,039 14% 27,576 15% 28,631
- Mature 19,802 10% 17,893 10% 17,843
- Immature 9,237 4% 9,683 5% 10,788
Total Planted 205,631 100% 188,321 100% 194,567
- Mature 147,836 72% 132,036 70% 132,220
- Immature 57,795 28% 56,285 30% 62,347
Note: Data includes planted hectarage from Pacific Agri Resources, which was acquired in July 2015

18
Plantation Age Profile
Age As at 30 September 2015
Area (ha) % of Total
0-3 years (Immature) 57,795 28%
4-7 years (Young) 55,775 27%
8-17 years (Prime) 48,977 24%
≥ 18 years (Old) 43,084 21%
Total 205,631 100%
Weighted average age of ~ 9 years
Immature28%
Young27%
Prime24%
Old21%
Age Profile
Note: Data includes planted hectarage from Pacific Agri Resources, which was acquired in July 2015
Group Updates

20
Group Updates
Outlook
Recent recovery in palm oil prices was driven mainly by concerns over the current dry
weather that could potentially disrupt supply. Coupled with the implementation of Indonesia’s
biodiesel policy, the Group expects a moderate recovery in palm oil prices.
On the production front, the Group expects production to decline seasonally in the fourth
quarter as production has peaked in the third quarter.
21
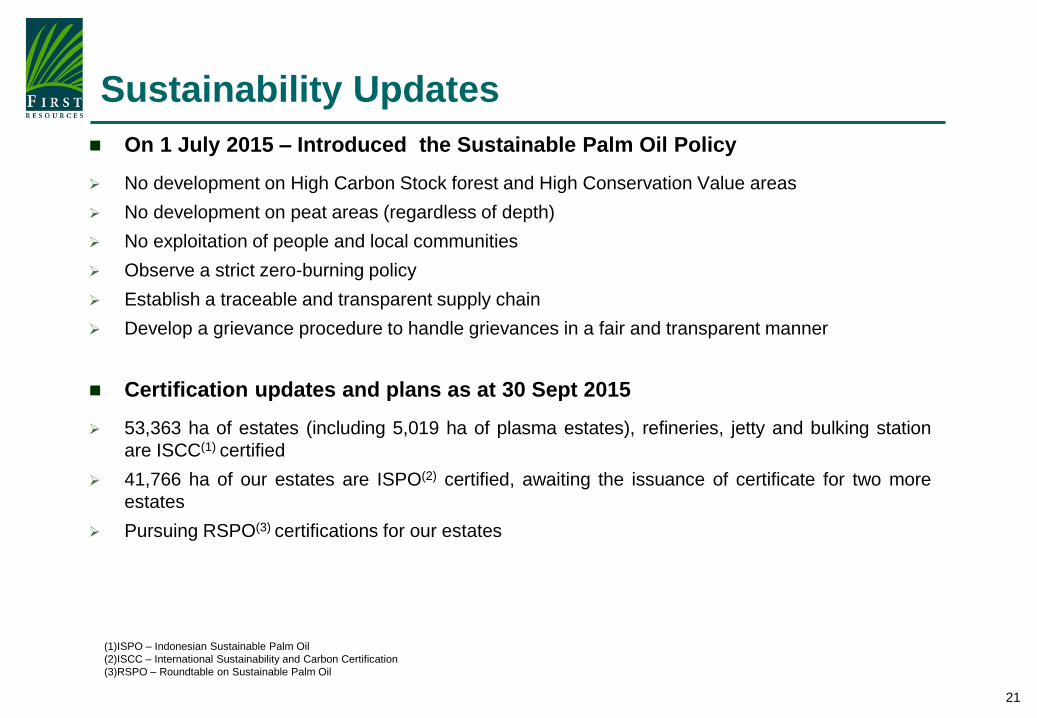
Sustainability Updates
On 1 July 2015 – Introduced the Sustainable Palm Oil Policy
No development on High Carbon Stock forest and High Conservation Value areas
No development on peat areas (regardless of depth)
No exploitation of people and local communities
Observe a strict zero-burning policy
Establish a traceable and transparent supply chain
Develop a grievance procedure to handle grievances in a fair and transparent manner
Certification updates and plans as at 30 Sept 2015
53,363 ha of estates (including 5,019 ha of plasma estates), refineries, jetty and bulking station
are ISCC(1) certified
41,766 ha of our estates are ISPO(2) certified, awaiting the issuance of certificate for two more
estates
Pursuing RSPO(3) certifications for our estates
(1)ISPO – Indonesian Sustainable Palm Oil
(2)ISCC – International Sustainability and Carbon Certification
(3)RSPO – Roundtable on Sustainable Palm Oil

22
Disclaimer
This presentation has been prepared by First Resources Limited (“Company”) for informational
purposes, and may contain projections and forward-looking statements that reflect the Company’s
current views with respect to future events and financial performance. These views are based on
current assumptions which are subject to various risks and which may change over time. No
assurance can be given that future events will occur, that projections will be achieved, or that the
Company’s assumptions are correct.
The information is current only as of its date and shall not, under any circumstances, create any
implication that the information contained therein is correct as of any time subsequent to the date
thereof or that there has been no change in the financial condition or affairs of the Company since
such date. Opinions expressed herein reflect the judgement of the Company as of the date of this
presentation and may be subject to change. This presentation may be updated from time to time
and there is no undertaking by the Company to post any such amendments or supplements on this
presentation.
The Company will not be responsible for any consequences resulting from the use of this
presentation as well as the reliance upon any opinion or statement contained herein or for any
omission.
23
Contact Information
For further information, please contact:
Investor Relations
First Resources Limited 8 Temasek Boulevard
#36-02 Suntec Tower Three
Singapore 038988
Tel: +65 6602 0200
Fax: +65 6333 6711
Website: www.first-resources.com