
Investor Presentation - CNP
68
1 Investor Presentation March 2021
Transcript of Investor Presentation - CNP

1
Investor Presentation
March 2021
2
Disclaimer
Investor Presentation – March 2021
Some of the statements contained in this presentation may be forward-looking statements referring to projections, future
events, trends or objectives that, by their very nature, involve inherent risks and uncertainties that may cause actual results
to differ materially from those currently anticipated in such statements. These risks and uncertainties may concern factors
such as changes in general economic conditions and financial market performance, legal or regulatory decisions or
changes, changes in the frequency and amount of insured claims, changes in interest rates and foreign exchange rates,
changes in the policies of central banks or governments, legal proceedings, the effects of acquisitions and divestments,
and general factors affecting competition. Further information regarding factors which may cause results to differ
materially from those projected in forward-looking statements is included in CNP Assurances’ filings with France’s
securities regulator (Autorité des Marchés Financiers - AMF). CNP Assurances does not undertake to update any forward-
looking statements presented herein to take into account any new information, future event or other factors.
Certain prior-period information may be reclassified on a basis consistent with current year data. The sum of the amounts
presented in this document may not correspond exactly to the total indicated in the tables and the text. Percentages and
percentage changes are calculated based on unrounded figures and there may be certain minor differences between the
amounts and percentages due to rounding. CNP Assurances’ final solvency indicators are submitted post-publication to
the insurance supervisor and may differ from the explicit and implicit estimates contained in this document.
This document may contain alternative performance indicators (such as EBIT) that are considered useful by CNP
Assurances but are not recognised in the IFRSs adopted for use in the European Union. These indicators should be treated
as additional information and not as substitutes for the balance sheet and income statement prepared in accordance with
IFRS. They may not be comparable with those published by other companies, as their definition may vary from one
company to another.
Disclaimer
3
1.
Business Model
2.
Profitability
3.
Investments & Asset-Liability
Management
Agenda
Investor Presentation – March 2021
4.
Solvency
5.
Rating & Funding
6.
Corporate Social
Responsibility

4
Business Model1
5(1) In terms of insurance premium income
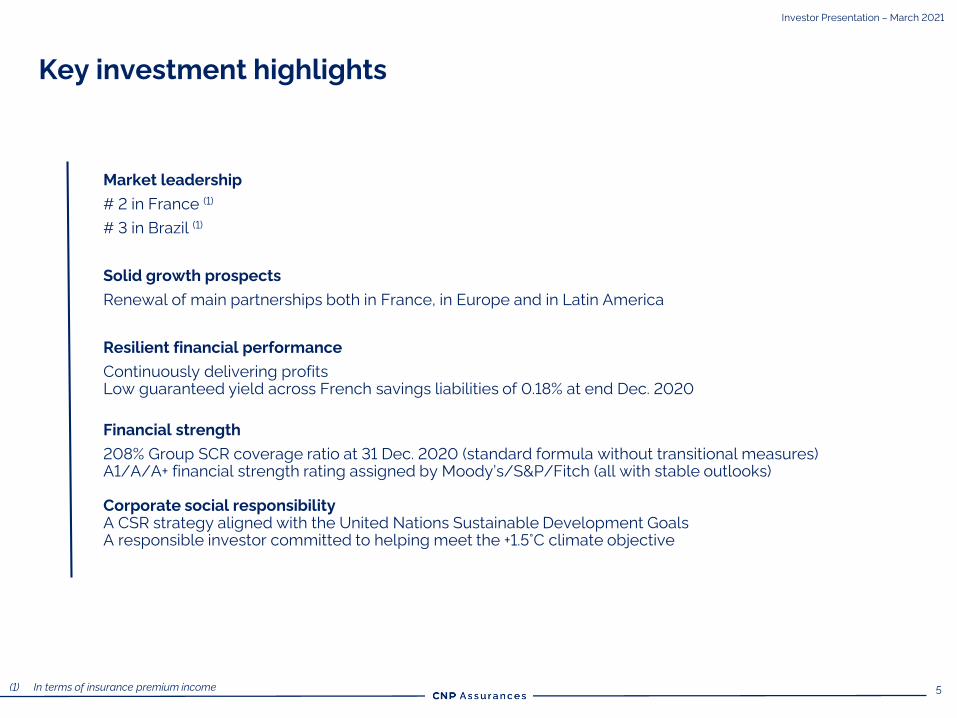
Key investment highlights
Investor Presentation – March 2021
Market leadership
# 2 in France (1)
# 3 in Brazil (1)
Solid growth prospects
Renewal of main partnerships both in France, in Europe and in Latin America
Resilient financial performance
Continuously delivering profits
Low guaranteed yield across French savings liabilities of 0.18% at end Dec. 2020
Financial strength
208% Group SCR coverage ratio at 31 Dec. 2020 (standard formula without transitional measures)
A1/A/A+ financial strength rating assigned by Moody’s/S&P/Fitch (all with stable outlooks)
Corporate social responsibility
A CSR strategy aligned with the United Nations Sustainable Development Goals
A responsible investor committed to helping meet the +1.5°C climate objective
6
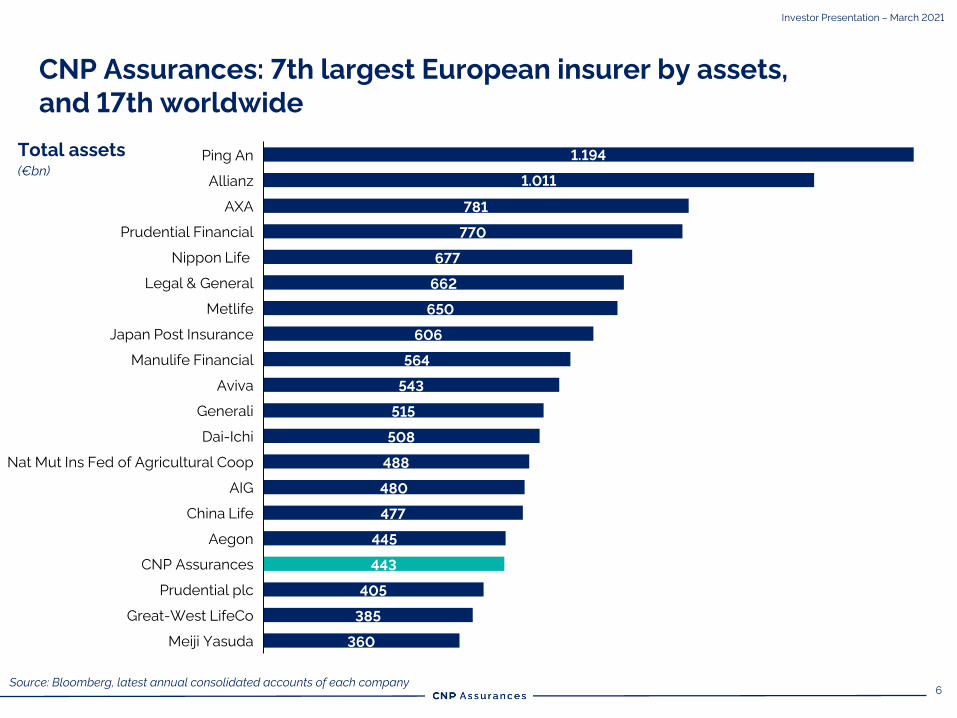
Total assets
(€bn)
Source: Bloomberg, latest annual consolidated accounts of each company
CNP Assurances: 7th largest European insurer by assets,
and 17th worldwide
Investor Presentation – March 2021
781
770
677
662
650
606
564
543
515
508
488
480
477
445
443
405
385
360
1.194
Nippon Life
Ping An
Legal & General
Allianz 1.011
AXA
Great-West LifeCo
Prudential plc
Prudential Financial
Metlife
AIG
Japan Post Insurance
CNP Assurances
Manulife Financial
Aviva
Generali
Dai-Ichi
Nat Mut Ins Fed of Agricultural Coop
China Life
Aegon
Meiji Yasuda
7
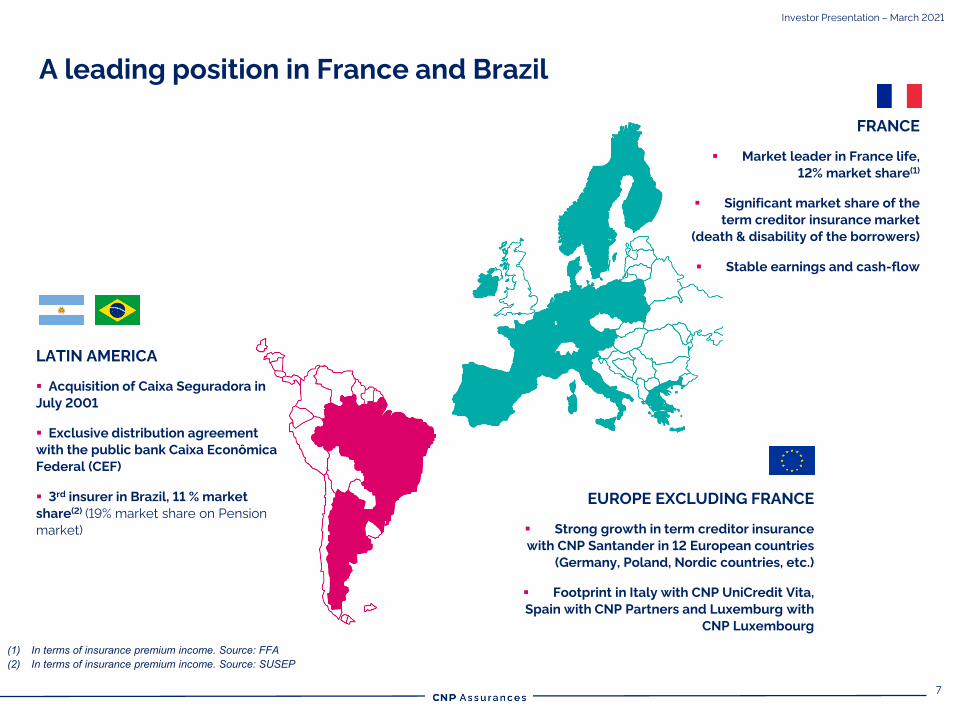
(1) In terms of insurance premium income. Source: FFA(2) In terms of insurance premium income. Source: SUSEP
LATIN AMERICA
Acquisition of Caixa Seguradora in
July 2001
Exclusive distribution agreement
with the public bank Caixa Econômica
Federal (CEF)
3rd insurer in Brazil, 11 % market
share(2) (19% market share on Pension
market)
EUROPE EXCLUDING FRANCE
Strong growth in term creditor insurance
with CNP Santander in 12 European countries
(Germany, Poland, Nordic countries, etc.)
Footprint in Italy with CNP UniCredit Vita,
Spain with CNP Partners and Luxemburg with
CNP Luxembourg
FRANCE
Market leader in France life,
12% market share(1)
Significant market share of the
term creditor insurance market
(death & disability of the borrowers)
Stable earnings and cash-flow
A leading position in France and Brazil
Investor Presentation – March 2021
8
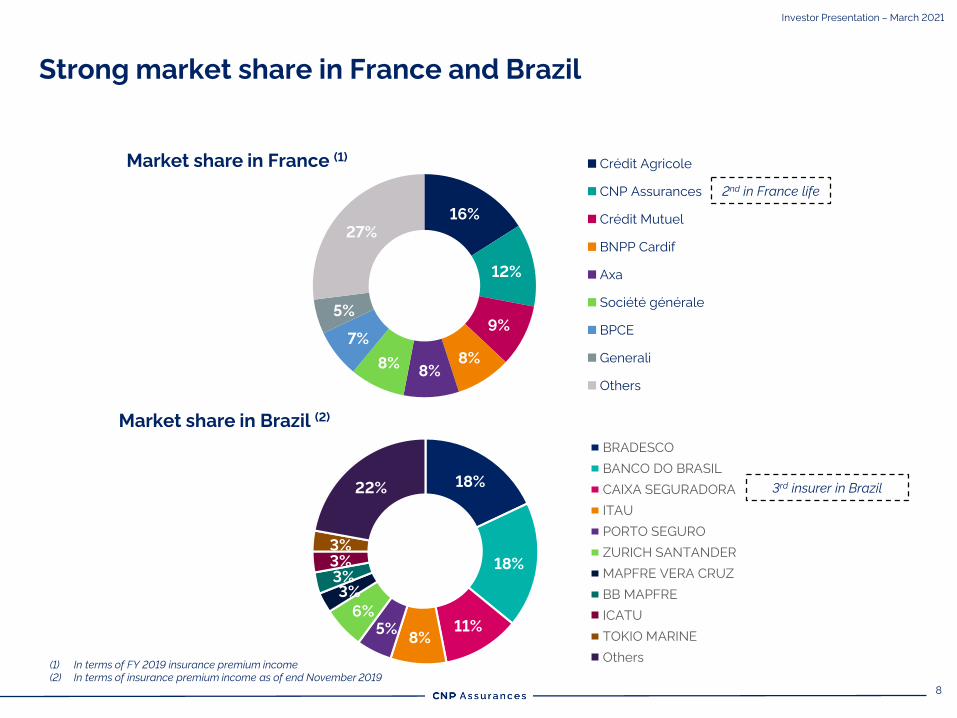
Strong market share in France and Brazil
16%
12%
9%
8%8%
8%
7%
5%
27%
Crédit Agricole
CNP Assurances
Crédit Mutuel
BNPP Cardif
Axa
Société générale
BPCE
Generali
Others
Market share in France (1)
Market share in Brazil (2)
(1) In terms of FY 2019 insurance premium income
(2) In terms of insurance premium income as of end November 2019
2nd in France life
3rd insurer in Brazil18%
18%
11%8%
5%
6%
3%
3%
3%
3%
22%
BRADESCO
BANCO DO BRASIL
CAIXA SEGURADORA
ITAU
PORTO SEGURO
ZURICH SANTANDER
MAPFRE VERA CRUZ
BB MAPFRE
ICATU
TOKIO MARINE
Others
Investor Presentation – March 2021
9
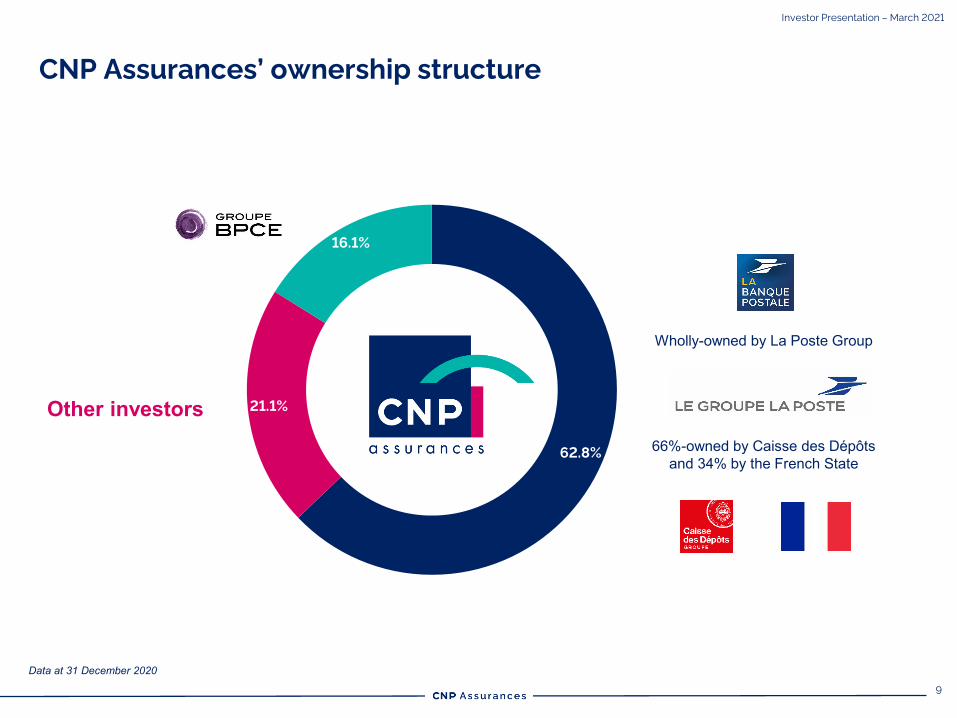
CNP Assurances’ ownership structure
Investor Presentation – March 2021
Wholly-owned by La Poste Group
66%-owned by Caisse des Dépôtsand 34% by the French State
Other investors
16.1%
62.8%
21.1%
Data at 31 December 2020
10
Investor Presentation – March 2021
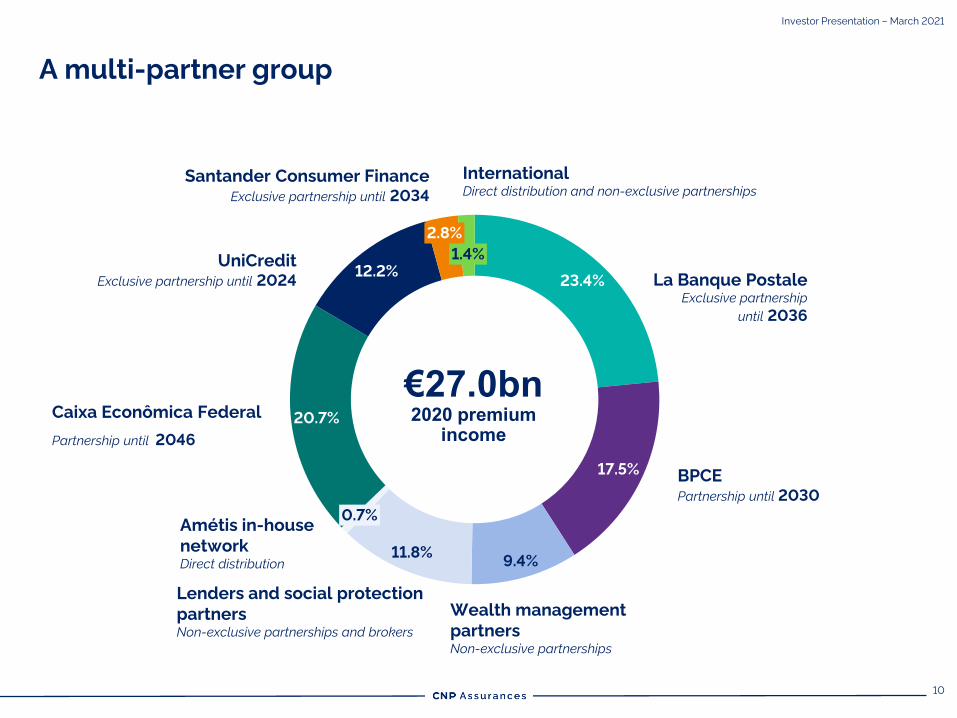
A multi-partner group
2.8%
0.7%
23.4%
9.4%
1.4%
11.8%
17.5%
20.7%
12.2%
€27.0bn2020 premium
income
La Banque Postale
Exclusive partnership
until 2036
Amétis in-house
network
Direct distribution
Caixa Econômica Federal
Partnership until 2046
UniCredit
Exclusive partnership until 2024
Santander Consumer Finance
Exclusive partnership until 2034
Wealth management
partners
Non-exclusive partnerships
Lenders and social protection
partners
Non-exclusive partnerships and brokers
BPCE
Partnership until 2030
International
Direct distribution and non-exclusive partnerships
11
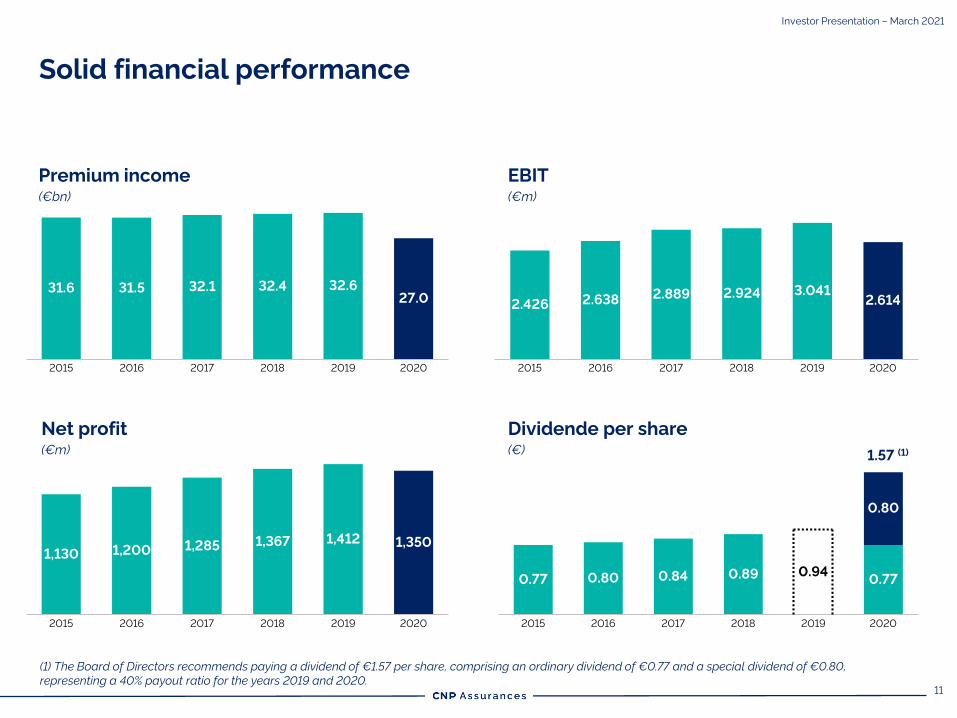
Premium income
(€bn)
EBIT
(€m)
Net profit
(€m)
Dividende per share
(€)
27.032.131.6
20172015 2016
31.5 32.4
2018
32.6
2019 2020 2015
2.4262.924
2.638
20182016 2017
2.889 3.041
2019
2.614
2020
1,285
2017
1,130
2018
1,200
20192015 2016
1,367 1,412 1,350
2020 2015
0.77
2018
0.80
2016
0.84
2017
0.89
2020
0.94
2019
0.80
0.77
Solid financial performance
(1) The Board of Directors recommends paying a dividend of €1.57 per share, comprising an ordinary dividend of €0.77 and a special dividend of €0.80,
representing a 40% payout ratio for the years 2019 and 2020.
1.57 (1)
Investor Presentation – March 2021
12
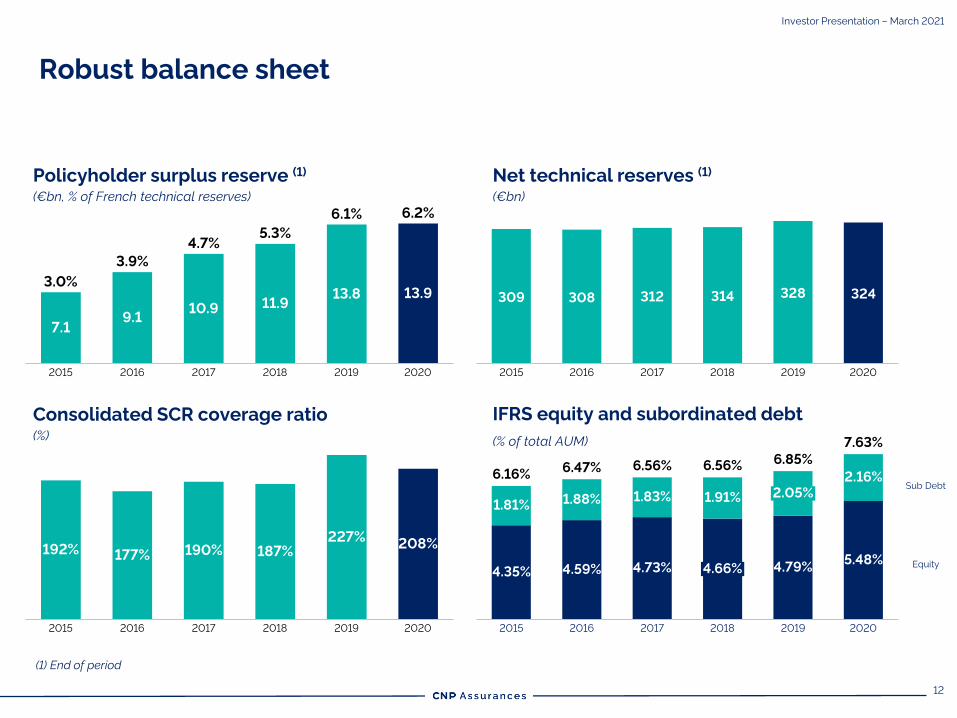
309 308 312 314 328 324
2015 2016 20202017 2018 2019
Policyholder surplus reserve (1)
(€bn, % of French technical reserves)
Net technical reserves (1)
(€bn)
Consolidated SCR coverage ratio
(%)
(1) End of period
IFRS equity and subordinated debt
(% of total AUM)
Sub Debt
Equity
9.1
13.8
7.1
2015 201820172016
3.0%
10.911.9
2019
13.9
2020
3.9%
4.7%5.3%
6.1% 6.2%
2017
192% 190%
2015
177%
2016
187%
2018
227%
2019
208%
2020 2015
2.05%
2016
1.91%
4.59%
6.85%6.56%
5.48%4.35%
2018
1.81%1.83%1.88%
4.73%
2017
4.66% 4.79%
2019
2.16%
2020
6.56%6.16%
6.47%
7.63%
Robust balance sheet
Investor Presentation – March 2021
13
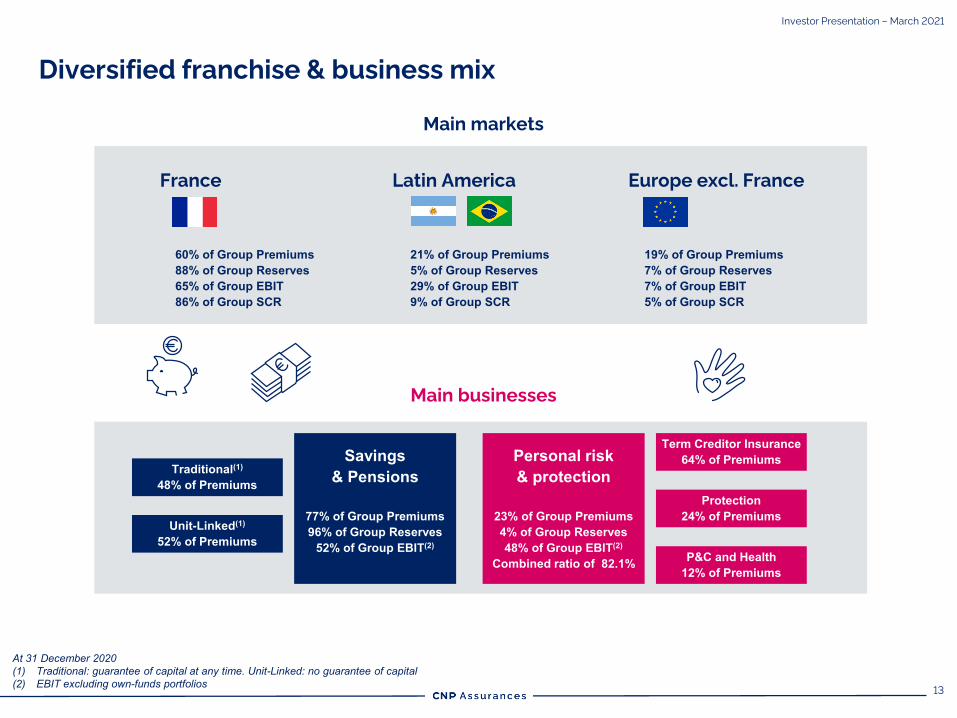
Diversified franchise & business mix
At 31 December 2020(1) Traditional: guarantee of capital at any time. Unit-Linked: no guarantee of capital(2) EBIT excluding own-funds portfolios
60% of Group Premiums88% of Group Reserves65% of Group EBIT86% of Group SCR
21% of Group Premiums5% of Group Reserves29% of Group EBIT9% of Group SCR
19% of Group Premiums7% of Group Reserves7% of Group EBIT5% of Group SCR
Main businesses
Savings & Pensions
77% of Group Premiums96% of Group Reserves
52% of Group EBIT(2)
Traditional(1)
48% of Premiums
Unit-Linked(1)
52% of Premiums
Term Creditor Insurance64% of Premiums
Protection24% of Premiums
P&C and Health12% of Premiums
Personal risk & protection
23% of Group Premiums4% of Group Reserves48% of Group EBIT(2)
Combined ratio of 82.1%
Main markets
France Latin America Europe excl. France
Investor Presentation – March 2021
14
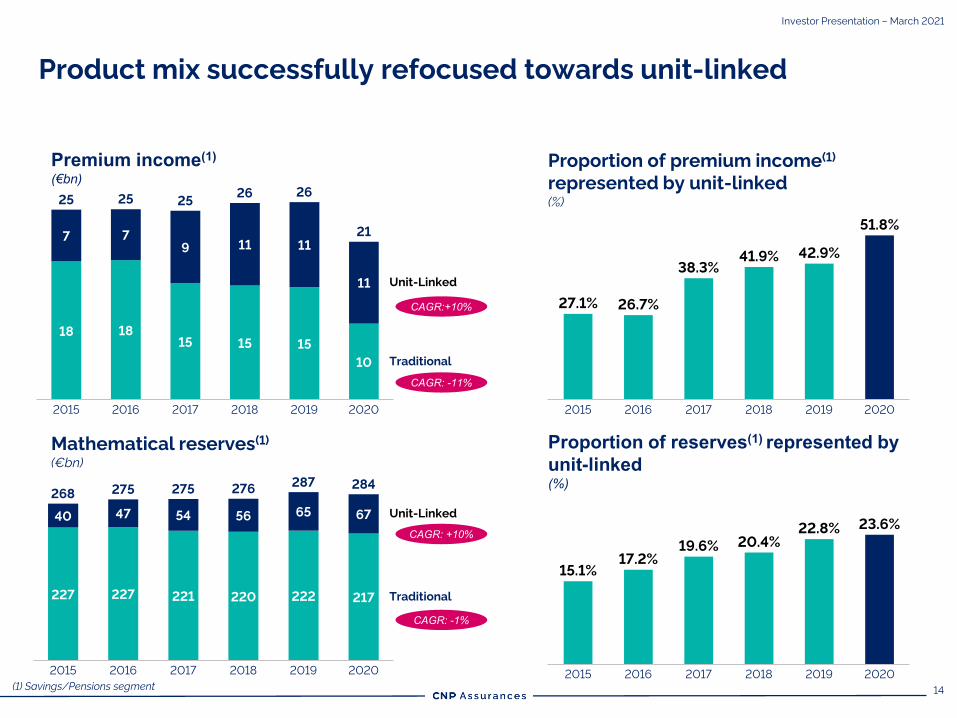
Product mix successfully refocused towards unit-linked
Premium income(1)
(€bn)Proportion of premium income(1)
represented by unit-linked
(%)
Mathematical reserves(1)
(€bn)
Proportion of reserves(1) represented by unit-linked(%)
CAGR: +10%
CAGR:+10%
CAGR: -11%
CAGR: -1%
(1) Savings/Pensions segment
18 18
15 15 15
10
7 7
9 11 11
11
25
Traditional
2015 20202017
26
2016 2018
Unit-Linked
2019
25 2526
21
227 227 221 220 222 217
40 47 54 56 65 67
2015 2016 20202017 2018
Traditional
2019
Unit-Linked
268 275 275 276287 284
2015 2016
26.7%
2017 20202018 2019
27.1%
38.3%41.9% 42.9%
51.8%
20182015 2016 20202017 2019
15.1%17.2%
19.6% 20.4%
22.8% 23.6%
Investor Presentation – March 2021
15
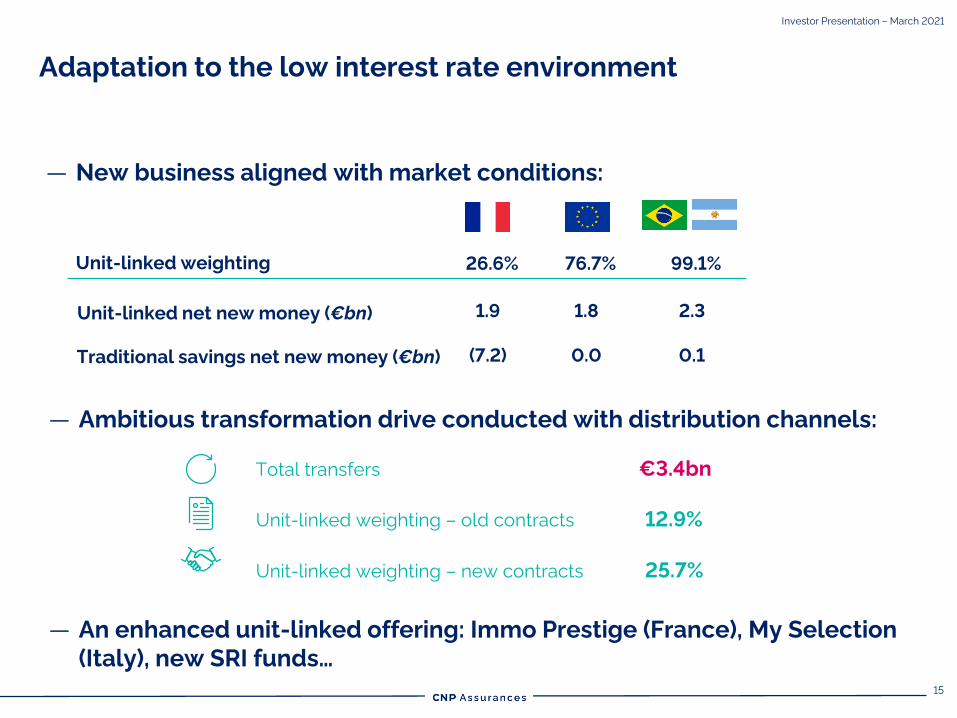
Adaptation to the low interest rate environment
Investor Presentation – March 2021
Unit-linked weighting 76.7% 99.1%26.6%
Unit-linked net new money (€bn)
Traditional savings net new money (€bn)
1.8 2.31.9
0.0 0.1(7.2)
Total transfers €3.4bn
Unit-linked weighting – old contracts 12.9%
Unit-linked weighting – new contracts 25.7%
— New business aligned with market conditions:
— Ambitious transformation drive conducted with distribution channels:
— An enhanced unit-linked offering: Immo Prestige (France), My Selection
(Italy), new SRI funds…
16
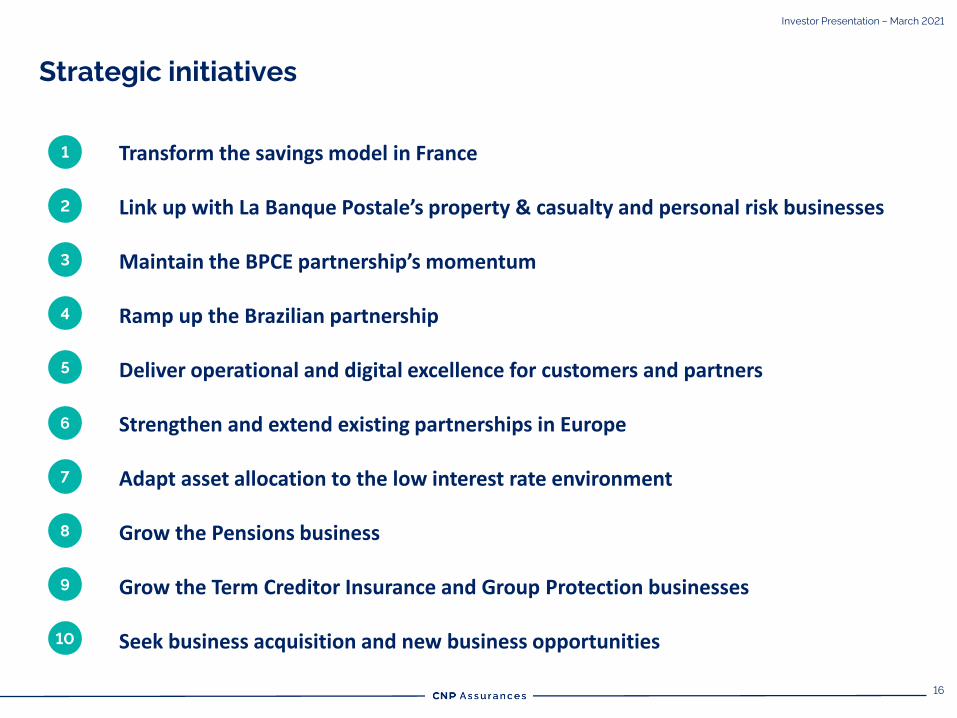
Transform the savings model in France
Link up with La Banque Postale’s property & casualty and personal risk businesses
Maintain the BPCE partnership’s momentum
Ramp up the Brazilian partnership
Deliver operational and digital excellence for customers and partners
Strengthen and extend existing partnerships in Europe
Adapt asset allocation to the low interest rate environment
Grow the Pensions business
Grow the Term Creditor Insurance and Group Protection businesses
Seek business acquisition and new business opportunities
1
2
3
4
5
6
7
8
9
10
Strategic initiatives
Investor Presentation – March 2021

17
2 Profitability

18
(1) Average exchange rates:
At 31 December 2020: Brazil: €1 = BRL 5.89; Argentina: €1 = ARS 81.04
At 31 December 2019: Brazil: €1 = BRL 4.41; Argentina: €1 = ARS 53.88
(2) Personal Risk/Protection segment: Term Creditor Insurance, Personal Risk, Health and Property & Casualty Insurance
(3)
(€m) 2019 2020 Change (reported) Change(like-for-like (1))
BUSINESS PERFORMANCE
Premium income 32,582 26,956 -17.3% -11.5%
VNB 543 284 -47.7% -
APE margin 17.1% 12.2% -4.9 pts -
EARNINGS
Total revenue 3,967 3,459 -12.8% -5.2%
Administrative costs 926 845 -8.7% -3.6%
EBIT 3,041 2,614 -14.0% -5.7%
Attributable recurring profit 2,244 1,942 -13.5% -8.1%
Attributable net profit 1,412 1,350 -4.4% -2.1%
Cost/income ratio 28.8% 28.7% -0.1 pts -
ROE 8.5% 7.4% -1.0 pts -
Combined ratio(2) 81.0% 82.1% +1.1 pts -
CASH FLOW AND DIVIDEND
Net operating free cash flow €1.97/share €1.94/share -1.1% -
Earnings per share €1.99/share €1.91/share -3.9% -
SOLVENCYConsolidated SCR coverage ratio 227% 208% -19 pts -
Consolidated MCR coverage ratio 388% 351% -36 pts -
2020 key figures
Investor Presentation – March 2021
19
Investor Presentation – March 2021
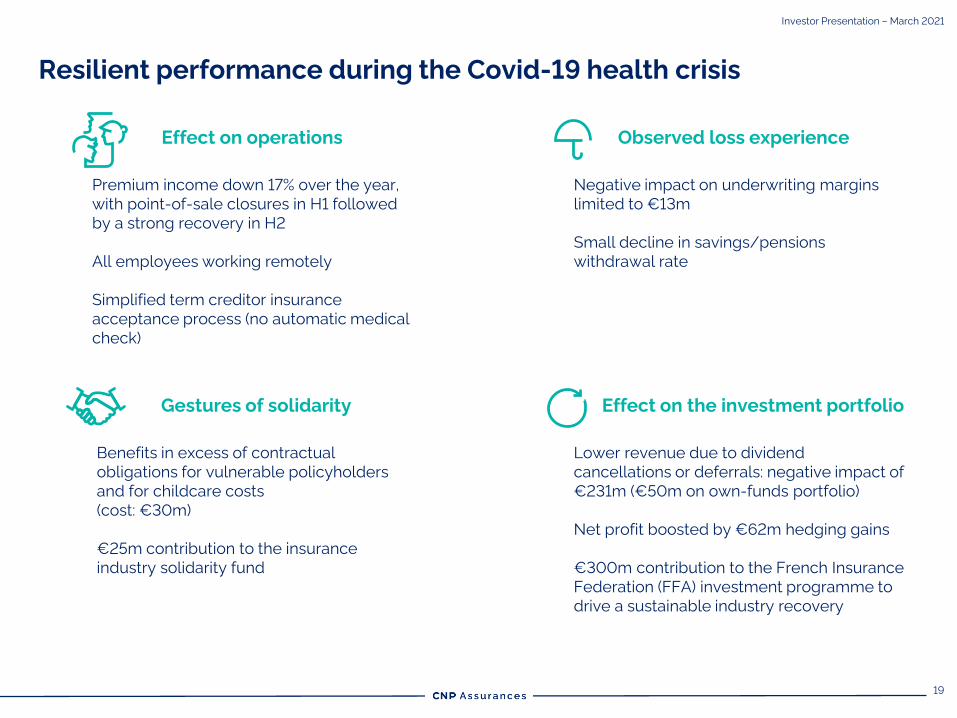
Effect on operations
Premium income down 17% over the year,
with point-of-sale closures in H1 followed
by a strong recovery in H2
All employees working remotely
Simplified term creditor insurance
acceptance process (no automatic medical
check)
Observed loss experience
Negative impact on underwriting margins
limited to €13m
Small decline in savings/pensions
withdrawal rate
Gestures of solidarity
Benefits in excess of contractual
obligations for vulnerable policyholders
and for childcare costs
(cost: €30m)
€25m contribution to the insurance
industry solidarity fund
Effect on the investment portfolio
Lower revenue due to dividend
cancellations or deferrals: negative impact of
€231m (€50m on own-funds portfolio)
Net profit boosted by €62m hedging gains
€300m contribution to the French Insurance
Federation (FFA) investment programme to
drive a sustainable industry recovery
Resilient performance during the Covid-19 health crisis
20
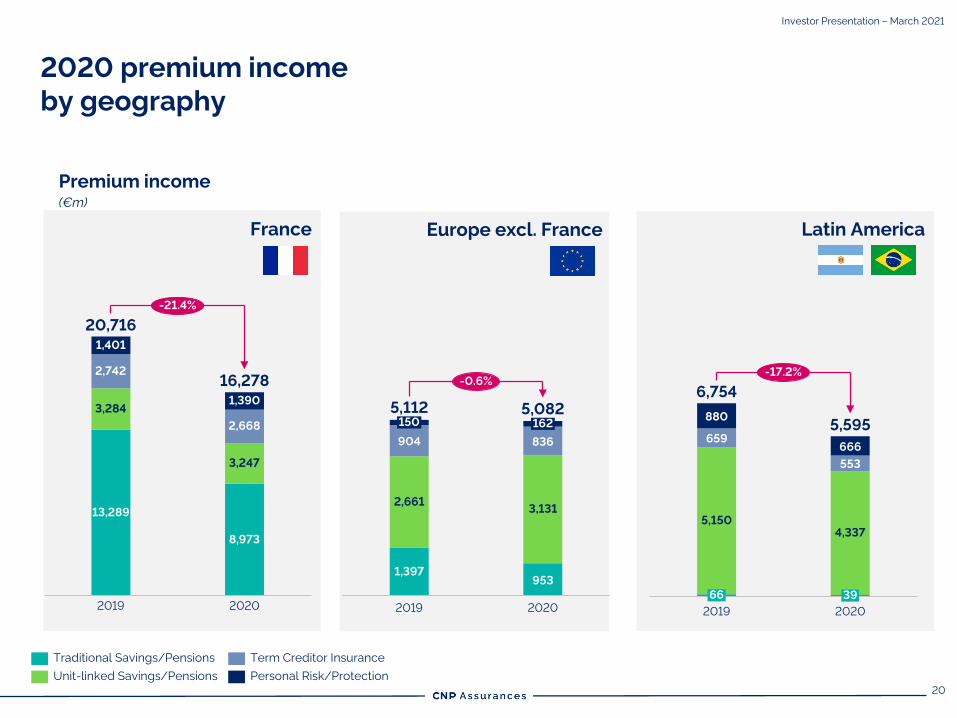
2020 premium income
by geography
Premium income
(€m)
708
738
1,271
1,854
3,883
1,293
1,381
7,376
11,319
7,185
-36.5%
Traditional Savings/Pensions
Unit-linked Savings/Pensions
Term Creditor Insurance
Personal Risk/Protection
953
904 836
5,082
3,131
150 162
2,661
2020
1,397
2019
5,112
-0.6%
France
Europe excl. France
2019
2,668
2,742
3,284
1,401
13,289
3,247
1,390
8,973
2020
20,716
16,278
-21.4%
France
659
553
880
666
5,150
4,337
66
2019
39
2020
6,754
5,595
-17.2%
Latin America
Investor Presentation – March 2021
21
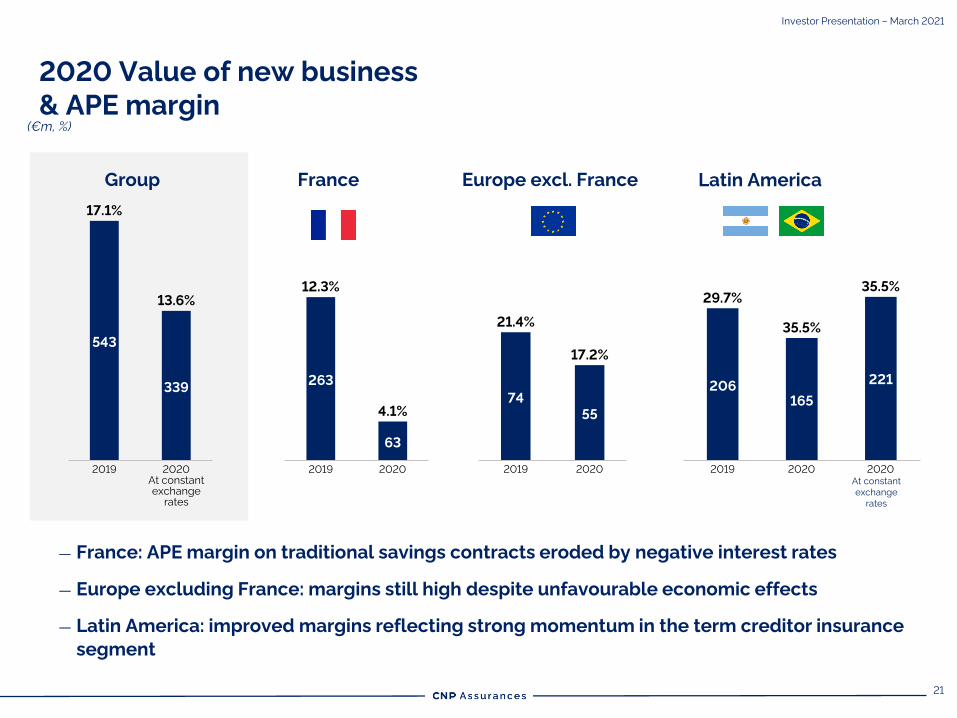
2020 Value of new business
& APE margin
France Latin AmericaEurope excl. France
206
165
221
35.5%
29.7%
2019 2020 2020
35.5%
At constant
exchange
rates
263
63
12.3%
2019 2020
4.1%
74
55
2019
17.2%
21.4%
2020
Investor Presentation – March 2021
— France: APE margin on traditional savings contracts eroded by negative interest rates
— Europe excluding France: margins still high despite unfavourable economic effects
— Latin America: improved margins reflecting strong momentum in the term creditor insurance
segment
(€m, %)
Group
543
339
2019
13.6%
2020
At constant
exchange
rates
17.1%
22
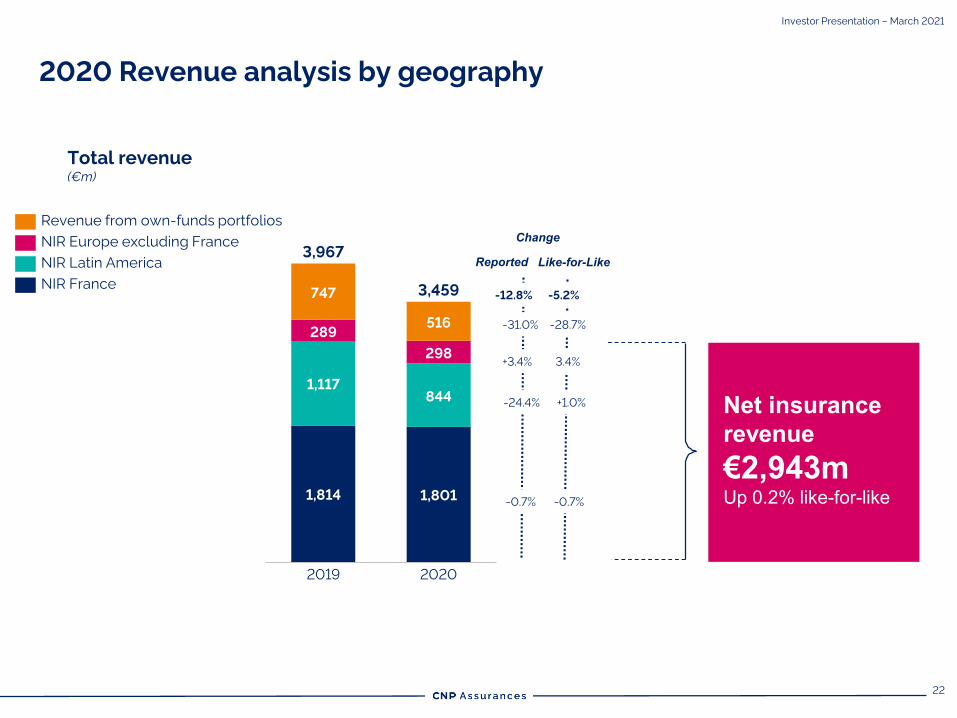
Total revenue
(€m)
844
289
298
747
516
1,814 1,801
1,117
3,967
2019
3,459
2020
Revenue from own-funds portfolios
NIR Europe excluding France
NIR Latin America
NIR France-12.8%
-31.0%
Like-for-Like
Change
-5.2%
-28.7%
-0.7% -0.7%
+3.4% 3.4%
-24.4% +1.0% Net insurance revenue €2,943mUp 0.2% like-for-like
2020 Revenue analysis by geography
Reported
Investor Presentation – March 2021
23
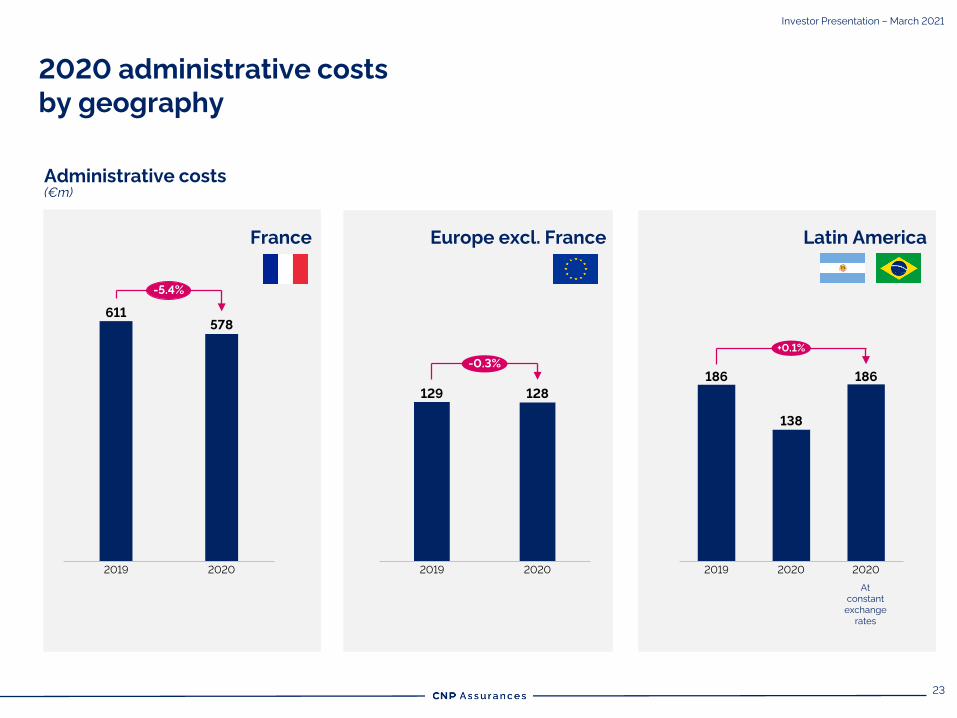
2020 administrative costs
by geography
Administrative costs(€m)
France Latin AmericaEurope excl. France
Investor Presentation – March 2021
611
578
2019 2020
-5.4%
129 128
20202019
-0.3%
186
138
186
2019 2020 2020
+0.1%
At
constant
exchange
rates
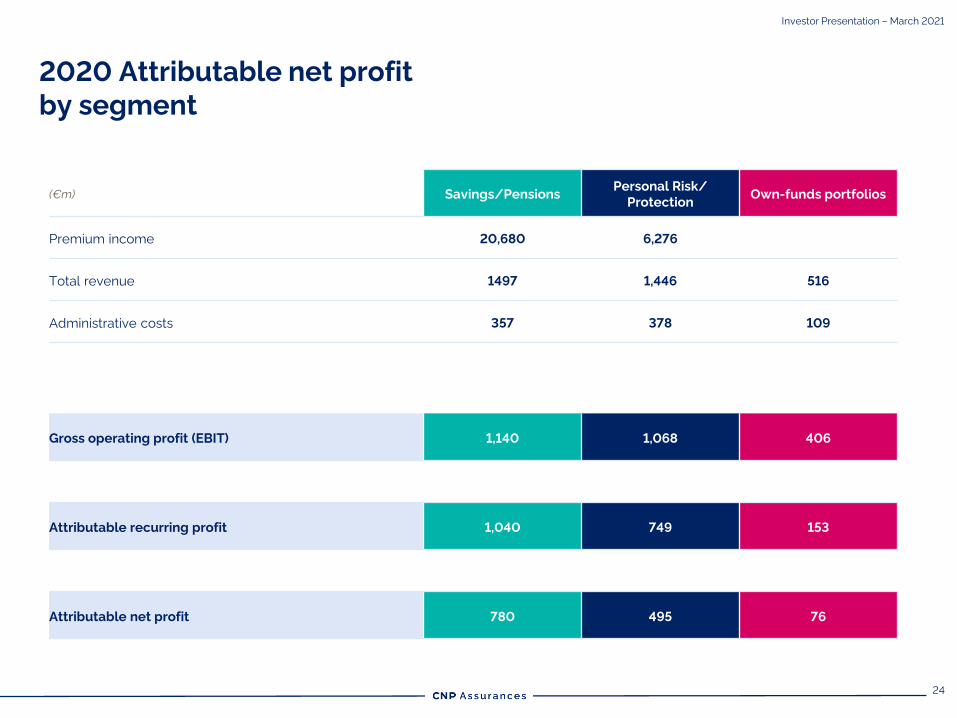
24
(€m) Savings/PensionsPersonal Risk/
ProtectionOwn-funds portfolios
Premium income 20,680 6,276
Total revenue 1497 1,446 516
Administrative costs 357 378 109
Gross operating profit (EBIT) 1,140 1,068 406
Attributable recurring profit 1,040 749 153
Attributable net profit 780 495 76
Investor Presentation – March 2021
2020 Attributable net profit
by segment
25
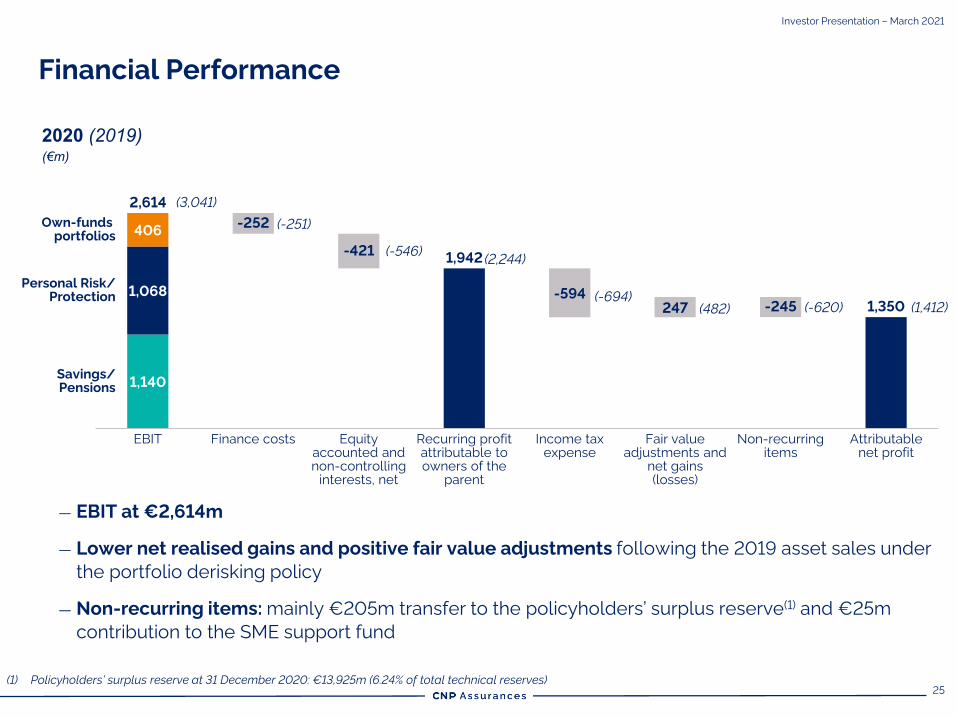
Financial Performance
Investor Presentation – March 2021
— EBIT at €2,614m
— Lower net realised gains and positive fair value adjustments following the 2019 asset sales under
the portfolio derisking policy
— Non-recurring items: mainly €205m transfer to the policyholders’ surplus reserve(1) and €25m
contribution to the SME support fund
2020 (2019)(€m)
247
Recurring profit
attributable to
owners of the
parent
Income tax
expense
-252
1,068
406
EBIT Finance costs
-421
Equity
accounted and
non-controlling
interests, net
-594
Fair value
adjustments and
net gains
(losses)
-245
Non-recurring
items
Attributable
net profit
Savings/
Pensions
Personal Risk/
Protection
Own-funds
portfolios
2,614
1,140
1,942
1,350
(3,041)
(-251)
(-546)
(-694)
(482) (-620) (1,412)
(2,244)
(1) Policyholders’ surplus reserve at 31 December 2020: €13,925m (6.24% of total technical reserves)
26
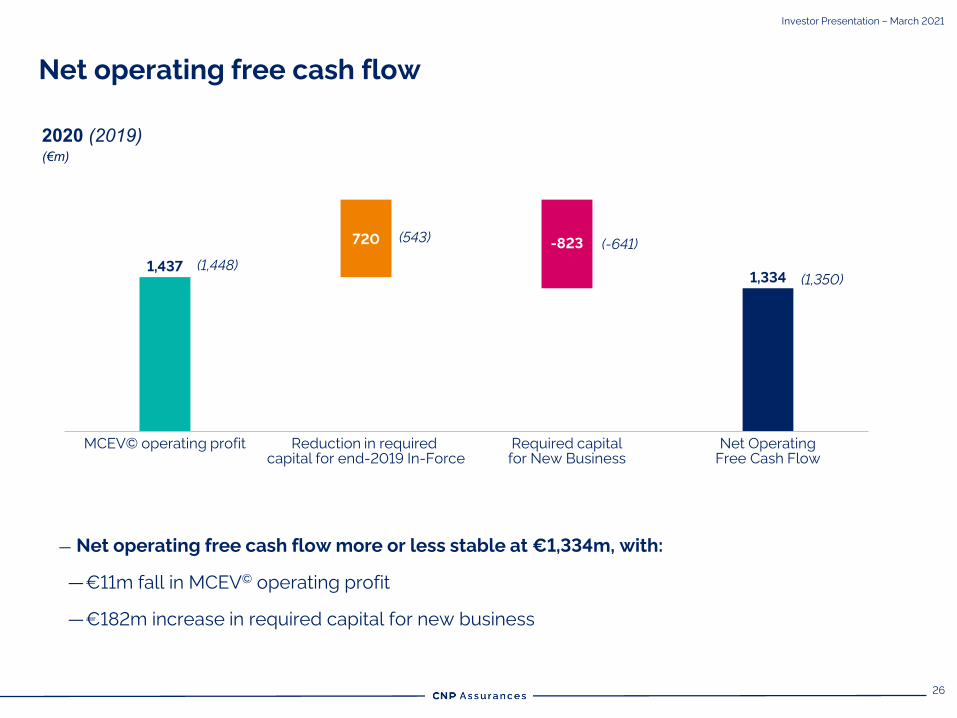
Net operating free cash flow
Investor Presentation – March 2021
720 -823
MCEV© operating profit Required capital
for New Business
Reduction in required
capital for end-2019 In-Force
Net Operating
Free Cash Flow
1,4371,334
— Net operating free cash flow more or less stable at €1,334m, with:
—€11m fall in MCEV© operating profit
—€182m increase in required capital for new business
2020 (2019)(€m)
(1,448)
(543)(-641)
(1,350)
27
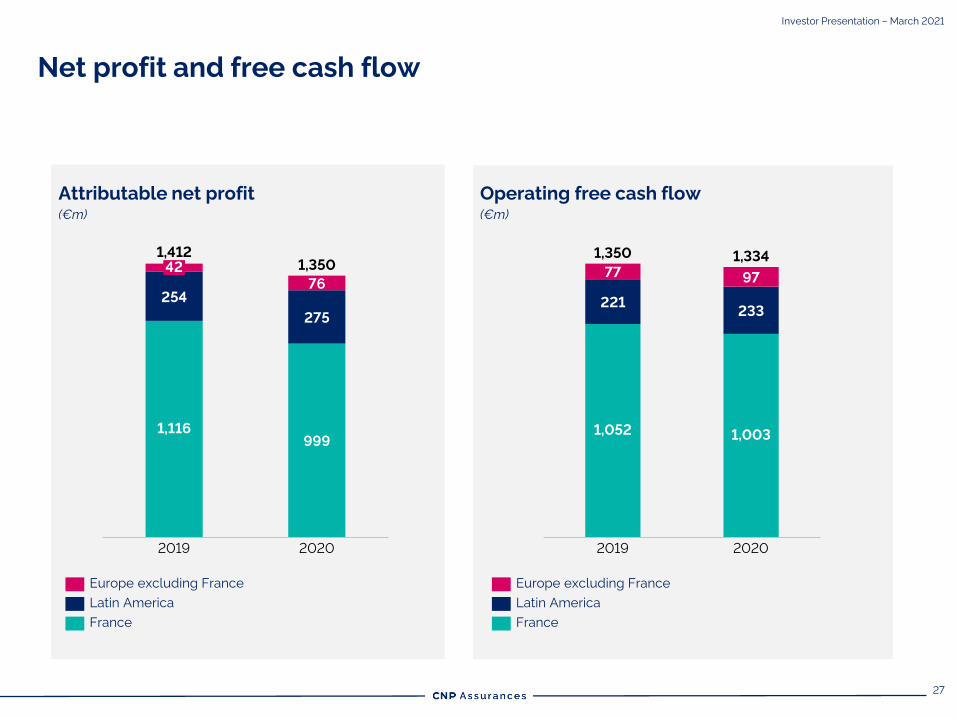
Net profit and free cash flow
Attributable net profit
(€m)
Operating free cash flow
(€m)
999
254
275
76
1,350
1,116
2019
42
1,412
2020
France
Europe excluding France
Latin America
221233
7797
2020
1,052
2019
1,003
1,3341,350
Europe excluding France
Latin America
France
Investor Presentation – March 2021

28
3 Investments & ALM
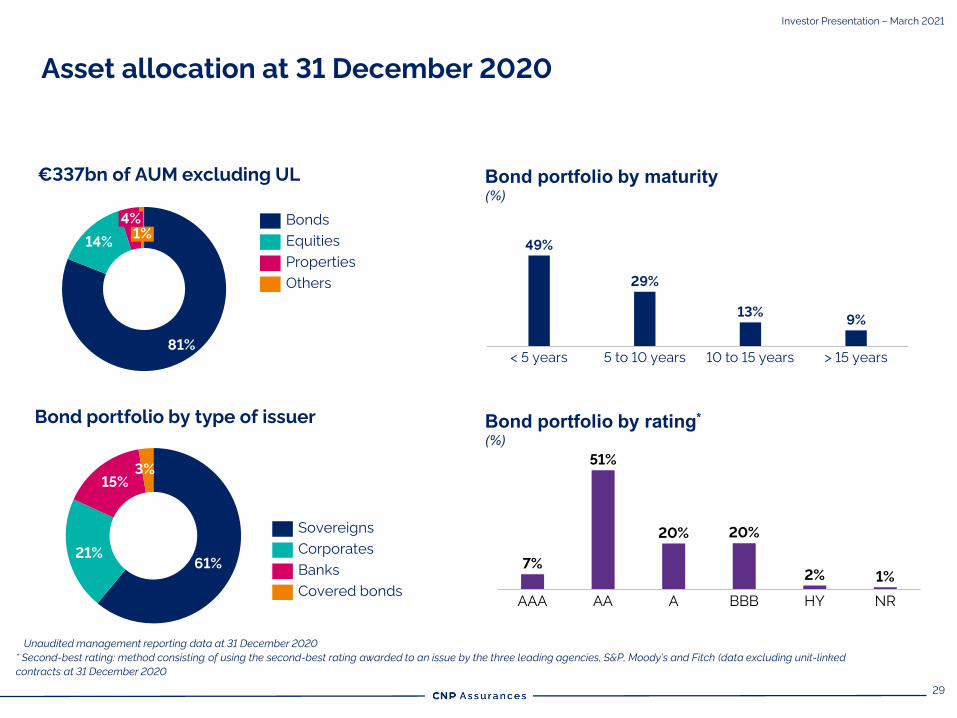
29
€337bn of AUM excluding UL
Bond portfolio by type of issuer
81%
14%1%
4% Bonds
Properties
Equities
Others
Asset allocation at 31 December 2020
Unaudited management reporting data at 31 December 2020
* Second-best rating: method consisting of using the second-best rating awarded to an issue by the three leading agencies, S&P, Moody’s and Fitch (data excluding unit-linked
contracts at 31 December 2020
Investor Presentation – March 2021
61%21%
15%
3%
Sovereigns
Corporates
Banks
Covered bonds
Bond portfolio by maturity (%)
Bond portfolio by rating*
(%)
13%
< 5 years 5 to 10 years
9%
10 to 15 years
49%
> 15 years
29%
AAAA AA
51%
BBB
7%
HY NR
20% 20%
2% 1%
30
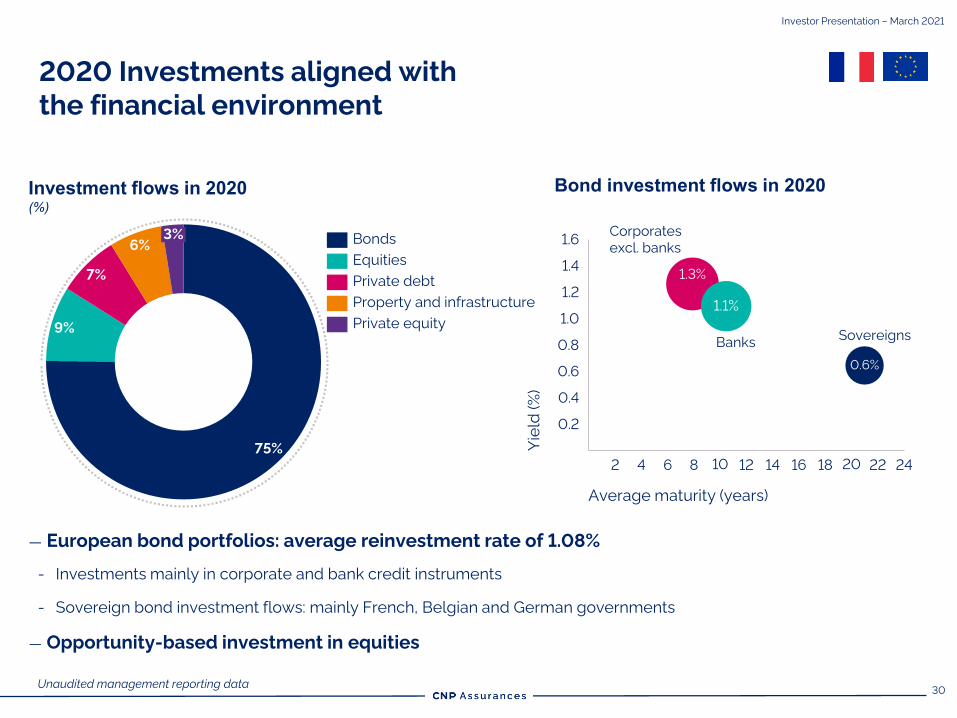
Investment flows in 2020(%)
Bond investment flows in 2020
Unaudited management reporting data
75%
9%
7%
6%3% Bonds
Equities
Private debt
Property and infrastructure
Private equity
1062 4 168 12
0.6
14 2218 20 24
0.2
0.4
0.8
1.0
1.2
1.4
1.6
0.6%
Average maturity (years)
1.1%
Yie
ld (%
)
1.3%
2020 Investments aligned with
the financial environment
— European bond portfolios: average reinvestment rate of 1.08%
- Investments mainly in corporate and bank credit instruments
- Sovereign bond investment flows: mainly French, Belgian and German governments
— Opportunity-based investment in equities
SovereignsBanks
Corporates
excl. banks
Investor Presentation – March 2021
31
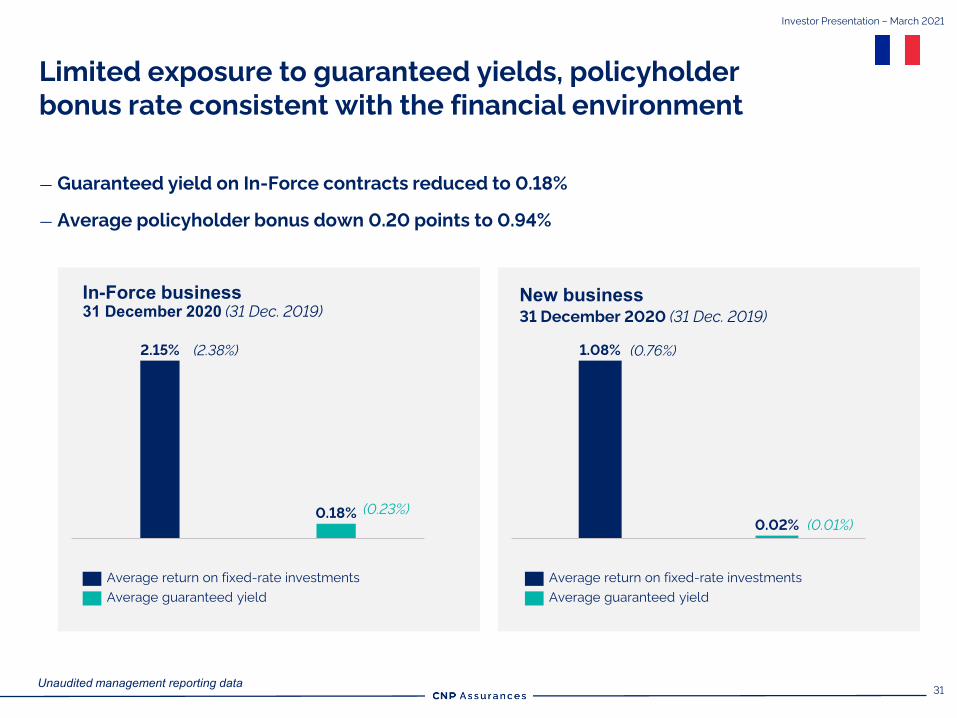
In-Force business31 December 2020 (31 Dec. 2019)
New business31 December 2020 (31 Dec. 2019)
Unaudited management reporting data
2.15%
0.18%
Average return on fixed-rate investments
Average guaranteed yield
0.02%
1.08%
Average guaranteed yield
Average return on fixed-rate investments
(2.38%)
(0.23%)
(0.76%)
(0.01%)
Limited exposure to guaranteed yields, policyholder
bonus rate consistent with the financial environment
— Guaranteed yield on In-Force contracts reduced to 0.18%
— Average policyholder bonus down 0.20 points to 0.94%
Investor Presentation – March 2021
32
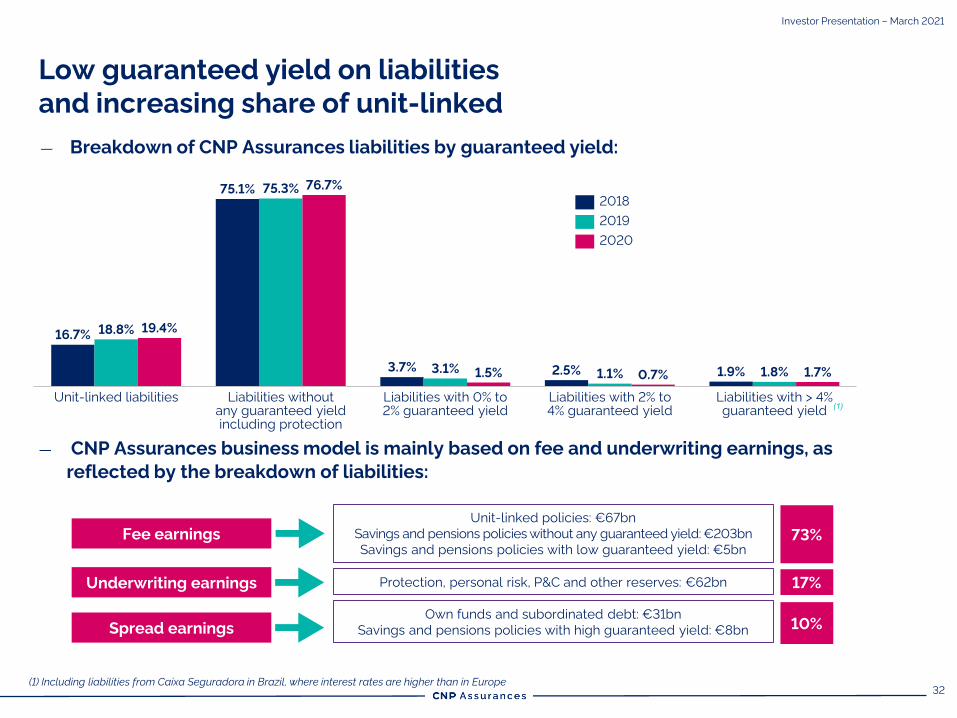
— Breakdown of CNP Assurances liabilities by guaranteed yield:
Low guaranteed yield on liabilities
and increasing share of unit-linked
— CNP Assurances business model is mainly based on fee and underwriting earnings, as
reflected by the breakdown of liabilities:
Fee earnings
Underwriting earnings
Spread earnings
73%
17%
10%
Unit-linked policies: €67bn
Savings and pensions policies without any guaranteed yield: €203bn
Savings and pensions policies with low guaranteed yield: €5bn
Protection, personal risk, P&C and other reserves: €62bn
Own funds and subordinated debt: €31bn
Savings and pensions policies with high guaranteed yield: €8bn
(1) Including liabilities from Caixa Seguradora in Brazil, where interest rates are higher than in Europe
(1)
19.4%
1.7%
Unit-linked liabilities
3.1%
18.8%
Liabilities without
any guaranteed yield
including protection
Liabilities with 0% to
2% guaranteed yield
75.3%75.1%
Liabilities with 2% to
4% guaranteed yield
16.7%
Liabilities with > 4%
guaranteed yield
76.7%
3.7%1.5% 2.5% 1.1% 0.7% 1.8%1.9%
2018
2019
2020
Investor Presentation – March 2021
33
CNP Assurances has several buffers
to cope with financial market volatility
— Low contractually guaranteed yield
– Current French savings production has no contractually guaranteed yield(1) and the overall
average guaranteed yield across all policy liabilities is 0.18% at end Dec. 2020
– At the end of each year, CNP Assurances has the full flexibility to decide the yield attributed
to policyholders over and above guarantees (0.94% on average in 2020)
— €39.0bn IFRS unrealized gains (10.6% of total asset portfolio) at end Dec. 2020
– If necessary, gains can be realized to offset the impact of asset impairments or low interest rates
– By construction, at least 85% of market movements are “pass-through” to policyholders, with
equity impact to shareholders being of second order
— €13,9bn Policyholder Surplus Reserve (6.2% of French technical reserves) at end Dec. 2020
– If necessary, amounts in the surplus reserve can be used to absorb investment losses
(1) All new policies have 0% guaranteed yield, some old policies still exist with a positive guaranteed yield on top-up premiums. These old policies, which include a guaranteed yield, will progressively disappear due to lapses and deaths of policyholders
Investor Presentation – March 2021
34
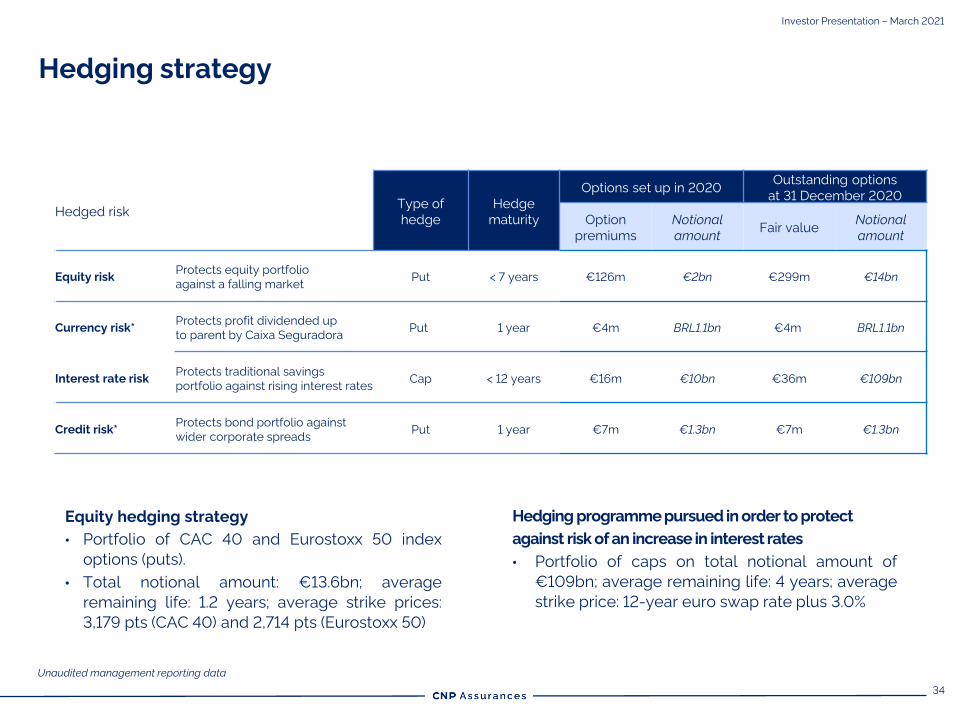
Hedging strategy
Equity hedging strategy
• Portfolio of CAC 40 and Eurostoxx 50 index
options (puts).
• Total notional amount: €13.6bn; average
remaining life: 1.2 years; average strike prices:
3,179 pts (CAC 40) and 2,714 pts (Eurostoxx 50)
Hedging programme pursued in order to protect
against risk of an increase in interest rates
• Portfolio of caps on total notional amount of
€109bn; average remaining life: 4 years; average
strike price: 12-year euro swap rate plus 3.0%
Unaudited management reporting data
Investor Presentation – March 2021
Hedged riskType of
hedge
Hedge
maturity
Options set up in 2020Outstanding options
at 31 December 2020
Option
premiums
Notional
amountFair value
Notional
amount
Equity riskProtects equity portfolio
against a falling marketPut < 7 years €126m €2bn €299m €14bn
Currency risk* Protects profit dividended up
to parent by Caixa SeguradoraPut 1 year €4m BRL1.1bn €4m BRL1.1bn
Interest rate riskProtects traditional savings
portfolio against rising interest ratesCap < 12 years €16m €10bn €36m €109bn
Credit risk*Protects bond portfolio against
wider corporate spreadsPut 1 year €7m €1.3bn €7m €1.3bn

35
4 Solvency
36
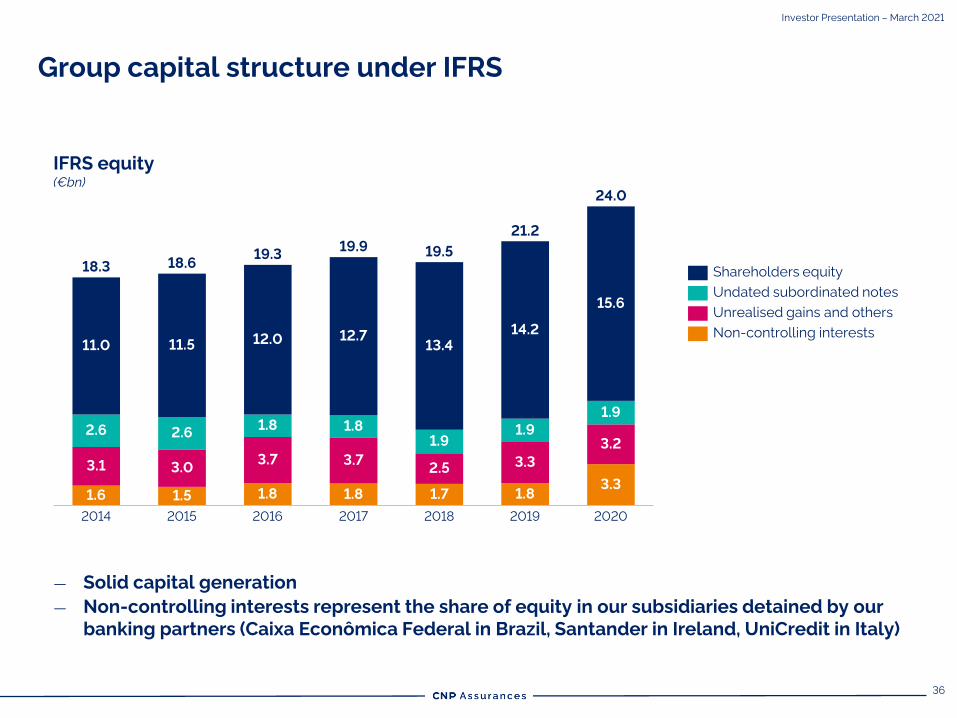
Group capital structure under IFRS
— Solid capital generation
— Non-controlling interests represent the share of equity in our subsidiaries detained by our
banking partners (Caixa Econômica Federal in Brazil, Santander in Ireland, UniCredit in Italy)
IFRS equity
(€bn)
3.0
11.0
3.3
2.6
3.1
2.6
18.6
1.6
2014
11.5
1.5
2015
1.8
3.7
2019
1.8
2016
18.3
12.7
1.8
19.5
3.7
1.8
2017
13.4
1.9
2.5
1.7
2018
19.9
1.9
12.0
1.8
15.6
1.9
3.2
14.2
2020
19.3
21.2
24.0
3.3
Shareholders equity
Undated subordinated notes
Unrealised gains and others
Non-controlling interests
Investor Presentation – March 2021
37
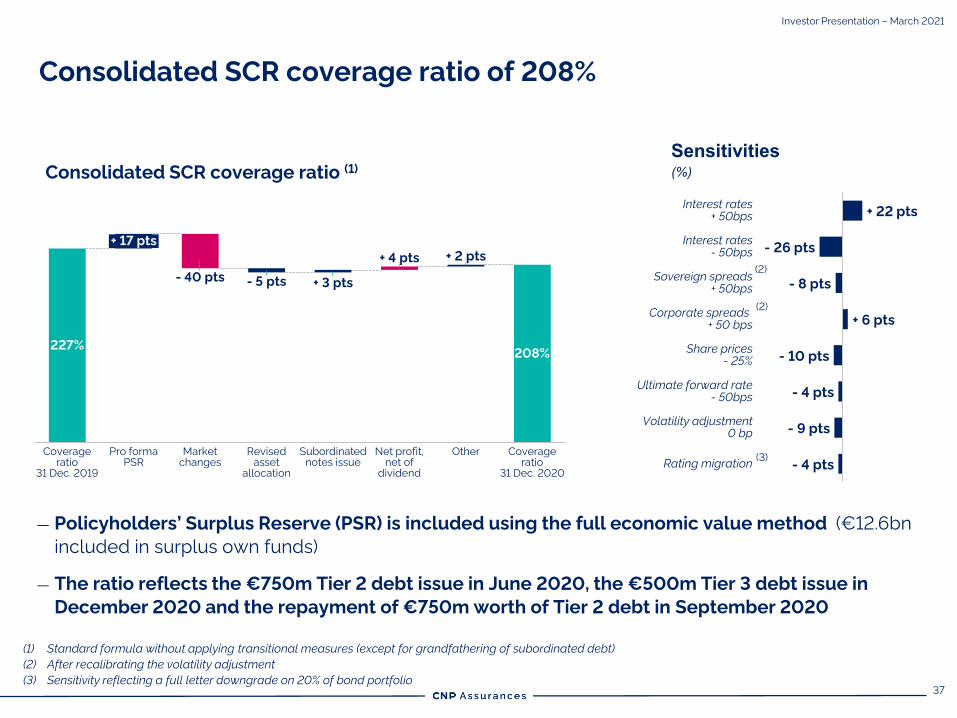
Consolidated SCR coverage ratio of 208%
Investor Presentation – March 2021
— Policyholders’ Surplus Reserve (PSR) is included using the full economic value method (€12.6bn
included in surplus own funds)
— The ratio reflects the €750m Tier 2 debt issue in June 2020, the €500m Tier 3 debt issue in
December 2020 and the repayment of €750m worth of Tier 2 debt in September 2020
(1) Standard formula without applying transitional measures (except for grandfathering of subordinated debt)
(2) After recalibrating the volatility adjustment
(3) Sensitivity reflecting a full letter downgrade on 20% of bond portfolio
Consolidated SCR coverage ratio (1)
Sensitivities(%)
+ 22 pts
- 26 pts
- 8 pts
+ 6 pts
- 10 pts
- 4 pts
- 9 pts
- 4 pts
Volatility adjustment
0 bp
Interest rates
+ 50bps
Interest rates
- 50bps
Rating migration
Ultimate forward rate
- 50bps
Sovereign spreads
+ 50bps
Share prices
- 25%
Corporate spreads
+ 50 bps
+ 3 pts
+ 4 pts + 2 pts
227%
Pro forma
PSR
Coverage
ratio
31 Dec. 2019
- 40 pts
+ 17 pts
Market
changes
- 5 pts
Revised
asset
allocation
Coverage
ratio
31 Dec. 2020
208%
Subordinated
notes issue
Net profit,
net of
dividend
Other
(2)
(2)
(3)
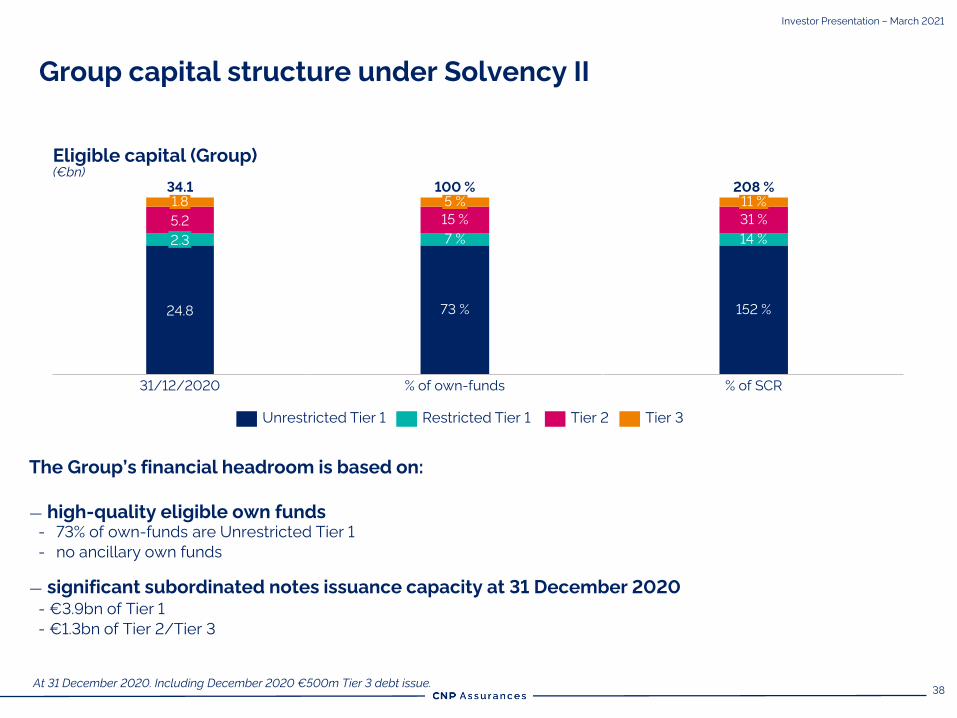
38At 31 December 2020. Including December 2020 €500m Tier 3 debt issue.
Eligible capital (Group)(€bn)
31/12/2020
24.8
34.1
2.3
5.2
1.8
Unrestricted Tier 1 Tier 3Restricted Tier 1 Tier 2
73 %
7 %
% of own-funds
5 %
15 %
100 %
% of SCR
14 %
152 %
31 %
11 %
208 %
Group capital structure under Solvency II
Investor Presentation – March 2021
The Group’s financial headroom is based on:
— high-quality eligible own funds
- 73% of own-funds are Unrestricted Tier 1
- no ancillary own funds
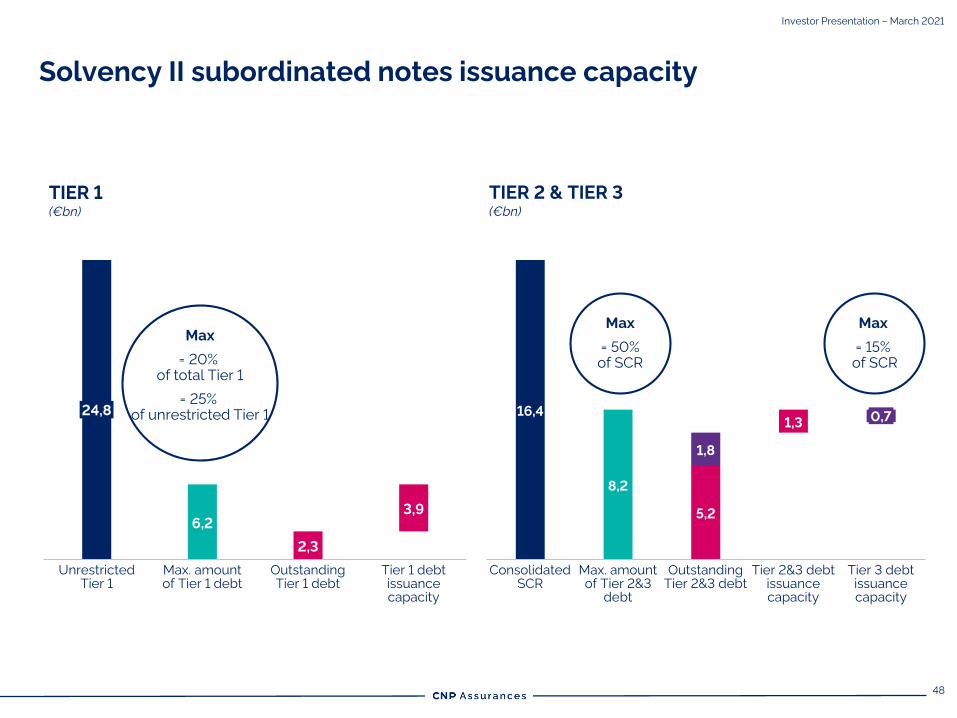
— significant subordinated notes issuance capacity at 31 December 2020
- €3.9bn of Tier 1
- €1.3bn of Tier 2/Tier 3
39
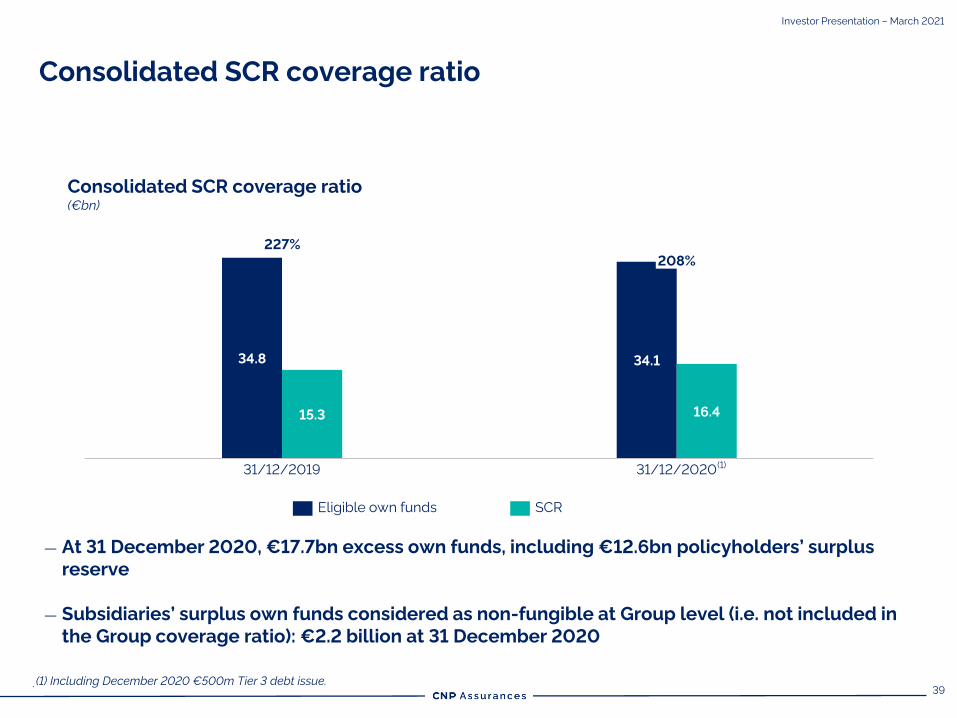
Consolidated SCR coverage ratio
(€bn)
16.415.3
34.8
31/12/2020
227%
31/12/2019
208%
34.1
SCREligible own funds
(1) Including December 2020 €500m Tier 3 debt issue.
(1)
.
Investor Presentation – March 2021
Consolidated SCR coverage ratio
— At 31 December 2020, €17.7bn excess own funds, including €12.6bn policyholders’ surplus
reserve
— Subsidiaries’ surplus own funds considered as non-fungible at Group level (i.e. not included in
the Group coverage ratio): €2.2 billion at 31 December 2020
40
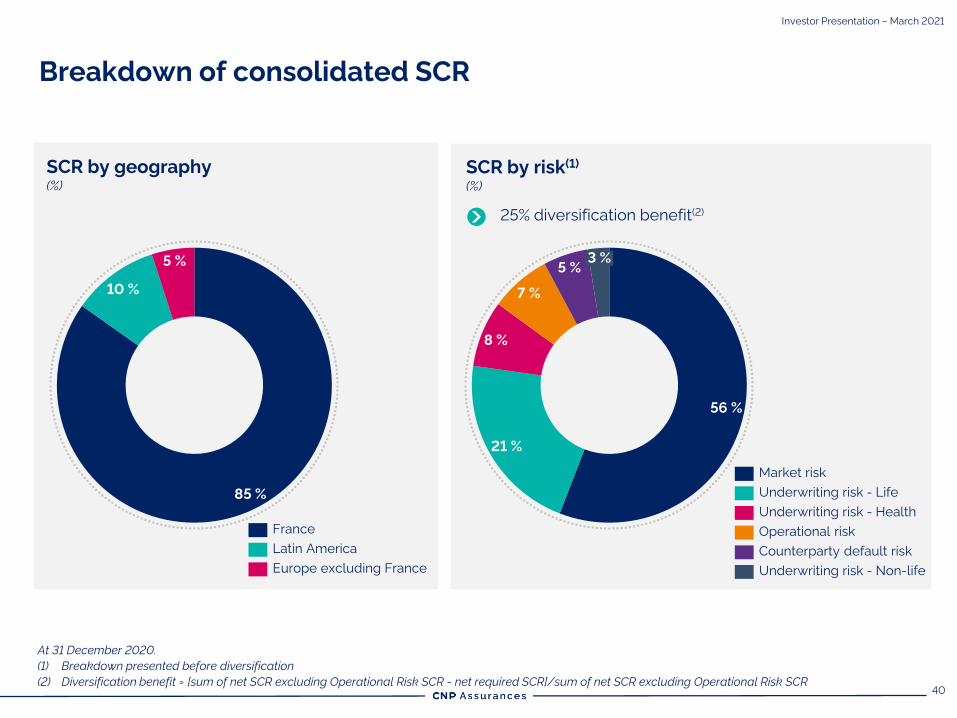
SCR by geography
(%)
At 31 December 2020.
(1) Breakdown presented before diversification
(2) Diversification benefit = [sum of net SCR excluding Operational Risk SCR - net required SCR]/sum of net SCR excluding Operational Risk SCR
SCR by risk(1)
(%)
25% diversification benefit(2)
85 %
10 %
5 %
France
Europe excluding France
Latin America
56 %
21 %
8 %
7 %
5 %3 %
Market risk
Underwriting risk - Health
Operational risk
Underwriting risk - Life
Counterparty default risk
Underwriting risk - Non-life
Breakdown of consolidated SCR
Investor Presentation – March 2021
41
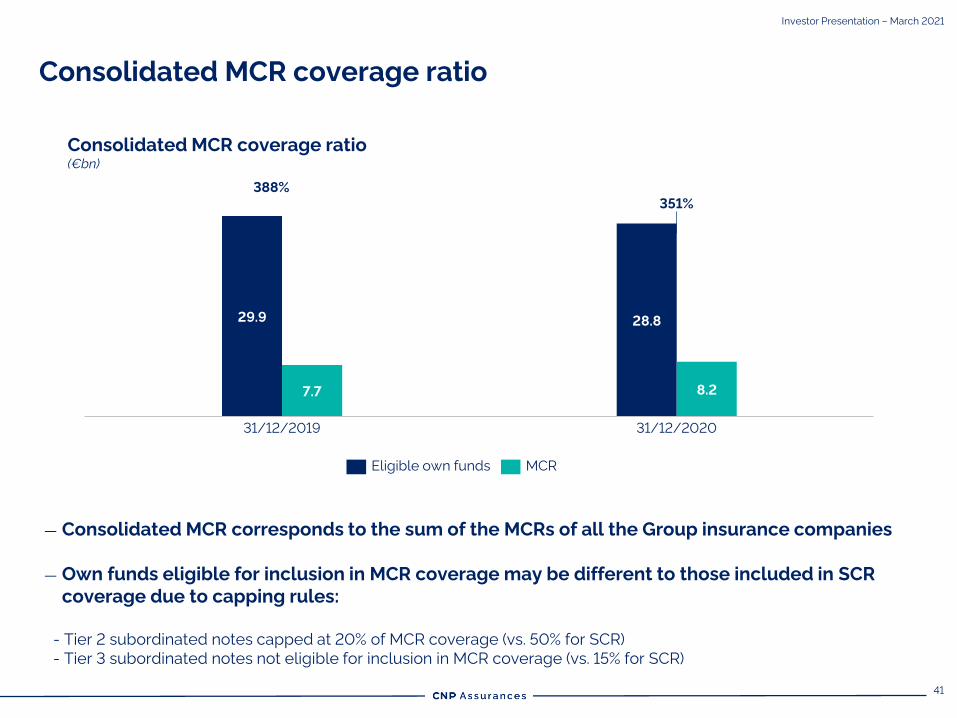
Consolidated MCR coverage ratio
(€bn)
28.8
351%
29.9
7.7
388%
8.2
31/12/2019 31/12/2020
Eligible own funds MCR
Consolidated MCR coverage ratio
Investor Presentation – March 2021
— Consolidated MCR corresponds to the sum of the MCRs of all the Group insurance companies
— Own funds eligible for inclusion in MCR coverage may be different to those included in SCR
coverage due to capping rules:
- Tier 2 subordinated notes capped at 20% of MCR coverage (vs. 50% for SCR)
- Tier 3 subordinated notes not eligible for inclusion in MCR coverage (vs. 15% for SCR)
42
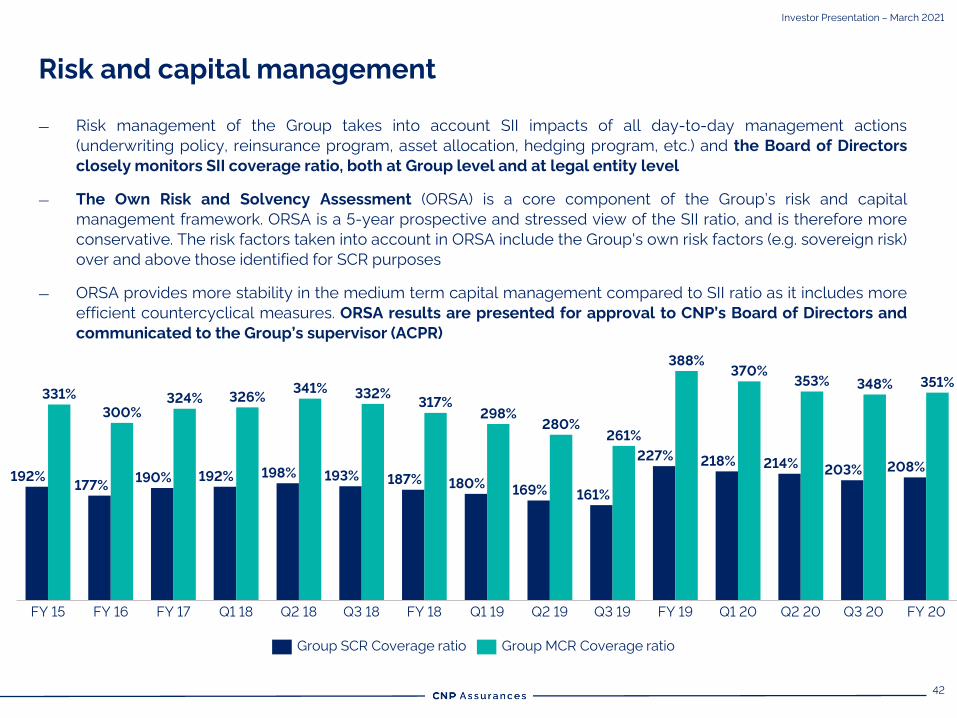
Risk and capital management
— Risk management of the Group takes into account SII impacts of all day-to-day management actions
(underwriting policy, reinsurance program, asset allocation, hedging program, etc.) and the Board of Directors
closely monitors SII coverage ratio, both at Group level and at legal entity level
— The Own Risk and Solvency Assessment (ORSA) is a core component of the Group’s risk and capital
management framework. ORSA is a 5-year prospective and stressed view of the SII ratio, and is therefore more
conservative. The risk factors taken into account in ORSA include the Group's own risk factors (e.g. sovereign risk)
over and above those identified for SCR purposes
— ORSA provides more stability in the medium term capital management compared to SII ratio as it includes more
efficient countercyclical measures. ORSA results are presented for approval to CNP’s Board of Directors and
communicated to the Group’s supervisor (ACPR)
227%
FY 16
351%
FY 15
180%
Q3 18
187%
FY 17
169%
Q1 18 FY 20FY 18
370%
190%
Q2 18 Q1 19
300%
Q2 19 Q3 19 Q3 20FY 19 Q1 20
326%
Q2 20
192%
218%
331%
177%
324%
192% 198%
341%
193%
161%
332%
261%
317%298%
280%
388%
214%
353%
203%
348%
208%
Group SCR Coverage ratio Group MCR Coverage ratio
Investor Presentation – March 2021

43
5 Rating & Funding
44
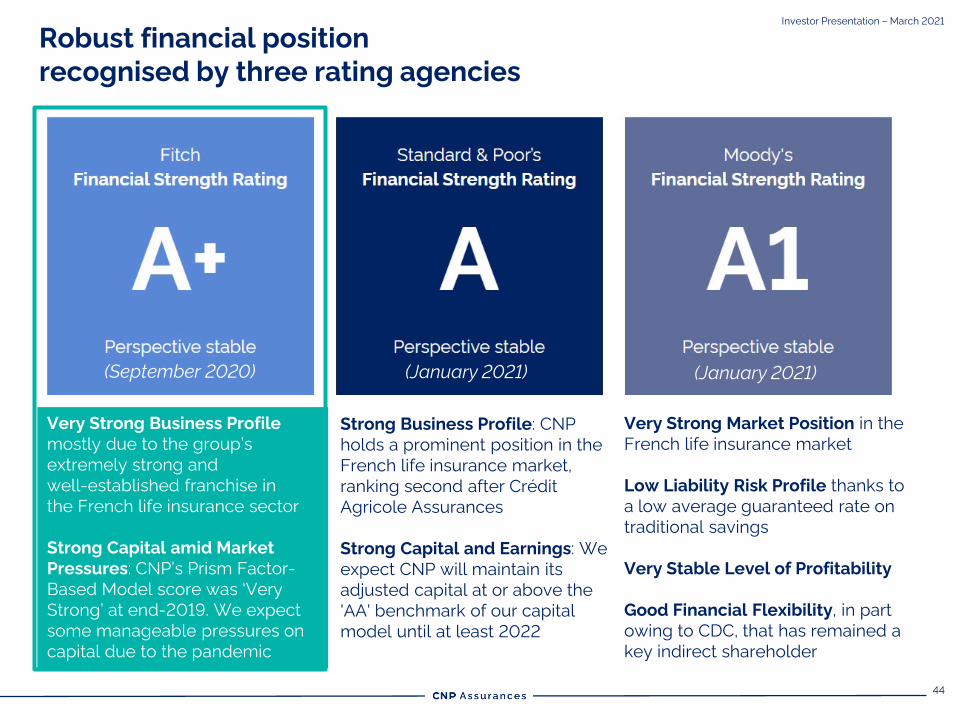
Robust financial position
recognised by three rating agencies
Investor Presentation – March 2021
Very Strong Business Profile
mostly due to the group’s
extremely strong and
well-established franchise in
the French life insurance sector
Strong Capital amid Market
Pressures: CNP’s Prism Factor-
Based Model score was ‘Very
Strong’ at end-2019. We expect
some manageable pressures on
capital due to the pandemic
Strong Business Profile: CNP
holds a prominent position in the
French life insurance market,
ranking second after Crédit
Agricole Assurances
Strong Capital and Earnings: We
expect CNP will maintain its
adjusted capital at or above the
'AA' benchmark of our capital
model until at least 2022
Very Strong Market Position in the
French life insurance market
Low Liability Risk Profile thanks to
a low average guaranteed rate on
traditional savings
Very Stable Level of Profitability
Good Financial Flexibility, in part
owing to CDC, that has remained a
key indirect shareholder
(September 2020) (January 2021) (January 2021)
45
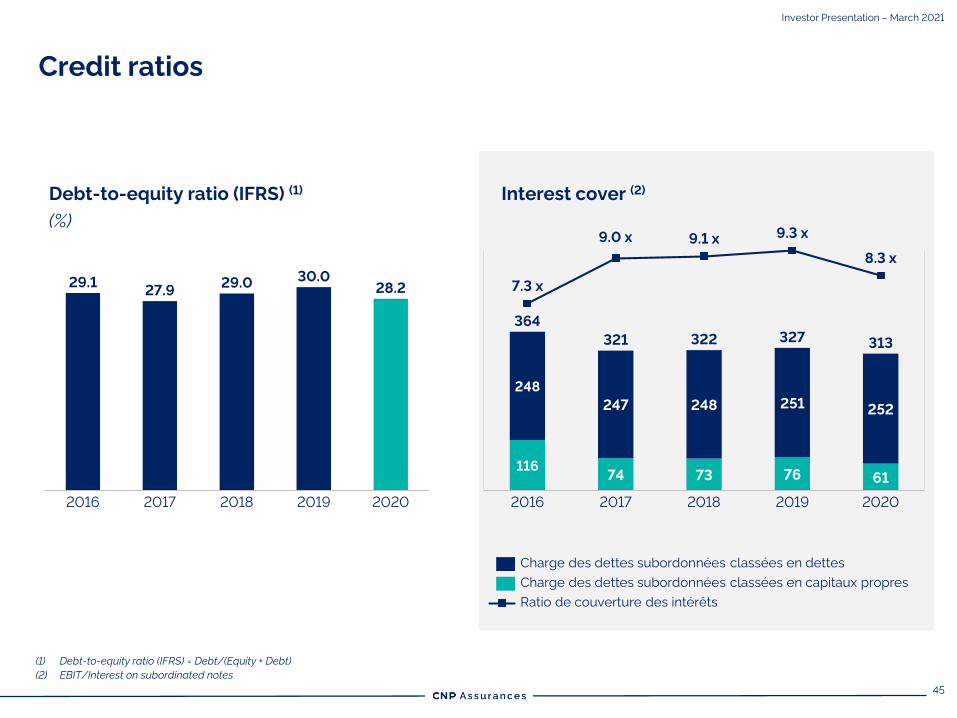
Credit ratios
(1) Debt-to-equity ratio (IFRS) = Debt/(Equity + Debt)
(2) EBIT/Interest on subordinated notes
Interest cover (2)
11674 73 76 61
248
247 248 251252
9.1 x
322
7.3 x
20192016
9.0 x
2017 2018
9.3 x
8.3 x
2020
321
364
327313
Debt-to-equity ratio (IFRS) (1)
(%)
30.0
202020172016
29.1
2018 2019
27.929.0
28.2
Charge des dettes subordonnées classées en dettes
Charge des dettes subordonnées classées en capitaux propres
Ratio de couverture des intérêts
Investor Presentation – March 2021
46
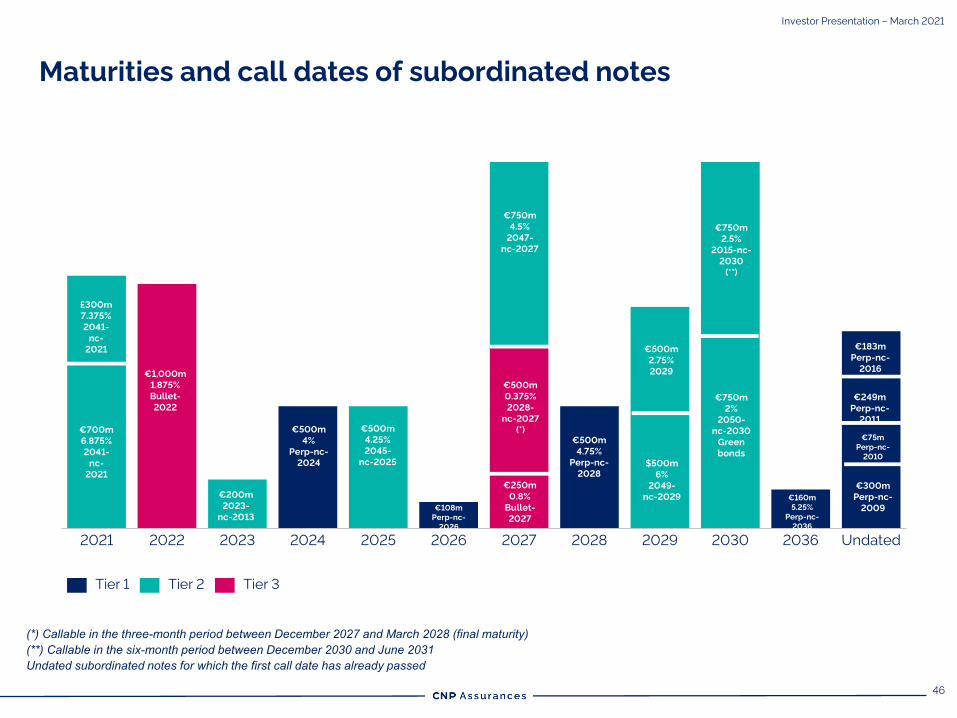
20222021 202820252023 2024 2026 2027 2029 2030 2036 Undated
(*) Callable in the three-month period between December 2027 and March 2028 (final maturity)(**) Callable in the six-month period between December 2030 and June 2031Undated subordinated notes for which the first call date has already passed
Tier 1 Tier 2 Tier 3
€200m
2023-
nc-2013
€500m
4%
Perp-nc-
2024
€500m
4.25%
2045-
nc-2025
€108m
Perp-nc-
2026
€750m
4.5%
2047-
nc-2027
$500m
6%
2049-
nc-2029 €160m
5.25%
Perp-nc-
2036
€300m
Perp-nc-
2009
€75m
Perp-nc-
2010
€249m
Perp-nc-
2011
€183m
Perp-nc-
2016
€500m
4.75%
Perp-nc-
2028
€700m
6.875%
2041-
nc-
2021
£300m
7.375%
2041-
nc-
2021
€1,000m
1.875%
Bullet-
2022
€500m
2.75%
2029
€250m
0.8%
Bullet-
2027
€750m
2%
2050-
nc-2030
Green
bonds
Maturities and call dates of subordinated notes
€500m
0.375%
2028-
nc-2027
(*)
€750m
2.5%
2015-nc-
2030
(**)
Investor Presentation – March 2021
47
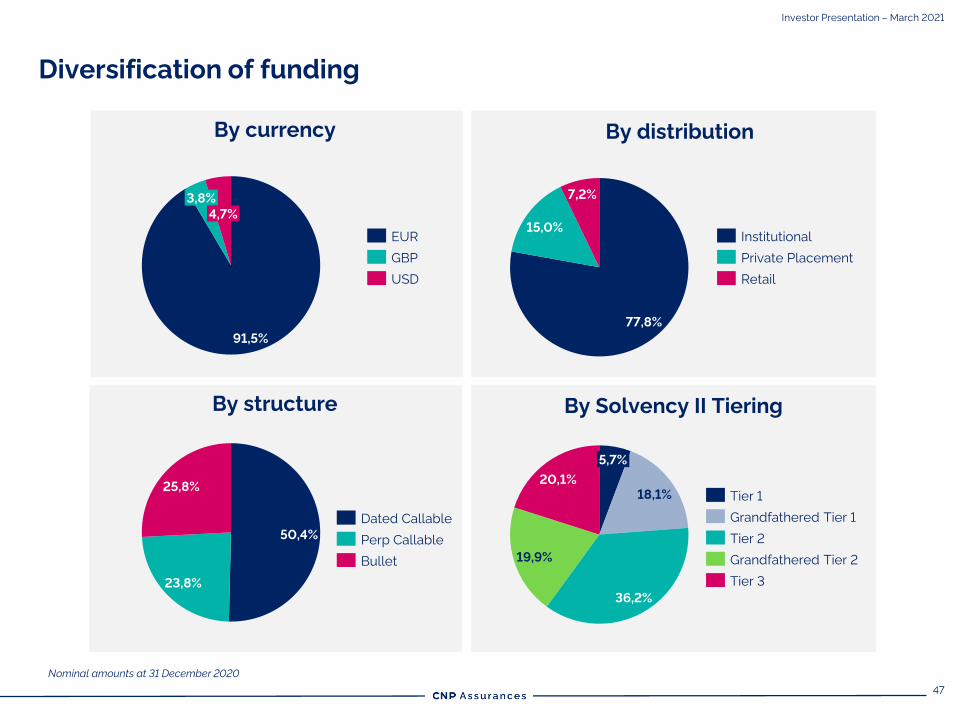
Diversification of funding
Nominal amounts at 31 December 2020
Investor Presentation – March 2021
91,5%
3,8%
4,7%
EUR
GBP
USD
By currency
77,8%
15,0%
7,2%
Retail
Institutional
Private Placement
By distribution
50,4%
23,8%
25,8%
Dated Callable
Perp Callable
Bullet
By structure
18,1%
36,2%
19,9%
20,1%
5,7%
Grandfathered Tier 1
Tier 1
Tier 2
Grandfathered Tier 2
Tier 3
By Solvency II Tiering
48
TIER 1
(€bn)
Max
= 20%
of total Tier 1
= 25%
of unrestricted Tier 1
Max
= 50%
of SCR
TIER 2 & TIER 3
(€bn)
Max
= 15%
of SCR
6,2
2,3
3,9
24,8
Max. amount
of Tier 1 debt
Unrestricted
Tier 1
Outstanding
Tier 1 debt
Tier 1 debt
issuance
capacity
16,4
8,2
5,2
1,8
1,3
Max. amount
of Tier 2&3
debt
Consolidated
SCR
Outstanding
Tier 2&3 debt
0,7
Tier 2&3 debt
issuance
capacity
Tier 3 debt
issuance
capacity
Solvency II subordinated notes issuance capacity
Investor Presentation – March 2021

49
6Corporate
Social
Responsibility
50
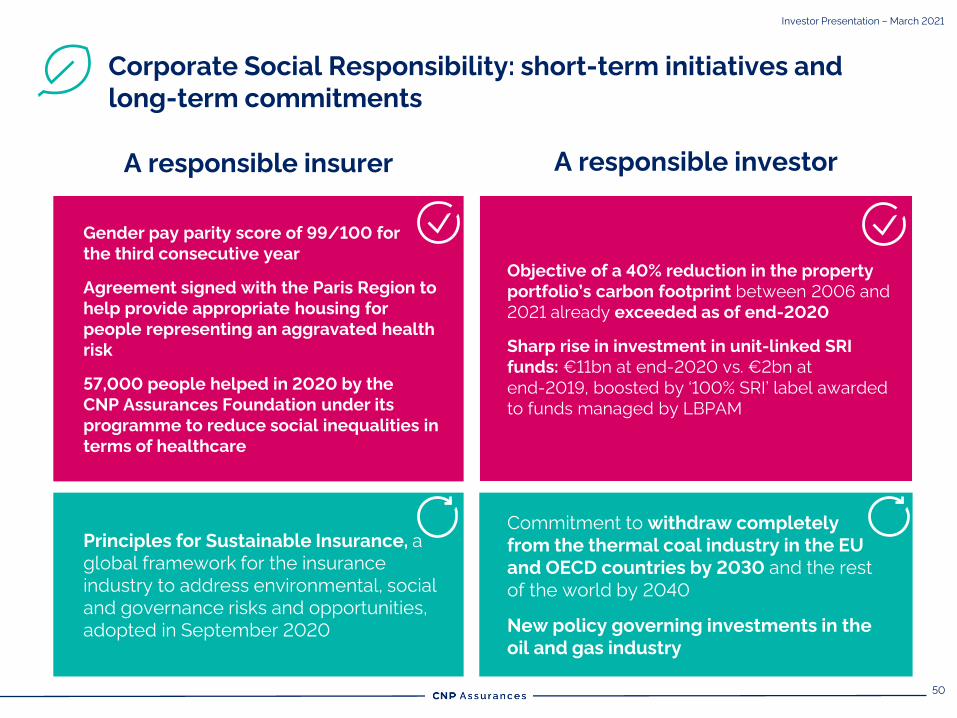
Gender pay parity score of 99/100 for
the third consecutive year
Agreement signed with the Paris Region to
help provide appropriate housing for
people representing an aggravated health
risk
57,000 people helped in 2020 by the
CNP Assurances Foundation under its
programme to reduce social inequalities in
terms of healthcare
Corporate Social Responsibility: short-term initiatives and
long-term commitments
Objective of a 40% reduction in the property
portfolio’s carbon footprint between 2006 and
2021 already exceeded as of end-2020
Sharp rise in investment in unit-linked SRI
funds: €11bn at end-2020 vs. €2bn at
end-2019, boosted by ‘100% SRI’ label awarded
to funds managed by LBPAM
A responsible investor A responsible insurer
Commitment to withdraw completely
from the thermal coal industry in the EU
and OECD countries by 2030 and the rest
of the world by 2040
New policy governing investments in the
oil and gas industry
Principles for Sustainable Insurance, a
global framework for the insurance
industry to address environmental, social
and governance risks and opportunities,
adopted in September 2020
Investor Presentation – March 2021
51
New climate objectives for the period to 2025, aligned with
the goal of making the investment portfolio carbon neutral by 2050
To help meet the Paris Agreement objective of limiting global warming to 1.5°C, CNP Assurances
has set the following measurable targets that extend the significant efforts undertaken in the
last five years:
Further 25% reduction between 2019 and 2024 in the carbon footprint (kgCO2/€k) of the
portfolio of directly held equities and corporate bonds
Further 10% reduction between 2019 and 2024 in the carbon footprint (kgCO2/sq.m.) of the
portfolio of directly held real estate
Further 17% reduction between 2019 and 2024 in the carbon intensity (kgCO2/MWh) of the
portfolio of directly held investments in electricity producers
Engage in conversations with companies and asset managers to encourage them to adopt a
1.5°C strategy before the end of 2024
The Group is committed to publishing details of its progress in meeting these objectives each year
1
2
3
4
Investor Presentation – March 2021
52
Tighter rules over investments in fossil fuels and increased
emphasis on green investments
CNP Assurances has pledged not to invest in companies operating in the industries that represent
the greatest threat to the climate and biodiversity. The ban concerns:
Direct investments in companies operating in the oil and gas industries that derive more
than 10% of their revenue from unconventional fossil fuels
Investments in greenfield or brownfield infrastructure for the extraction of unconventional
fossil fuels
Investments in greenfield oil infrastructure
Green investments to be doubled by end-2023 to €20bn:
As of end-2020, this objective was 86%-met, with green investments totalling €17.2bn
Investor Presentation – March 2021
53
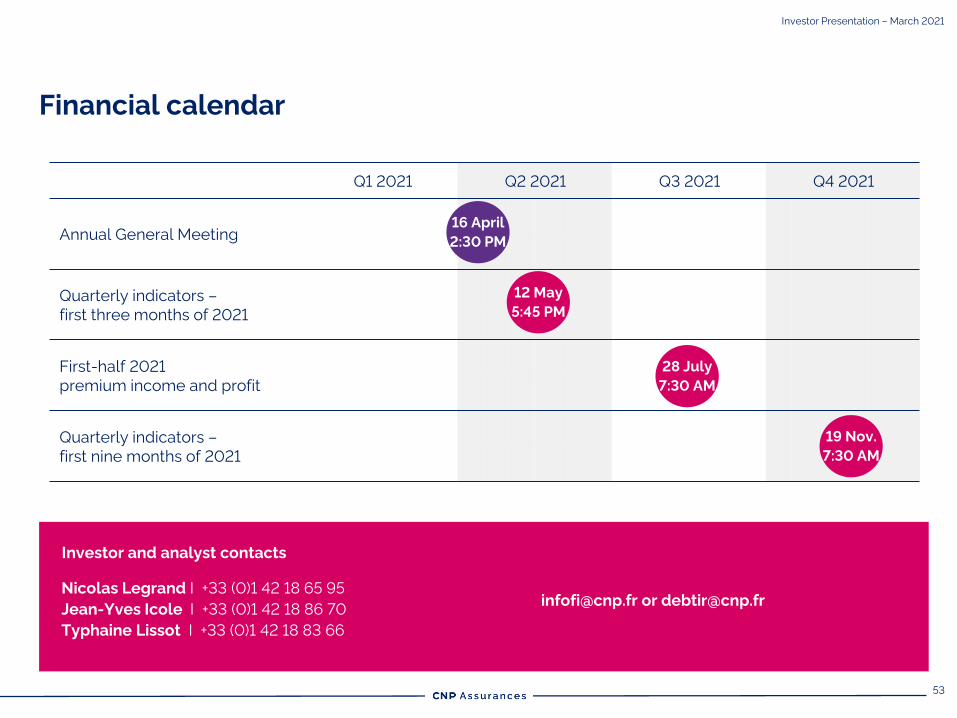
Nicolas Legrand I +33 (0)1 42 18 65 95
Jean-Yves Icole I +33 (0)1 42 18 86 70
Typhaine Lissot I +33 (0)1 42 18 83 66
[email protected] or [email protected]
Investor and analyst contacts
Q1 2021 Q2 2021 Q3 2021 Q4 2021
Annual General Meeting
Quarterly indicators –
first three months of 2021
First-half 2021
premium income and profit
Quarterly indicators –
first nine months of 2021
16 April
2:30 PM
12 May
5:45 PM
Financial calendar
28 July
7:30 AM
19 Nov.
7:30 AM
Investor Presentation – March 2021

54
7 Appendices
55
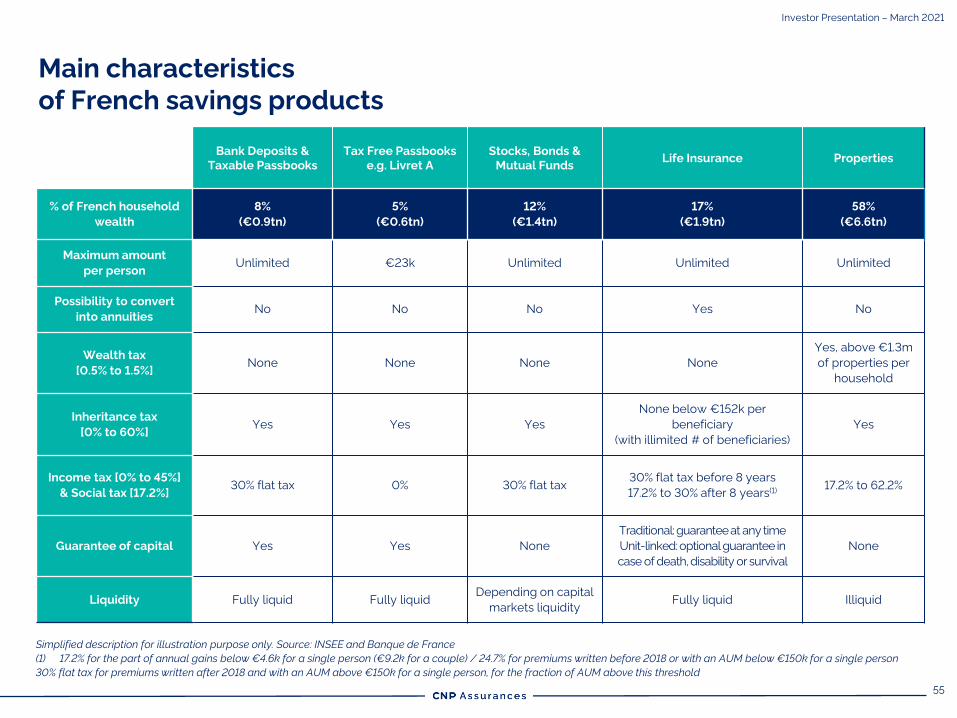
Main characteristics
of French savings products
Simplified description for illustration purpose only. Source: INSEE and Banque de France
(1) 17.2% for the part of annual gains below €4.6k for a single person (€9.2k for a couple) / 24.7% for premiums written before 2018 or with an AUM below €150k for a single person
30% flat tax for premiums written after 2018 and with an AUM above €150k for a single person, for the fraction of AUM above this threshold
Bank Deposits &
Taxable Passbooks
Tax Free Passbooks
e.g. Livret A
Stocks, Bonds &
Mutual FundsLife Insurance Properties
% of French household
wealth
8%
(€0.9tn)
5%
(€0.6tn)
12%
(€1.4tn)
17%
(€1.9tn)
58%
(€6.6tn)
Maximum amount
per personUnlimited €23k Unlimited Unlimited Unlimited
Possibility to convert
into annuitiesNo No No Yes No
Wealth tax
[0.5% to 1.5%]None None None None
Yes, above €1.3m
of properties per
household
Inheritance tax
[0% to 60%]Yes Yes Yes
None below €152k per
beneficiary
(with illimited # of beneficiaries)
Yes
Income tax [0% to 45%]
& Social tax [17.2%]30% flat tax 0% 30% flat tax
30% flat tax before 8 years
17.2% to 30% after 8 years(1)17.2% to 62.2%
Guarantee of capital Yes Yes None
Traditional: guaranteeat any time
Unit-linked: optional guarantee in
case of death, disability or survival
None
Liquidity Fully liquid Fully liquidDepending on capital
markets liquidityFully liquid Illiquid
Investor Presentation – March 2021
56
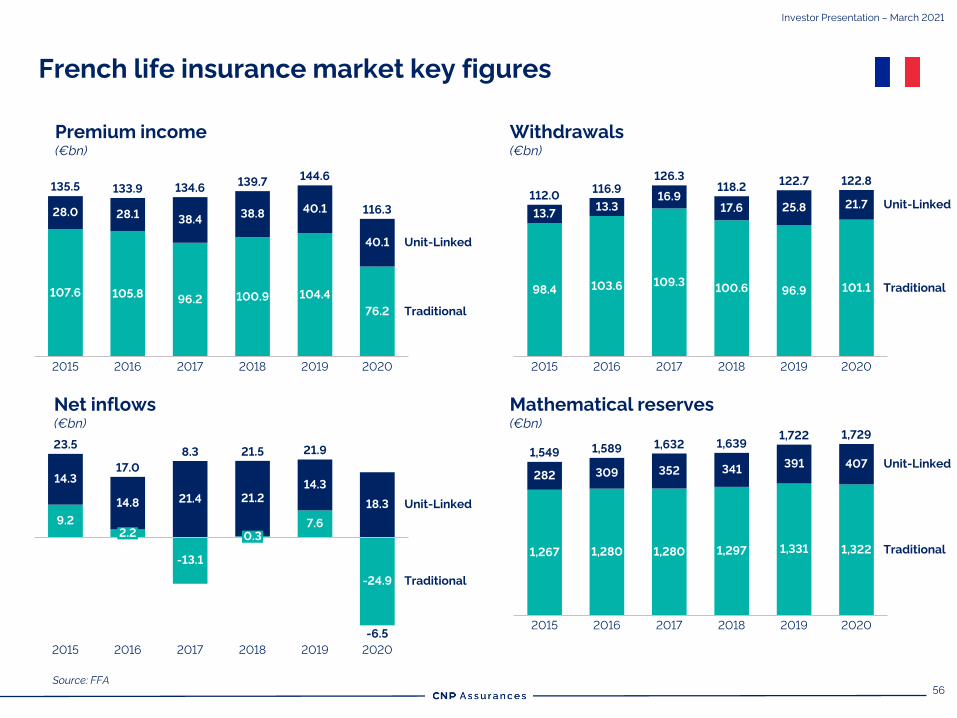
French life insurance market key figures
Net inflows
(€bn)
Mathematical reserves
(€bn)
Source: FFA
Withdrawals
(€bn)
Premium income
(€bn)
96.2105.8
28.0
107.6
134.6
2015
104.4
28.1
135.5
2016
38.4
2017
100.9
38.8
Traditional
2018
40.1
2019
76.2
40.1
2020
Unit-Linked
133.9139.7
144.6
116.3
109.398.4
2016
13.7
2015
101.1103.6
13.3
118.216.9
2017
100.6
17.6
2018
96.9
25.8
2019
21.7
116.9
2020
126.3
Traditional
Unit-Linked112.0
122.7 122.8
2016
9.2
14.3
2.2
2015
14.8
-13.1
-6.5
21.4
20192017
0.3
21.2
21.9
2018
7.6
14.3
-24.9
18.3
2020
Traditional
Unit-Linked
23.5
17.0
8.3 21.5
1,267
282
20162015
1,549
1,280
352407
1,280
309
2017
1,297
341
2018
1,331
2019
391
1,322
2020
Traditional
Unit-Linked
1,5891,632 1,639
1,722 1,729
Investor Presentation – March 2021
57
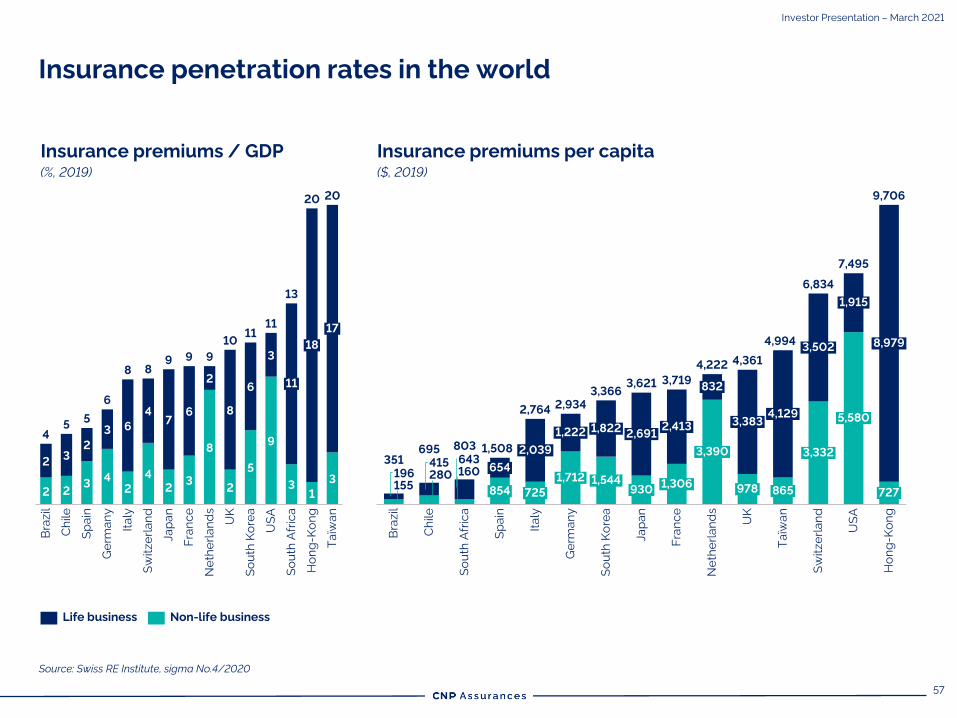
Insurance penetration rates in the world
Insurance premiums / GDP
(%, 2019)
Source: Swiss RE Institute, sigma No.4/2020
2 23
4
2
4
23
8
2
5
9
31
3
23
2
3 6
47
6
2
8
6
3
5
Ho
ng
-K
on
g
Ch
ile
11
Ge
rma
ny
Sw
itze
rla
nd
Bra
zil
10
Sp
ain
Ita
ly
Ja
pa
n
Fra
nc
e
Ne
the
rla
nd
s
8
UK
So
uth
Ko
rea
US
A
So
uth
Afr
ica
18
17T
aïw
an
4
5
6
89 9 9
13
1111
20 20
Insurance premiums per capita
($, 2019)
Life business Non-life business
155
280 160196
415 643
Bra
zil
4,222
2,934
UK
Ja
pa
n
725
2,764
Ho
ng
-K
on
g
8,979
US
A
8659781,306
Ch
ile
2,691
Ta
ïwa
n
3,390
So
uth
Afr
ica
930
654
4,129
854S
pa
in
2,039351
3,383
Ita
ly
1,222
1,712
Ge
rma
ny
1,822
1,544
5,580
Fra
nc
e
2,413
832
1,915
So
uth
Ko
rea
3,502
695 3,332
Sw
itze
rla
nd
3,366
727
803
Ne
the
rla
nd
s
3,621
4,361
3,719
4,994
6,834
7,495
9,706
1,508
Investor Presentation – March 2021
58
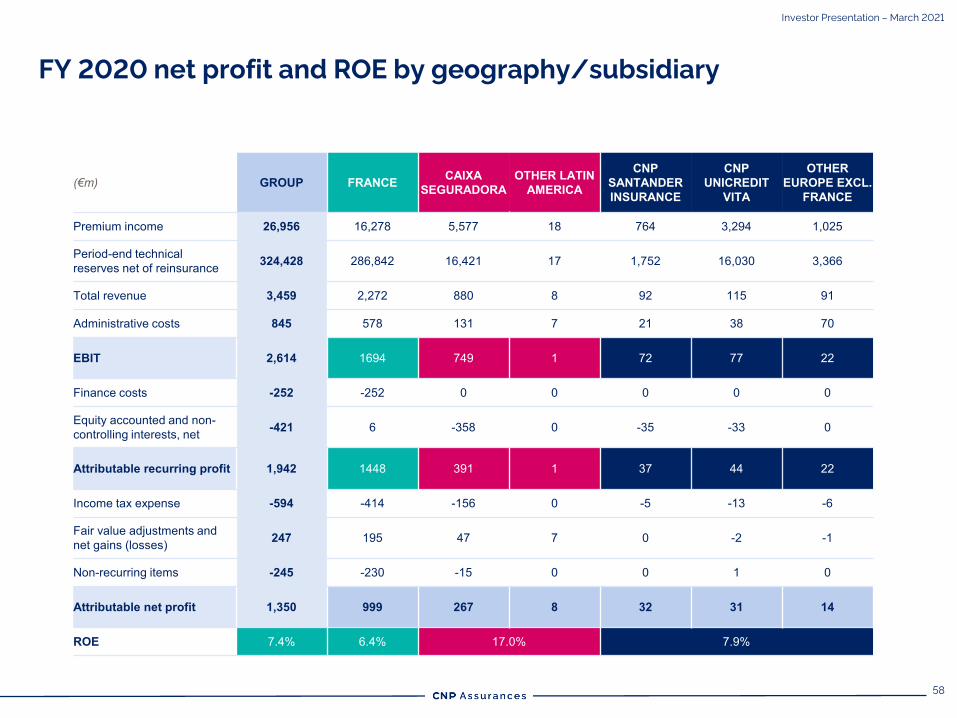
FY 2020 net profit and ROE by geography/subsidiary
Investor Presentation – March 2021
(€m) GROUP FRANCE CAIXA SEGURADORA
OTHER LATIN AMERICA
CNP SANTANDER INSURANCE
CNP UNICREDIT
VITA
OTHER EUROPE EXCL.
FRANCE
Premium income 26,956 16,278 5,577 18 764 3,294 1,025
Period-end technical reserves net of reinsurance 324,428 286,842 16,421 17 1,752 16,030 3,366
Total revenue 3,459 2,272 880 8 92 115 91
Administrative costs 845 578 131 7 21 38 70
EBIT 2,614 1694 749 1 72 77 22
Finance costs -252 -252 0 0 0 0 0
Equity accounted and non-controlling interests, net -421 6 -358 0 -35 -33 0
Attributable recurring profit 1,942 1448 391 1 37 44 22
Income tax expense -594 -414 -156 0 -5 -13 -6
Fair value adjustments and net gains (losses) 247 195 47 7 0 -2 -1
Non-recurring items -245 -230 -15 0 0 1 0
Attributable net profit 1,350 999 267 8 32 31 14
ROE 7.4% 6.4% 17.0% 7.9%
59
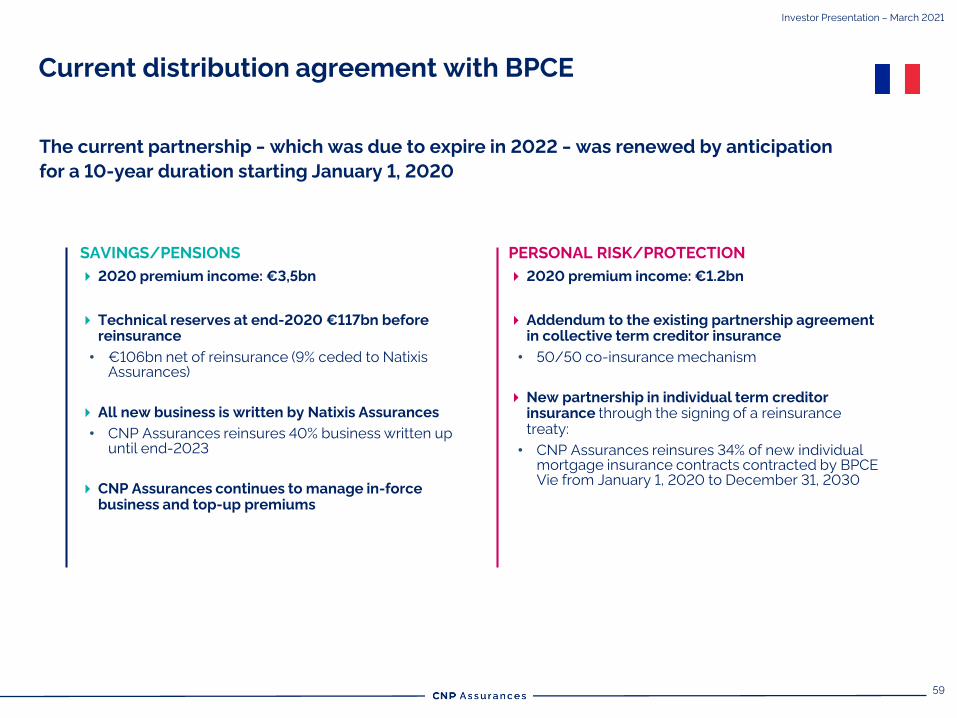
Current distribution agreement with BPCE
The current partnership ‒ which was due to expire in 2022 ‒ was renewed by anticipation
for a 10-year duration starting January 1, 2020
PERSONAL RISK/PROTECTION
2020 premium income: €1.2bn
Addendum to the existing partnership agreement
in collective term creditor insurance
• 50/50 co-insurance mechanism
New partnership in individual term creditor
insurance through the signing of a reinsurance
treaty:
• CNP Assurances reinsures 34% of new individual
mortgage insurance contracts contracted by BPCE
Vie from January 1, 2020 to December 31, 2030
SAVINGS/PENSIONS
2020 premium income: €3,5bn
Technical reserves at end-2020 €117bn before
reinsurance
• €106bn net of reinsurance (9% ceded to Natixis
Assurances)
All new business is written by Natixis Assurances
• CNP Assurances reinsures 40% business written up
until end-2023
CNP Assurances continues to manage in-force
business and top-up premiums
Investor Presentation – March 2021
60
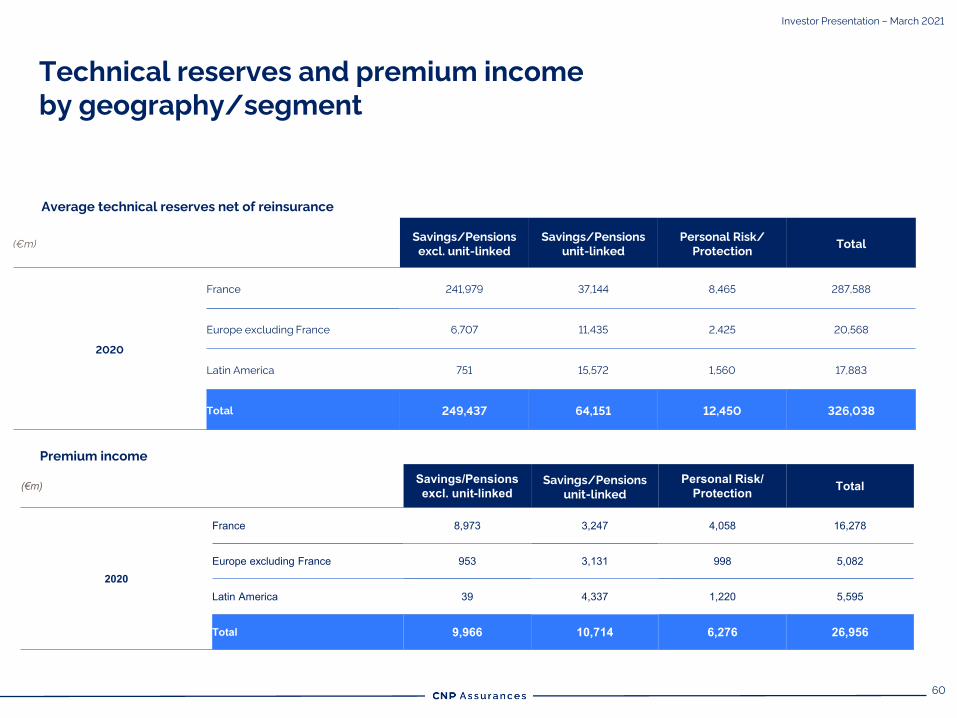
Average technical reserves net of reinsurance
Premium income
Technical reserves and premium income
by geography/segment
(€m) Savings/Pensions excl. unit-linked
Savings/Pensions
unit-linked
Personal Risk/Protection Total
2020
France 8,973 3,247 4,058 16,278
Europe excluding France 953 3,131 998 5,082
Latin America 39 4,337 1,220 5,595
Total 9,966 10,714 6,276 26,956
(€m)Savings/Pensions
excl. unit-linked
Savings/Pensions
unit-linked
Personal Risk/
Protection Total
2020
France 241,979 37,144 8,465 287,588
Europe excluding France 6,707 11,435 2,425 20,568
Latin America 751 15,572 1,560 17,883
Total 249,437 64,151 12,450 326,038
Investor Presentation – March 2021
61
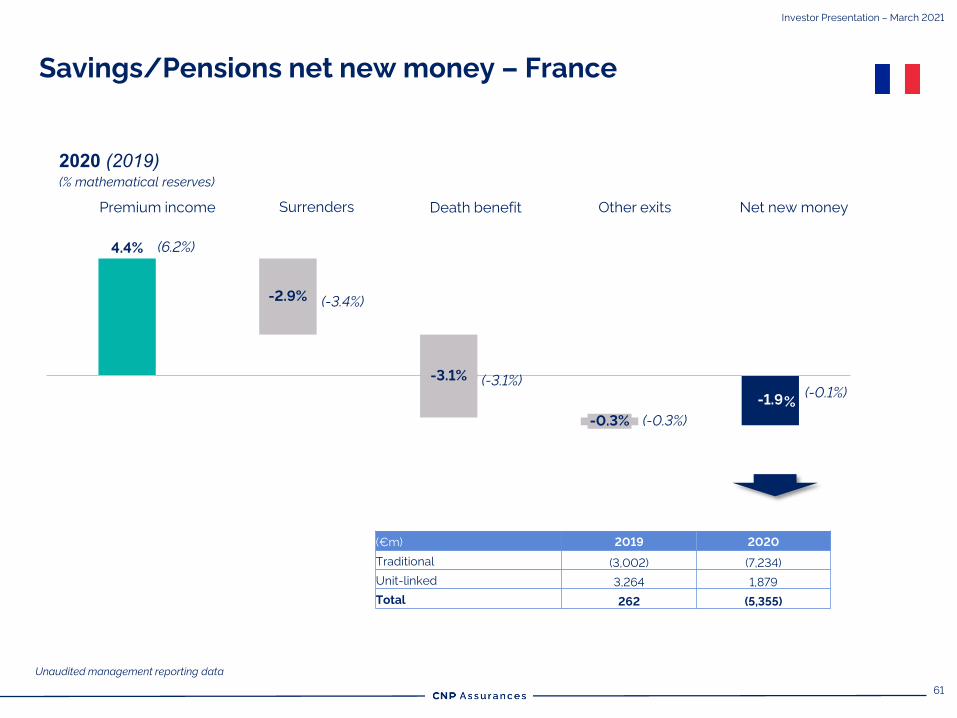
Unaudited management reporting data
Savings/Pensions net new money – France
Investor Presentation – March 2021
-1.9
-2.9%
-3.1%
-0.3%
4.4%
2020 (2019)(% mathematical reserves)
Premium income Surrenders Death benefit Other exits Net new money
(6.2%)
(-3.4%)
(-3.1%)
(-0.3%)
(-0.1%)%
(€m) 2019 2020
Traditional (3,002) (7,234)
Unit-linked 3,264 1,879
Total 262 (5,355)
62
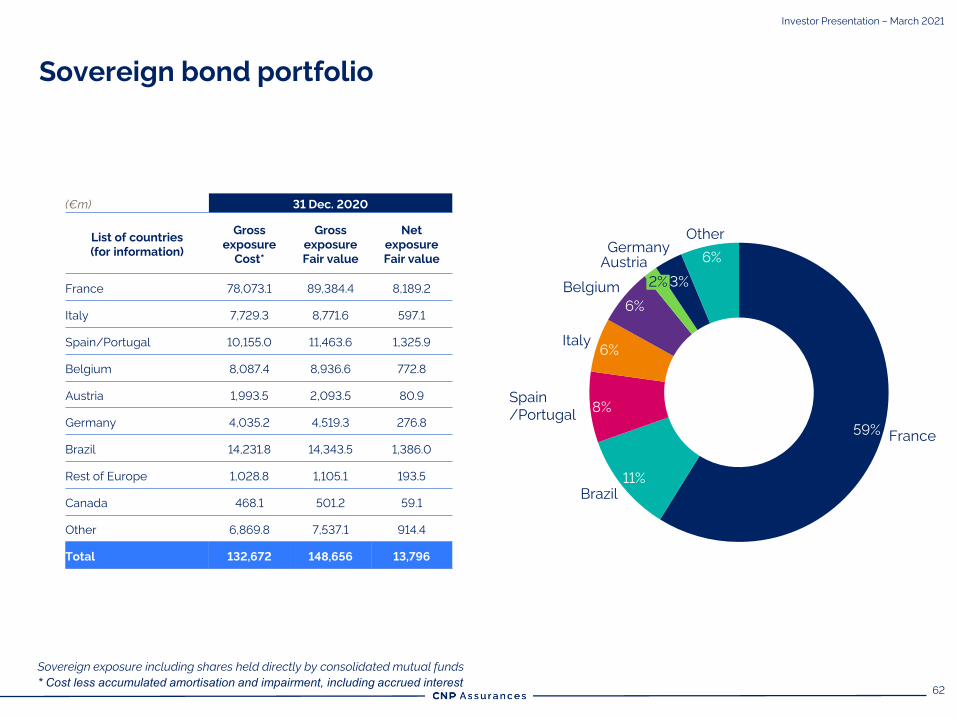
Sovereign exposure including shares held directly by consolidated mutual funds
* Cost less accumulated amortisation and impairment, including accrued interest
59%
11%
8%
6%
6%
3%
6%Germany
Austria
France
Brazil
Italy
Belgium2%
Other
Sovereign bond portfolio
Investor Presentation – March 2021
(€m) 31 Dec. 2020
List of countries
(for information)
Gross
exposure
Cost*
Gross
exposure
Fair value
Net
exposure
Fair value
France 78,073.1 89,384.4 8,189.2
Italy 7,729.3 8,771.6 597.1
Spain/Portugal 10,155.0 11,463.6 1,325.9
Belgium 8,087.4 8,936.6 772.8
Austria 1,993.5 2,093.5 80.9
Germany 4,035.2 4,519.3 276.8
Brazil 14,231.8 14,343.5 1,386.0
Rest of Europe 1,028.8 1,105.1 193.5
Canada 468.1 501.2 59.1
Other 6,869.8 7,537.1 914.4
Total 132,672 148,656 13,796
Spain
/Portugal
63
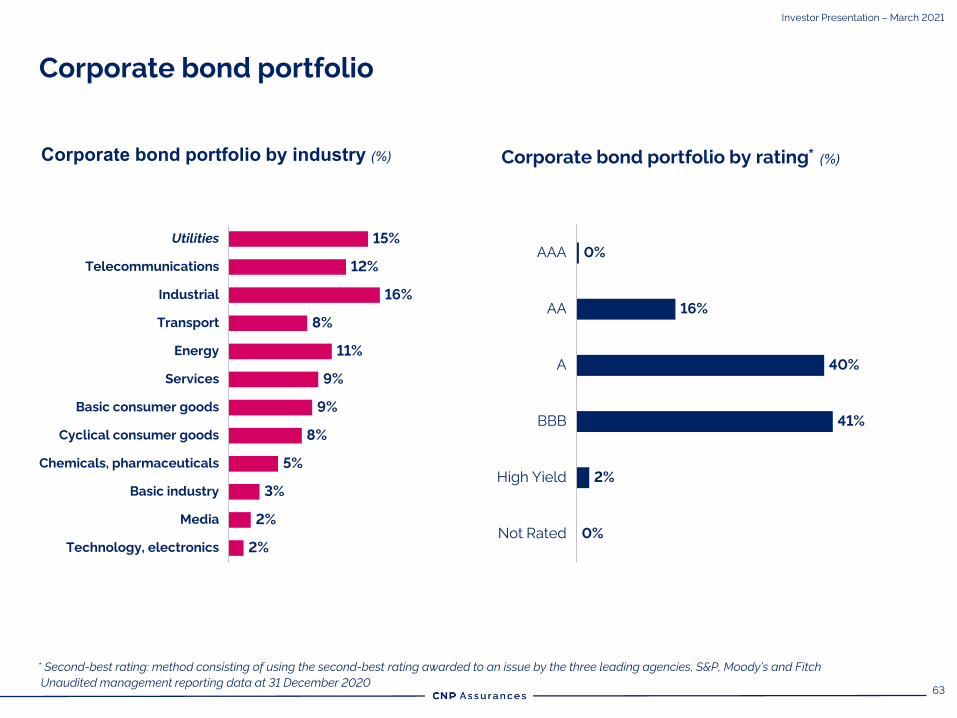
* Second-best rating: method consisting of using the second-best rating awarded to an issue by the three leading agencies, S&P, Moody’s and Fitch
Unaudited management reporting data at 31 December 2020
Corporate bond portfolio
Investor Presentation – March 2021
Corporate bond portfolio by industry (%) Corporate bond portfolio by rating* (%)
2%
Cyclical consumer goods
5%
Energy
Basic consumer goods
Chemicals, pharmaceuticals
Utilities
Telecommunications
Industrial
Transport
Services
Basic industry
Media
Technology, electronics
15%
12%
16%
8%
11%
9%
9%
8%
3%
2%
BBB
AAA 0%
AA
A 40%
High Yield
Not Rated
16%
41%
2%
0%
64
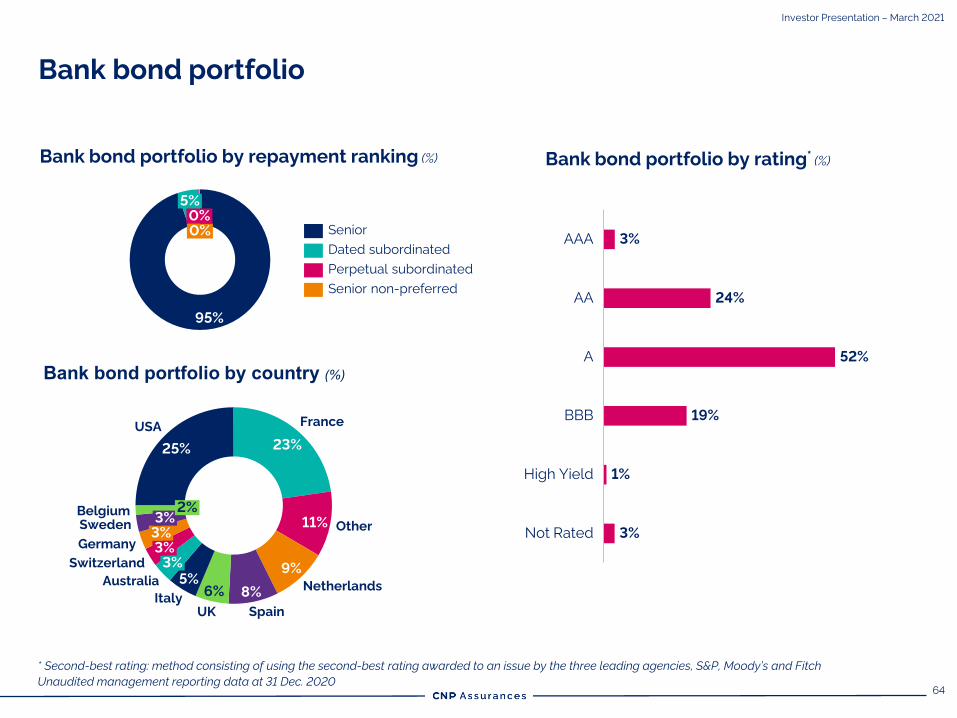
* Second-best rating: method consisting of using the second-best rating awarded to an issue by the three leading agencies, S&P, Moody’s and Fitch
Unaudited management reporting data at 31 Dec. 2020
Bank bond portfolio
Investor Presentation – March 2021
Bank bond portfolio by repayment ranking (%)
Bank bond portfolio by country (%)
AAA
24%
High Yield
A
AA
BBB
Not Rated
3%
52%
19%
1%
3%
25% 23%
11%
9%
8%6%5%
Italy
Australia
Other
USAFrance
3%
Netherlands
SpainUK
3%
Switzerland
3%Germany
3%Sweden
2%Belgium
95%
0%
5%
0%
Senior non-preferred
Senior
Perpetual subordinated
Dated subordinated
Bank bond portfolio by rating* (%)
65
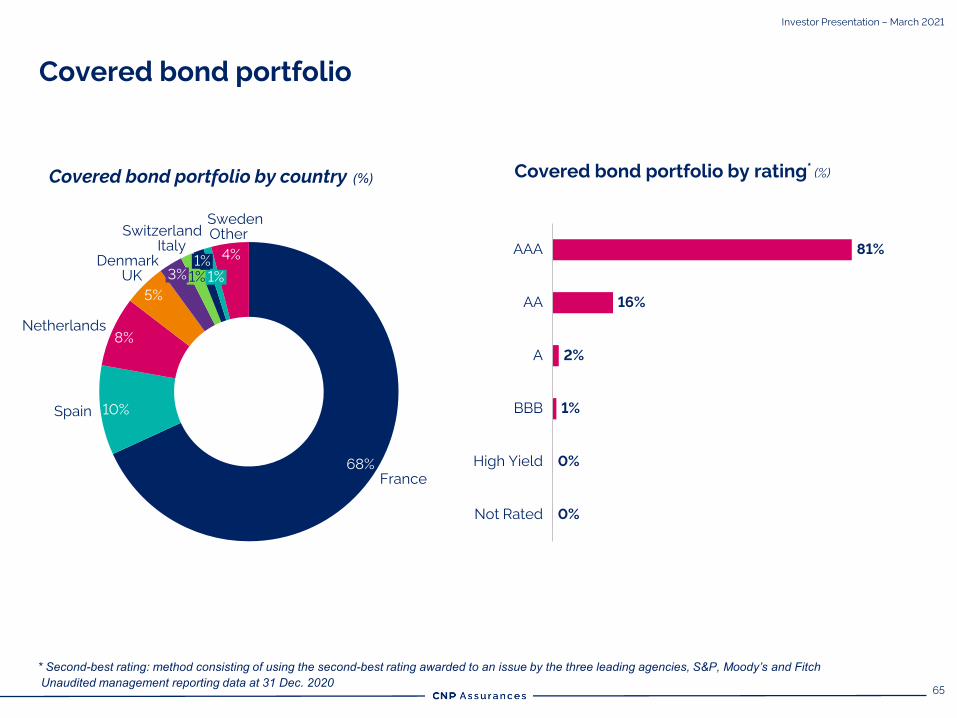
Covered bond portfolio by rating* (%)Covered bond portfolio by country (%)
AAA 81%
1%
High Yield
A
AA
Not Rated
BBB
16%
2%
0%
0%
* Second-best rating: method consisting of using the second-best rating awarded to an issue by the three leading agencies, S&P, Moody’s and FitchUnaudited management reporting data at 31 Dec. 2020
68%
10%
8%
5%
4%
1%
Netherlands
France
Spain
UK
Denmark
3%
Italy
1%
Switzerland
1%
Sweden
Other
Covered bond portfolio
Investor Presentation – March 2021
66
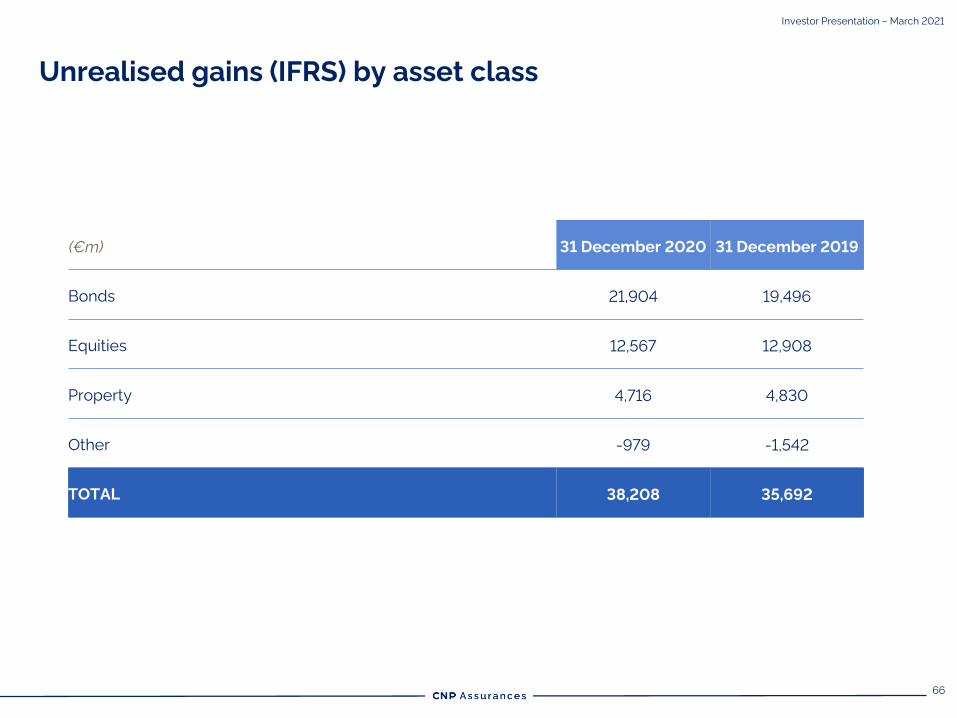
Unrealised gains (IFRS) by asset class
(€m) 31 December 2020 31 December 2019
Bonds 21,904 19,496
Equities 12,567 12,908
Property 4,716 4,830
Other -979 -1,542
TOTAL 38,208 35,692
Investor Presentation – March 2021
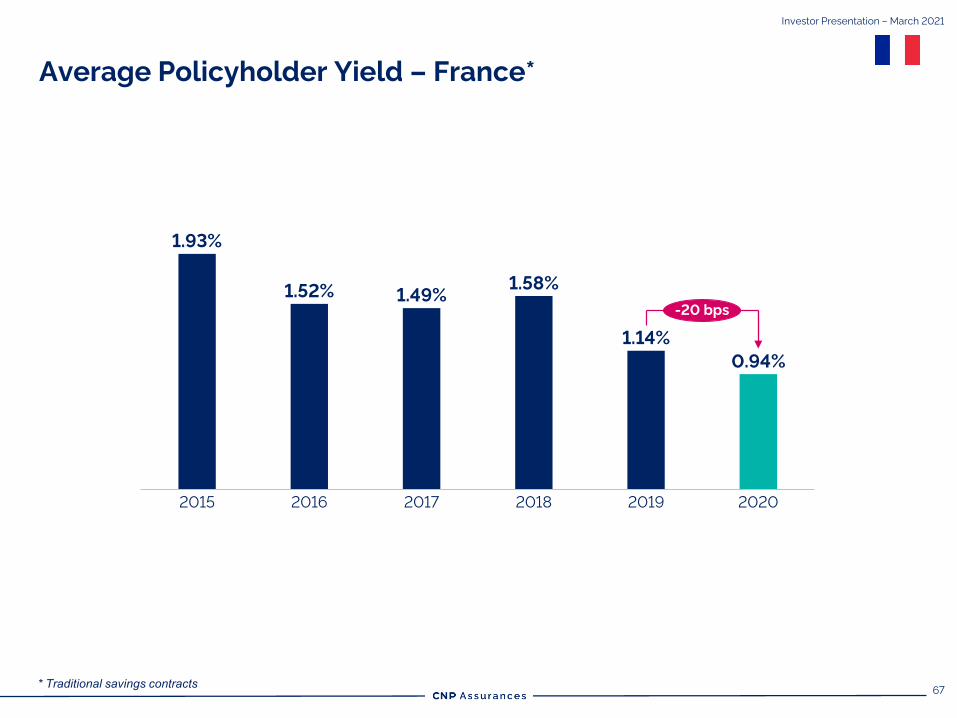
67* Traditional savings contracts
2016 2017 20182015 2019 2020
1.93%
1.52% 1.49%1.58%
1.14%
0.94%
-20 bps
Average Policyholder Yield – France*
Investor Presentation – March 2021