Investor Presentation - CLP Group | Energy for Brighter ... · 4 Strong industry fundamentals One...
33
April 2012 Investor Presentation
Transcript of Investor Presentation - CLP Group | Energy for Brighter ... · 4 Strong industry fundamentals One...

April 2012
Investor
Presentation

2
Agenda
1. TRUenergy overview
2. Retail scale and quality
3. Diverse generation portfolio supported by
strong fuel position
4. Strong financial position
5. Recent corporate activity
TRUenergy Overview

4
Strong industry fundamentals
One of Australia’s largest gas and electricity utilities
Vertically integrated, diversified portfolio provides earnings stability
Outstanding track record of earnings growth through disciplined acquisition and
organic growth
Low cost generation portfolio is well positioned for upside through rising
wholesale prices
Extensive pipeline of development opportunities in retail and generation
Financial strength and flexibility
Well positioned for a low carbon economy driving efficient energy use
Highly experienced management team and Board
TRUenergy Overview

5
Ownership Hong Kong listed CLP Holdings Limited
Total Assets A$9.3b
Gross Debt A$2.4b
Revenue* A$6.9b (12 months to 31 Dec 2011)
EBITDAF* A$1,047m (normalised) (12 months to 31 Dec 2011)
NPAT* A$355m (normalised) (12 months to 31 Dec 2011)
Employees 1,285 FTE
Capacity Total installed capacity under management of 5,613 MW
Customers 2.8m accounts
TRUenergy has evolved to be one of Australia’s leading vertically integrated and diversified energy companies
Tallawarra Power
Station
(MW)
Tallawarra Power
Station
(420MW)
Hallett Power
Station
(203MW)
Cathedral Rocks
(66/33MW)
QLD Retail
63,000 accounts
Yallourn Power
Station and Coal Mine
(1,480MW)
Ecogen Hedge
(up to 966MW)
Gas Storage Facility
(22PJ Storage;
500TJ/d Processing)
Brisbane
Melbourne
Sydney Adelaide
SA Retail
0.2 million accounts
QLD Retail
0.1 million accounts
VIC Retail
1.2 million accounts
NSW/ACT Retail
1.4 million accounts
Waterloo
(111MW)
20% interest in Narrabri
(500PJ) Delta West
GenTrader
(2,400MW))
As at 31 December 2011
Power generation
The largest privately held supplier of generation output to the National
Electricity Market (“NEM”)
Diversified and reliable owned and contracted fuel supplies
Retail electricity and gas
Australia’s third largest energy retailer
Market share of 22% across Eastern Australia
Gas processing and storage
Owns the largest underground gas storage facility in Australia
Long-term gas storage contracts
Company Overview
Financial and Operational Overview (as at 31 Dec 2011)
* Includes only 10 months contribution from EnergyAustralia and Delta West Gentrader
A strong portfolio of diversified assets

6
Notes 1. As at 31 December 2011 2. TRUenergy analysis; Company presentations; Electricity Statement of Opportunities for the National Electricity Market 2011, Australian Energy Market Operator 3. Based on control and ownership of output; ORG includes Mortlake; AGL includes 32.5% of Loy Yang A (“LYA”); On 24 February 2012, AGL announced its intention to acquire the
remaining interest in LYA, should this transaction be successful, AGL’s generation capacity and output would increase to 5,377MW and 19,519GWh, respectively 4. 12 months to 30 June 2011; Inclusive of full year generation for Eraring, Shoalhaven, Mount Piper and Wallerawang 5. Total Registered Capacity with Australian Energy Market Operator
AGL Origin TRUenergy
# Mass Market Customers (‘000’s)(1)
Electricity 2,013 3,075 1,967
Gas 1,382 950 840
Generation Capacity (MW)(1,2,3,5) 3,906 5,784 5,613
Generation Output (GWh)(2,3,4) 9,148 17,596 29,603
Total capitalisation at 31 December 2011
(A$m book net debt + equity) 7,335 17,269 6,763
S&P / Moody’s Credit Ratings BBB (Negative) / – BBB+ (Stable) / Baa1 (Neg) BBB (Stable) / –
A scale player in the industry following acquisitions in NSW
NEM-wide Generation Capacity (MW)(1,2,3,5) NEM-wide Energy output (GWh) (2,3,4)
National Market Share % / Million Customers
Electricity & Gas Retail Customers(1,2)
TRUenergy is the national No. 1 generator by output and No. 3 energy retailer
4.0
3.4
2.82.3
-
1
2
3
4
5
Origin AGL TRU Other
32%
27% 22%
18%
15.7%
11.3% 11.1% 10.0% 9.7% 9.3%
4.9%
-
4.0%
8.0%
12.0%
16.0%
20.0%
TRU MacGen Stanwell CS Energy
Int. Power
Origin AGL
Private sector Government owned
5,784 5,6134,690 4,358 4,251 3,906
3,033
-
2,000
4,000
6,000
8,000
Origin TRU MacGen Snowy Hydro
Stanwell AGL Int. Power
Private sector Government owned
7
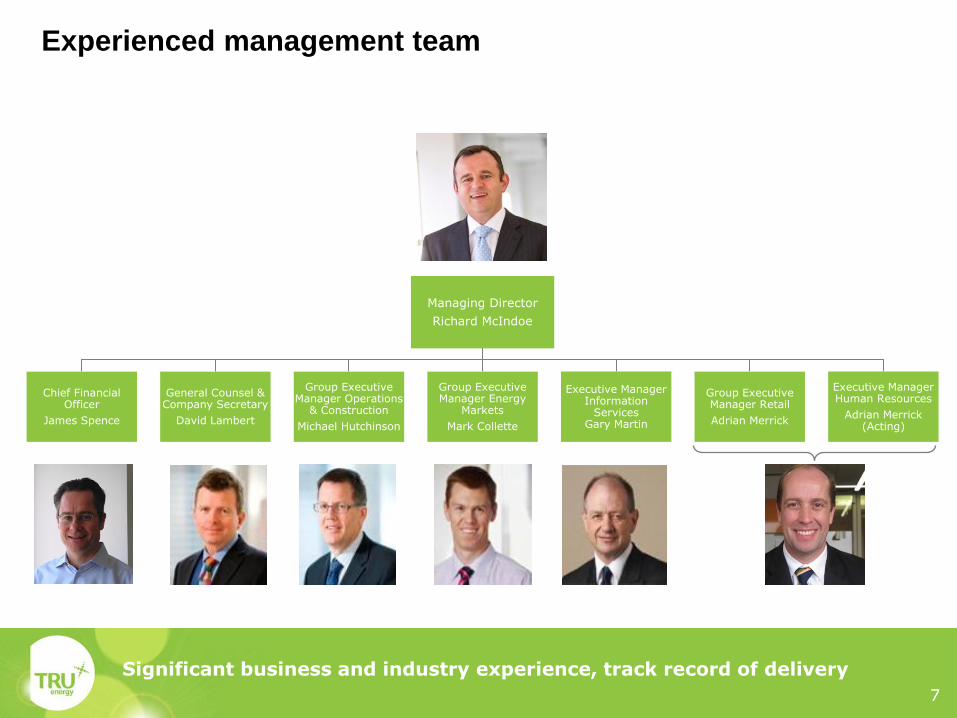
Managing Director
Richard McIndoe
Chief Financial Officer
James Spence
General Counsel & Company Secretary
David Lambert
Group Executive Manager Operations
& Construction
Michael Hutchinson
Group Executive Manager Energy
Markets
Mark Collette
Executive Manager Information
Services Gary Martin
Group Executive Manager Retail
Adrian Merrick
Executive Manager Human Resources
Adrian Merrick (Acting)
Experienced management team
Significant business and industry experience, track record of delivery

8
TRUenergy has evolved from a base load generator to a fully
integrated energy company
A clear strategy has resulted in a unique group of assets which fit the long term vision
Standalone Generator
Fully Integrated
Vertical Integration
Horizontal Integration
Base load brown coal
generator
Some vertical integration
through AusPower and
retailer contracts
Risks associated with single
generator in a single
market, long generation
position
Generation expansion
through acquisition, merger
and Greenfield development
Portfolio of generating
capacity in different states,
different fuel types, across
the merit order
Expansion of the I&C
business through AusPower
to track generation growth
Acquired direct interest in
mass market retailer
Creation of a horizontally
and vertically integrated
company
Generation and retail across
states
Australia’s third largest
energy retailer
Inv
estm
en
t
Time
Acquisition of NSW
assets 2011
Tallawarra site
commissioned 2009 Acquisition of Merchant
Energy Business 2005
Acquisition of Yallourn 2001
Iona expansion 2009
Acquisition of Narrabri
(20%)
Acquisition of Roaring
40s Wind Assets

9
Vertical integration is the key strategic driver
Mass Market
Retail Load
Sold
Contracts
Load
Swing
National Electricity
Market
Generation
Energy
Bought
Contracts
Electricity
Operations &
Construction Energy Markets
Hallett
Tallawarra
Ecogen
Yallourn
Electricity
Channels to Market
Mass Market Retail
Business Retail
Generation
Capacity
Reta
il
Energ
y M
ark
ets
I&C/Business Load
Balanced Capacity
Balanced Energy
Available for Sale Sales
Mt Piper & Wallerawang Pricing, forecasting & green certificates
Outage planning, bidding & dispatch
The TRUenergy portfolio is well balanced with significant scale and diversity

10
TRUenergy value chain
Fuel Wholesale MarketsRetail
Markets
Gas Market
Electricity Market
TRUenergy Business Units
Operations and ConstructionEnergy Markets
Retail
Yallourn Coal Mine
Coal Contracts
Iona Gas Processing and
Storage
Tallawarra
Hallett
Ecogen
Yallourn
Delta West
Mass Market and Business
customer segments
Mass Market and Business
customer segments
Hedging
Wholesale (pool)
Contracts
Wholesale Market
Industrial Contracts
Industrial Contracts
Hedging
Gas Supply / Transportation
Contracts
Waterloo
Cathedral Rocks
Wind
Narrabri CSM
Gas Supply / Transportation
Contracts
Narrabri CSM
11
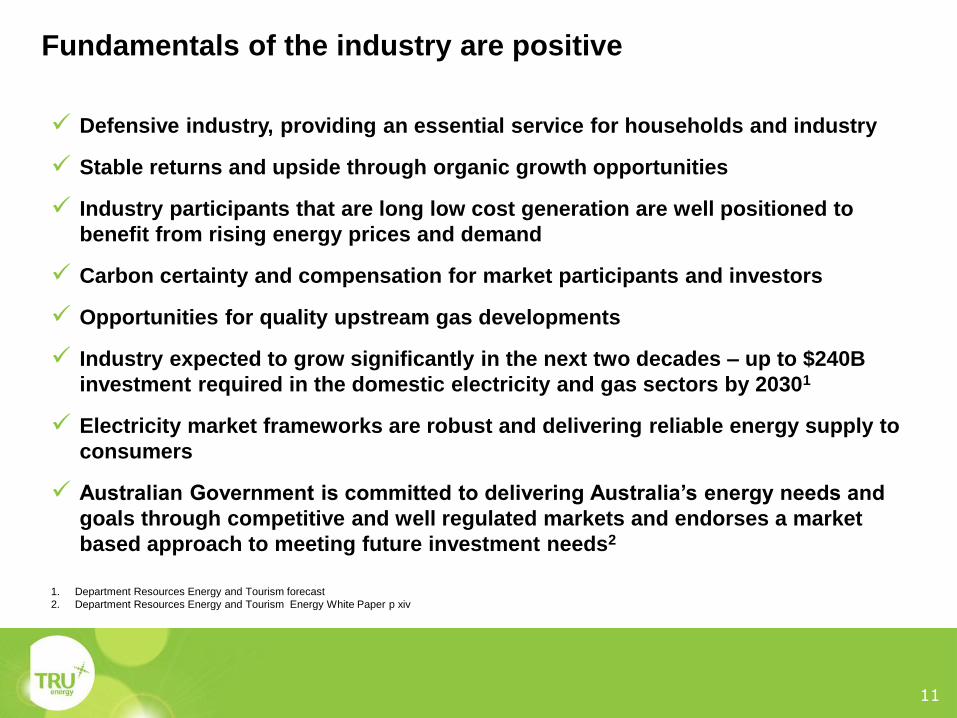
Defensive industry, providing an essential service for households and industry
Stable returns and upside through organic growth opportunities
Industry participants that are long low cost generation are well positioned to
benefit from rising energy prices and demand
Carbon certainty and compensation for market participants and investors
Opportunities for quality upstream gas developments
Industry expected to grow significantly in the next two decades – up to $240B
investment required in the domestic electricity and gas sectors by 20301
Electricity market frameworks are robust and delivering reliable energy supply to
consumers
Australian Government is committed to delivering Australia’s energy needs and
goals through competitive and well regulated markets and endorses a market
based approach to meeting future investment needs2
Fundamentals of the industry are positive
1. Department Resources Energy and Tourism forecast
2. Department Resources Energy and Tourism Energy White Paper p xiv

12
Key business strengths
Robust financial position and strong
credit metrics supporting
investment grade rating
Proven strong debt market and
shareholder support
Clear carbon strategy and
actively managed environmental
issues
Sound operating performance
Experienced management team
Horizontally diversified retail and generation portfolio
and fuel base
Vertically integrated business model
provides a natural hedge
Strong market position
TRUenergy

Retail Scale and Quality

14
NSW
~32% of market
Victoria
~25% of market
South Australia
~12% of market
Queensland
~5% of market
TRU
948
EA
200
TRU
97
EA
1,307
TRU
65
EA
31
TRU
157
One of Australia’s largest gas and electricity utilities
22% share of the NEM, #3 provider
Over 2.8m customer accounts, comprising 2.0m electricity and
0.8m gas accounts
Geographically diversified customer base across the NEM
High quality, recognised retail brands
EnergyAustralia and TRUenergy are trusted brands with a
reputation for efficiency and service
Significant organic growth opportunities in
Queensland and South Australia
Ability to flex sales effort in these states according to value
opportunities
Positioned to leverage growth in retail gas
Able to leverage existing NSW electricity customers into new
retail gas accounts
The combined business of EnergyAustralia and TRUenergy creates a truly national leader with ~22% share of the NEM
TRUenergy has a market leading position in the NEM
As at 31 December 2011
15
Integration activities have progressed well to date
Integration Management
The migration of EnergyAustralia customer accounts to TRUenergy management and systems is supported by a large
and coordinated Integration Program
During the transition period EnergyAustralia customer accounts are managed in collaboration with the former owner,
Ausgrid, under a Transition Services Agreement (TSA). The TSA is in place for up to 36 months until the services are
transitioned to in-house TRUenergy management
The EnergyAustralia Integration Program and TSA are ensuring that the full value of the acquisition is realised
Operational Performance
All service levels defined within the TSA have been met each month since the acquisition
Ausgrid’s operational performance compares well to others in the market
The transition to TRUenergy of work packages including sales and marketing, load forecasting, and wholesale
settlements was completed in 2011 ahead of schedule, with access to Ausgrid systems maintained for customer
acquisition and retention
Work is underway to prepare for data migration and banking changeover, to support a smooth transition of cash flows and
data by the end of the TSA and integration period

Diverse generation portfolio supported by strong fuel position
17
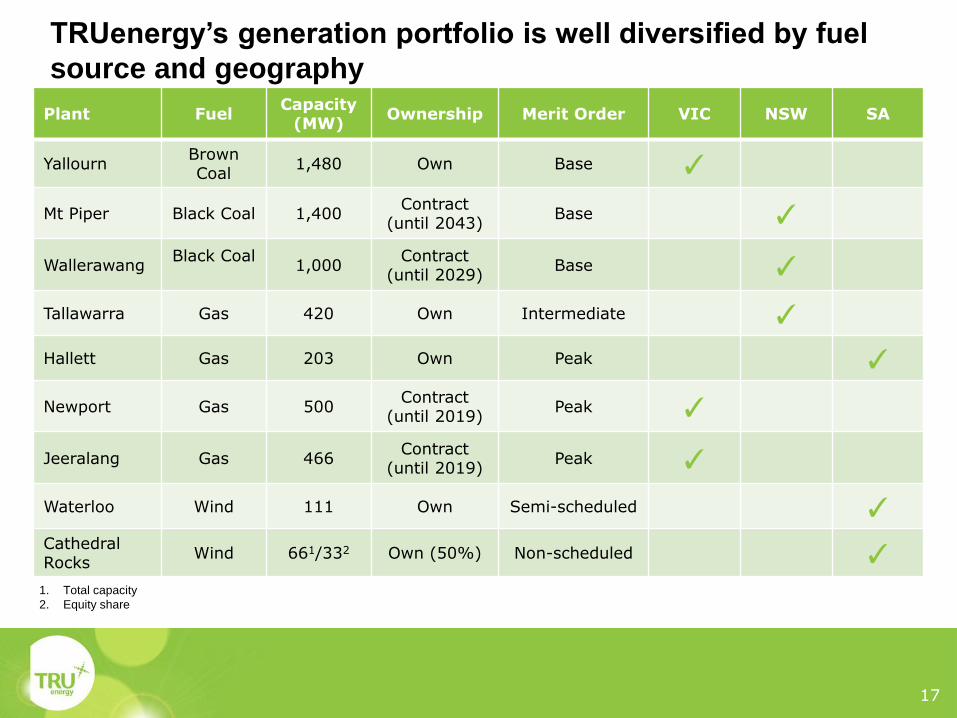
TRUenergy’s generation portfolio is well diversified by fuel
source and geography
Plant Fuel Capacity
(MW) Ownership Merit Order VIC NSW SA
Yallourn Brown Coal
1,480 Own Base ✓
Mt Piper Black Coal 1,400 Contract
(until 2043) Base ✓
Wallerawang Black Coal
1,000
Contract (until 2029)
Base ✓
Tallawarra Gas 420 Own Intermediate ✓
Hallett Gas 203 Own Peak ✓
Newport Gas 500 Contract
(until 2019) Peak ✓
Jeeralang Gas 466 Contract
(until 2019) Peak ✓
Waterloo Wind 111 Own Semi-scheduled ✓ Cathedral Rocks
Wind 661/332 Own (50%) Non-scheduled ✓ 1. Total capacity
2. Equity share

18
Fuel Plant Fuel Arrangement
Brown Coal Yallourn TRUenergy owns the brown coal mine adjacent to power
station Operating licence to 2026 and reserves beyond 2032
Black Coal
Mt Piper Portfolio of long term coal supply contracts through to 2029 Diversity of coal supply from different mines Volume flexibility in existing supply contracts and ability to
defer to take advantage of uplift in pool prices Continue to negotiate longer term coal supply contract on
competitive prices Wallerawang
Gas
Tallawarra
Portfolio of long term gas contracts through to 2021 (plus equity gas from Narrabri) Subject to Take-or-Pay arrangements, but with rights to bank
gas for use at later times Gas storage provides considerable flexibility in managing gas
requirements
Hallett
Newport
Jeeralang
Generation assets are supported by long term fuel supply
contracts

19
Other TRUenergy assets further reinforces it as an integrated
energy business
Upstream Gas Gas Supply Contracts
Gas Storage
Acquired 20% interest in Narrabri Project in Gunnedah
Basin (NSW)
Effective interest of over 500PJ of coal seam gas
reserves
Hedges rising gas price risk with potential development
upside
Experienced partner in Santos
Portfolio of gas supply contracts from multiple suppliers
Total volumes of 1,100PJ over the next seven years
(sufficient to cover internal requirements over this
period)
Gas storage facility at Iona (Victoria)
22PJ of underground gas storage
Capacity of 500TJ/day
Supplies gas to Victoria and South Australia
Provides TRUenergy with the option to store surplus gas
during off peak periods and withdraw during peak periods to
manage seasonality in demand and hedge against price
spikes

20
TRUenergy’s generation portfolio broadly reflects NEM
intensity
Largest privately-owned energy portfolio in the NEM
TRUenergy’s portfolio carbon intensity of 0.95 compared with NEM of ~0.89
Yallourn’s captive coal mine provides a fixed low cost fuel source, contributing to a low cost generation
portfolio
Yallourn is very well positioned to benefit from a rising wholesale gas price market, despite the
introduction of the carbon tax from 1 July 2012
20%
27%
53%
Source: TRUenergy estimates and ACIL Tasman market model data
TRUenergy Fuel Mix1 NEM Fuel Mix2
Yallourn 27%
Tallawarra 8%
Hallett 4%
Ecogen 18%
Mt Piper 25%
Wallerawang 18%
Brown Coal Gas Black Coal
2. Excludes hydro, wind and others
Source: TRUenergy estimates and ACIL Tasman market model data
1. Excludes wind
21
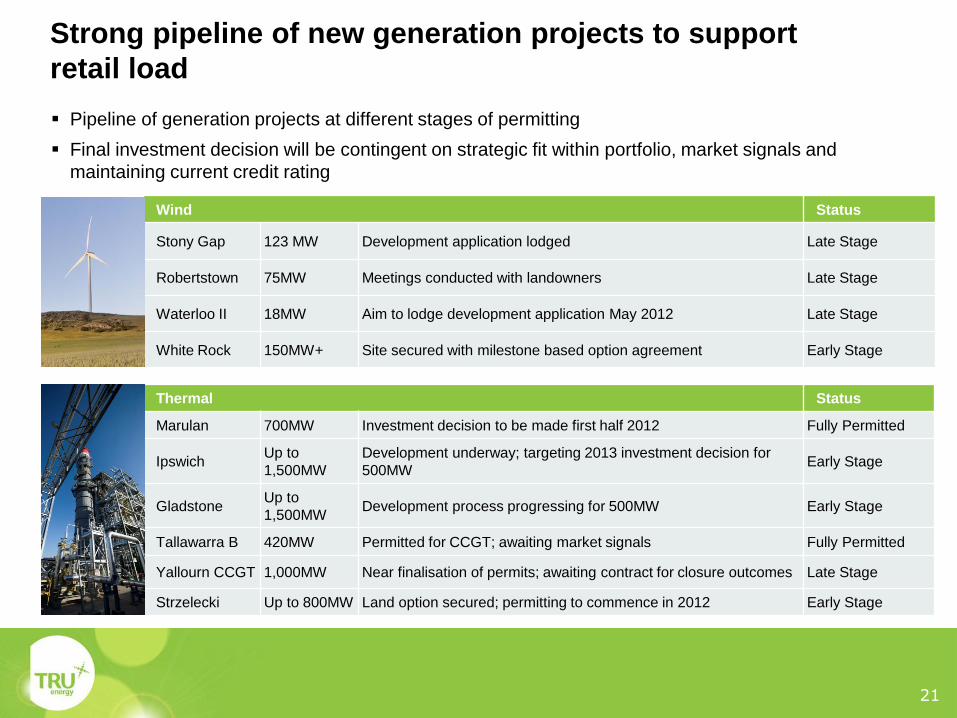
Thermal Status
Marulan 700MW Investment decision to be made first half 2012 Fully Permitted
Ipswich Up to
1,500MW
Development underway; targeting 2013 investment decision for
500MW Early Stage
Gladstone Up to
1,500MW Development process progressing for 500MW Early Stage
Tallawarra B 420MW Permitted for CCGT; awaiting market signals Fully Permitted
Yallourn CCGT 1,000MW Near finalisation of permits; awaiting contract for closure outcomes Late Stage
Strzelecki Up to 800MW Land option secured; permitting to commence in 2012 Early Stage
Wind Status
Stony Gap 123 MW Development application lodged Late Stage
Robertstown 75MW Meetings conducted with landowners Late Stage
Waterloo II 18MW Aim to lodge development application May 2012 Late Stage
White Rock 150MW+ Site secured with milestone based option agreement Early Stage
Pipeline of generation projects at different stages of permitting
Final investment decision will be contingent on strategic fit within portfolio, market signals and
maintaining current credit rating
Strong pipeline of new generation projects to support
retail load

22
Asset CO2 Int.*
(kg/kWh) Increase in carbon price
Increase in gas price
Comment
Yallourn 1.39 ✓ A$350m impairment (pre-tax) Transitional Assistance (cash and free
carbon permits)
Delta Western (Mt Piper/Wallerawang)
0.90 / 0.92 ✓ Lower gross margins following introduction
of carbon pricing but offset by increasing gas prices
Ecogen (Newport / Jeeralang)
0.56 / 0.94 ✓ Improved position in merit order following
introduction of carbon
Tallawarra 0.37 ✓ Higher efficiency reduces its exposure to
increases in gas prices relative to other gas power plants
Hallett 1.05 ✓ - Increase market price volatility results in
higher usage and profitability
Wind n/a ✓ ✓ Higher pool prices with no change to cost
base
Iona Gas Storage n/a ✓ ✓ Value of inventory and gross margins
increases with increases in carbon and gas prices
Narrabri CSM n/a ✓ ✓ Increase in underlying asset value
Impact of carbon and gas price on TRUenergy’s asset portfolio
* Calculated on a “sent out” basis

Strong financial position
24
170
180
190
200
210
220
2008 2009 2010 2011*
A$
m
CAPEX^
0
2,000
4,000
6,000
8,000
2008 2009 2010 2011*
A$
m
Revenue
0
200
400
600
800
1,000
1,200
2008 2009 2010 2011*
A$
m
EBITDAF
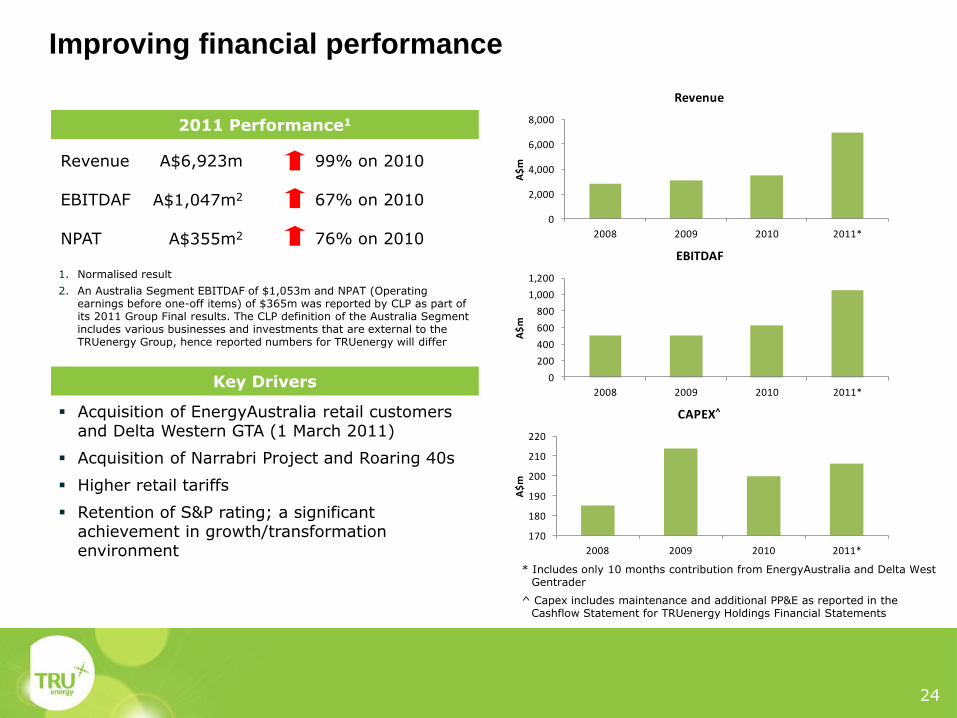
Revenue A$6,923m 99% on 2010
EBITDAF A$1,047m2 67% on 2010
NPAT A$355m2 76% on 2010
*
Improving financial performance
Acquisition of EnergyAustralia retail customers and Delta Western GTA (1 March 2011)
Acquisition of Narrabri Project and Roaring 40s
Higher retail tariffs
Retention of S&P rating; a significant achievement in growth/transformation environment
1. Normalised result
2. An Australia Segment EBITDAF of $1,053m and NPAT (Operating earnings before one-off items) of $365m was reported by CLP as part of its 2011 Group Final results. The CLP definition of the Australia Segment includes various businesses and investments that are external to the TRUenergy Group, hence reported numbers for TRUenergy will differ
2011 Performance1
Key Drivers
* Includes only 10 months contribution from EnergyAustralia and Delta West Gentrader
^ Capex includes maintenance and additional PP&E as reported in the Cashflow Statement for TRUenergy Holdings Financial Statements
25
Revolving
47%
MTN
19%
USPP14%
WCF20%
0
200
400
600
800
1,000
1,200
2012 2013 2014 2015 2016 2017 2018+
Revolving MTN USPP WCF
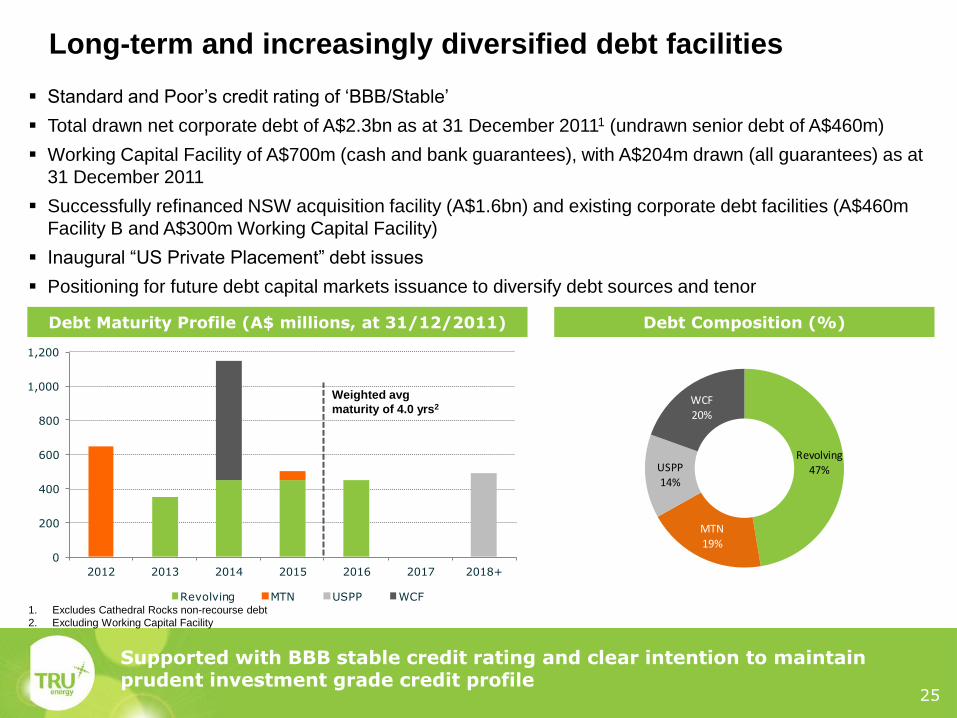
Supported with BBB stable credit rating and clear intention to maintain prudent investment grade credit profile
Standard and Poor’s credit rating of ‘BBB/Stable’
Total drawn net corporate debt of A$2.3bn as at 31 December 20111 (undrawn senior debt of A$460m)
Working Capital Facility of A$700m (cash and bank guarantees), with A$204m drawn (all guarantees) as at
31 December 2011
Successfully refinanced NSW acquisition facility (A$1.6bn) and existing corporate debt facilities (A$460m
Facility B and A$300m Working Capital Facility)
Inaugural “US Private Placement” debt issues
Positioning for future debt capital markets issuance to diversify debt sources and tenor
1. Excludes Cathedral Rocks non-recourse debt
2. Excluding Working Capital Facility
Debt Maturity Profile (A$ millions, at 31/12/2011) Debt Composition (%)
Weighted avg
maturity of 4.0 yrs2
Long-term and increasingly diversified debt facilities

Recent Corporate
Activity
27
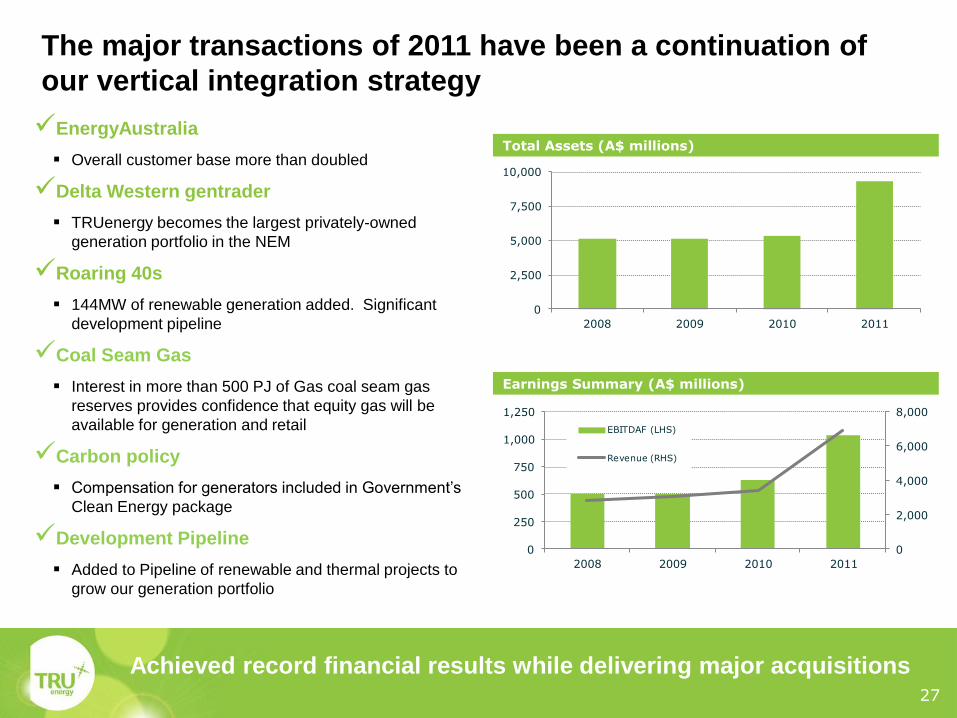
The major transactions of 2011 have been a continuation of
our vertical integration strategy
EnergyAustralia
Overall customer base more than doubled
Delta Western gentrader
TRUenergy becomes the largest privately-owned
generation portfolio in the NEM
Roaring 40s
144MW of renewable generation added. Significant
development pipeline
Coal Seam Gas
Interest in more than 500 PJ of Gas coal seam gas
reserves provides confidence that equity gas will be
available for generation and retail
Carbon policy
Compensation for generators included in Government’s
Clean Energy package
Development Pipeline
Added to Pipeline of renewable and thermal projects to
grow our generation portfolio
Total Assets (A$ millions)
Earnings Summary (A$ millions)
Achieved record financial results while delivering major acquisitions
0
2,500
5,000
7,500
10,000
2008 2009 2010 2011
0
2,000
4,000
6,000
8,000
0
250
500
750
1,000
1,250
2008 2009 2010 2011
EBITDAF (LHS)
Revenue (RHS)

Appendix
29
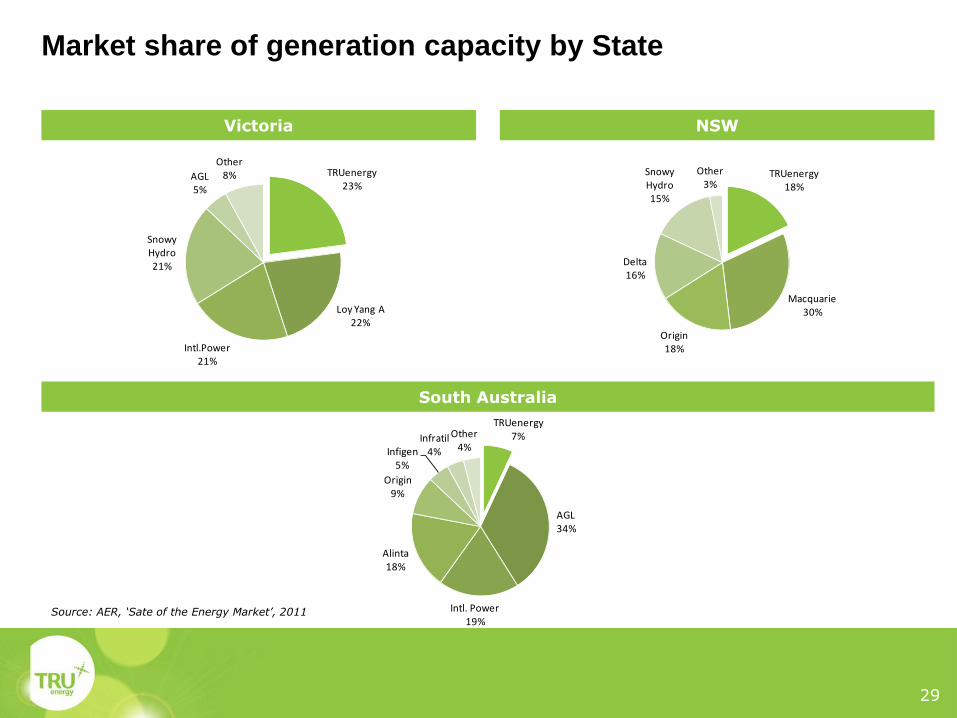
TRUenergy18%
Macquarie30%
Origin18%
Delta16%
Snowy Hydro15%
Other3%
TRUenergy23%
Loy Yang A22%
Intl.Power21%
Snowy Hydro21%
AGL5%
Other8%
Market share of generation capacity by State
Victoria NSW
South Australia
Source: AER, ‘Sate of the Energy Market’, 2011
TRUenergy7%
AGL34%
Intl. Power19%
Alinta18%
Origin9%
Infigen5%
Infratil4%
Other4%

30
Retail customer market share by fuel type
Source: AER, ‘State of the Energy Market’, 2011, p.103. Source: UBS
Electricity Gas
0%
25%
50%
75%
100%
VIC NSW SA QLD ACT
TRUenergy AGL Origin
ActewAGL Other - Private Other - Govt
0%
25%
50%
75%
100%
VIC NSW SA QLD ACT
TRUenergy AGL Origin
ActewAGL Other - Private Other - Govt

31
Portfolio helps to maximise returns in a volatile market
Source: TRUenergy Source: TRUenergy
Actual 2011 Volume (TWh) Actual 2011 Generation Capacity and
Retail Load (MW)
0
5
10
15
20
25
30
35
40
Long Short
Yallourn Delta West Other Contracts VIC NSW SA/QLD
0
2,000
4,000
6,000
8,000
Long ShortYallourn Delta Tallawarra Ecogen Hallett Swaps
Caps Vic NSW Qld SA
TRUenergy is effectively internally hedged

32
Merit order adjusted for carbon price
Portfolio of generation assets with strength in both geographic and fuel diversity
TRUenergy’s average weighted short run marginal cost to generate is slightly below the NEM weighted average
TRUenergy’s portfolio is lower than market average merit order with or without carbon
Excludes semi scheduled capacity (such as wind power) and hydro, which effectively has zero SRMC, and assumes fuel cost is held constant Brown coal (excl. Yallourn) generators highlighted in brown Source: TRUenergy modelling.
Halle
tt:
203M
W G
as
Jeera
lang
: 466M
W G
as
Talla
warr
a:
420M
W G
as
Mt
Pip
er:
1,4
00M
W B
lack C
oal
Walle
raw
ang: 1,0
00M
W B
lack C
oal
Yallo
urn
: 1,4
80M
W B
row
n C
oal
0 10,000 15,000 20,000
460
25,000 30,000 35,000
0
20
40
5,000
80
100
120
400
420
140
New
port
: 500M
W G
as
60
2010 Indicative Merit Order ($23/t Carbon)
SRM
C (
$/M
Wh)
Indicative capacity (MW)

33
Disclaimer
This presentation may contain forward looking statements and comments about future events, including our expectations about the performance of TRUenergy Group's business. Such comments are not audited and are based on a number of factors that we cannot control and so no representation or warranty is provided by or on behalf of TRUenergy or CLP that they should or will be achieved. We cannot be certain that the comments will be accurate or complete and so they should not be relied on.
Please note that, in providing this presentation, TRUenergy has not considered the objectives, financial position or needs of any particular recipient.