Investor Presentation - Bangkok Bank · Investor Presentation For 2017 . 1. Operating Environment...
37
Investor Presentation For 2017
Transcript of Investor Presentation - Bangkok Bank · Investor Presentation For 2017 . 1. Operating Environment...
Investor Presentation For 2017

1. Operating Environment
2. Our Key Focus and Position
3. Our Financial Result 2017
Bangkok Bank
2

For 2018, global economic expansion is synchronous with rising global investment amid upbeat sentiment
USA
2.7%
EU
2.2% China
6.6% Japan
1.2%
ASEAN*
5.3%
Note: *ASEAN-5; Indonesia, Malaysia, Philippines, Thailand, Vietnam Source: IMF (2018)
WORLD
3.9% (3.7% in 2017)
10% or more 6% - 10% 3% - 6% 0% - 3% Less than 0% No data
3

4.6% 5.1% 5.0%
2.5%
-2.3%
7.8%
0.1%
7.3%
2.8%
0.9%
2.9% 3.2% 3.9% 4.2%
2005 2006 2007 2008 2009 2010 2011 2012 2013 2014 2015 2016 2017E 2018F
The Thai Economy: Robust growth underpinned by the strong external sector
Source: National Economic and Social Development Board of Thailand and Bank of Thailand 2018F GDP forecast by Bangkok Bank Since 2012 GDP Revised by Chain Volume Measures
GDP Growth YoY (%)
Collapse in oil price
Great floods
Large scale fiscal stimulus
Global economic recovery
Global financial crisis
Strong Baht appreciation up to taper tantrum
Brexit US election
4
2005 2006 2007 2008 2009 2010 2011 2012 2013 2014 2015 2016 2017 2018F

0 10 20 30 40
Petroleum products
Other manufacturing products
Metal & steel
Petro-chemical products
Electrical Appliances
Agriculture
Machinery and equipment
Agro-manufacturing products
Electronics
Automotives
Billion USD
Top Ten Exports
(Jan-Nov 2017)
(Jan-Nov 2016)
70
80
90
100
110
120
Jan Jan Jan Jan Jan Jan Jan Jan
Export value
Export volume
Source: Bank of Thailand
Index Jan 2012 = 100, 3mma
2010 2011 2012 2013 2014 2015 2016 2017
Exports have benefited from strong global growth and rising global CAPEX
Export Value and Volume index
Sep 2017
5

Tourism continues to go from strength to strength - accounting for 11% of GDP
Source: CEIC, Ministry of Tourism and Sports
0
2
4
6
8
10
12
2000 2001 2002 2003 2004 2005 2006 2007 2008 2009 2010 2011 2012 2013 2014 2015 2016 2017
Tourist Arrivals (Million)
Others (8.4m)
EU (6.5m)
North America (1.5m)
China (9.8m)
ASEAN 5 (5.4m)
CLMV (3.8m)
6
2000 2001 2002 2003 2004 2005 2006 2007 2008 2009 2010 2011 2012 2013 2014 2015 2016 2017

20 30 40 50 60 70 80 90 100
motor vehicles
petro pdts
chemicals/chemical…
medical pdts
other transport equip.
paper & paper pdts
office machinery
electrical machinery
electrical component
rubber and plastic pdts
fabricated metal pdts
non-metallic mineral
food & beverage
machinery&equip.
basic metals
textiles
furniture
tobacco
Capacity utilisation rate by sector, % not seasonally adjusted
Nov-17
Nov-16
40
50
60
70
80
80
90
100
110
Jan Jan Jan Jan Jan
Private Investment Index
Capacity Utilisation Rate (RHS)
Private investment growth is on firmer footing amid rising capacity utilisation
Monthly % SA Monthly Index Jan 2013 = 100 SA
Source: Bank of Thailand, The Office of Industrial Economics, Bureau of Budget and Fiscal Policy Office
2013 2014 2015 2016 2017
Private Investment
Nov 2017
Overall Capacity Utilisation Rate as of Nov-17, (64%)
7

95
100
105
110
Jan Jan Jan Jan Jan
0.0
0.2
0.4
0.6
0.8
1.0
1.2
1.4
1.6
Pickup Truck Passenger Car Sport Utility Vehicle
Private consumption remains subdued while car sales appeared to have rebounded
2013 2014 2015 2016 2017 Nov
Private Consumption Monthly Index Jan 2013 = 100 SA
Source: Bank of Thailand, CEIC
No of units (in millions)
Domestic Motor Vehicle Sales
0.80 0.79
1.44
1.33
0.88
0.80 0.77 0.87
0.55 0.62 0.63
2017
8
2007 2008 2009 2010 2011 2012 2013 2014 2015 2016 2017

Infrastructure investment is set to accelerate before the general election
Inter-city rail network 2,227.42 Billion Baht
Mass Transit 746.98 Billion Baht
1
2
3 Road 300.82 Billion Baht
Water transportation 6.76 Billion Baht 4
Air transport 98.02 Billion Baht
5
Source: Office of Transport and Traffic Policy and Planning, Ministry of Transport
2015-2022 Infrastructure Projects 3.38 Trillion Baht
2016-2018 Transport Action Plans 60 Projects, 2.5 Trillion Baht
Inter-city rail network
Under construction: Chira-Khonkhaen (48% completed)
Auctions completed: 5 projects
Transportation in Bangkok & vicinity
Under construction : Red/Orange lines
To be constructed in 2018Q1: Pink/Yellow lines
Proposals developed: 5 lines
Highway network
Under construction: Bang Pa In-Korat (14% completed)
Bang Yai-Kanchanaburi
Pattaya-Maptaphut (46% completed)
Air transport
Under construction: Suvarnabhumi Phase II
Other projects
High-speed trains: Bangkok-Korat, Bangkok-Rayong
Eastern Economic Corridor
Under procurement : Rama 3-Dao Khanong –Outer Ring Road (West Bangkok)
9
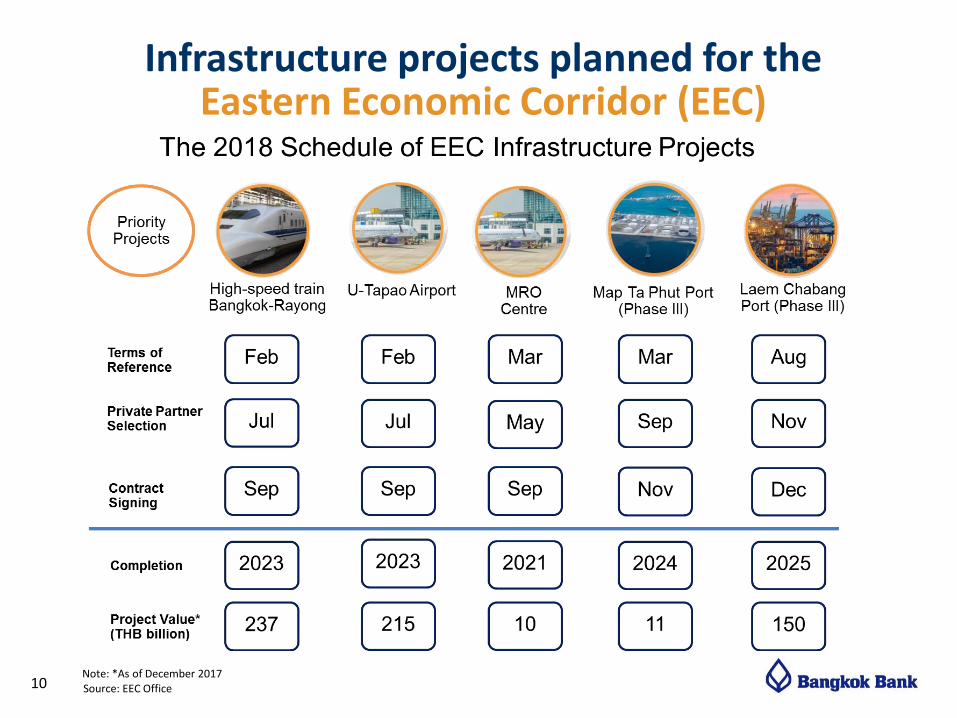
10
Infrastructure projects planned for the Eastern Economic Corridor (EEC)
Source: EEC Office Note: *As of December 2017

Inflation is trending up as a result of rising energy prices - albeit well below the target
-3
-2
-1
0
1
2
3
%YoY
Headline Inflation Contribution
CORE RAW FOOD ENERGY CPI
Source: Ministry of Commerce
11

Currency Movement: Rapid appreciation is beginning to unnerve the business sector
Note: *YTD as of 25 Jan 2018
Source: Bloomberg
12.8%
11.1%
10.0%
8.6% 8.2%
7.0% 6.8%
4.3%
-0.4% -0.6%
0.3%
4.8%
3.9%
2.3% 2.0%
3.0%
0.6%
3.4%
-1.7%
2.1%
-4%
-2%
0%
2%
4%
6%
8%
10%
12%
14%
KRW MYR THB SGD TWD CNY INR JPY PHP IDR
2017 YTD 2018
12
2017 YTD 2018*

Monthly Index Jan 2012 = 100
Source: Bank of Thailand
Currency Movement: The NEER level has been steadily rising – lowering export competitiveness
95
100
105
110
115
120
125
Nominal Effective Exchange Rate (NEER)
Taper Tantrum BOT’s Capital Account Liberalisation
Dec-17
13

1. Operating Environment
2. Our Key Focus and Position
3. Our Financial Result 2017
Bangkok Bank
14

Our Key Focus
Inspiring Success Support customers to tap into new opportunities in infrastructure investment in Thailand and AEC, businesses in EEC and S-curve industries. Expand customer base and revenue streams
Innovation Leadership Offer innovative products and services using Big Data, machine learning and Artificial Intelligence (AI)
Inter-Connection Connect businesses in ASEAN/AEC by leveraging our industry expertise and enhanced transaction services through our domestic and international networks
15

CE Tier1 Tier1 CAR
Capital Requirements/3
as of the year 2020
2009 2011 2013 2015 2017
1. Sustainable Liquidity and Capital
System/1 96.1%
BBL 86.7%
Regulatory Economic Momentum
2009 2011 2013 2015 2017
BBL 34.2%
System/1 28.3%
Goals are supported by:
Healthy Level of Liquid Assets
18.5%
Note: /1 System refers to all commercial banks in Thailand /2 As of December 2017, the ratios include net profit for the second half of 2017 and the deduction of dividends to be paid in May 2018 /3 The minimum capital requirements by the Bank of Thailand (BOT) under the Basel III, including the additional requirements
for Higher Loss Absorbency (HLA) as Domestic Systemically Important Banks (D-SIBs) Source: Bank of Thailand, Bangkok Bank Analysis
17.0% 17.0%
Well-Positioned LDR
Strong Capital Position
/2 /2 /2
16

Large Retail Customer
Base
2. Scale and Franchise Leadership
Multi-Tiered Distribution
Platform
Long-Established
International Branch
Full Range of Product & Service
Bangkok Bank
Market Leader in Corporate
& SME
Strong Domestic Network
Goals are supported by:
17

3. Solutions for a Digital Era
Goals are supported by:
Building a Culture of Innovation
Research and Development
Security Culture
Promoting a culture of innovation with a range of initiatives
Cultivate corporate security culture as a business enabler and support the sustainable cybersecurity
Working on areas such as AI and Big Data
Rebuilding Technology Infrastructure
Enhance our back-end and front-end systems & improve straight-through-processing
18

1. Operating Environment
2. Our Key Focus and Position
3. Our Financial Result 2017
Bangkok Bank
19
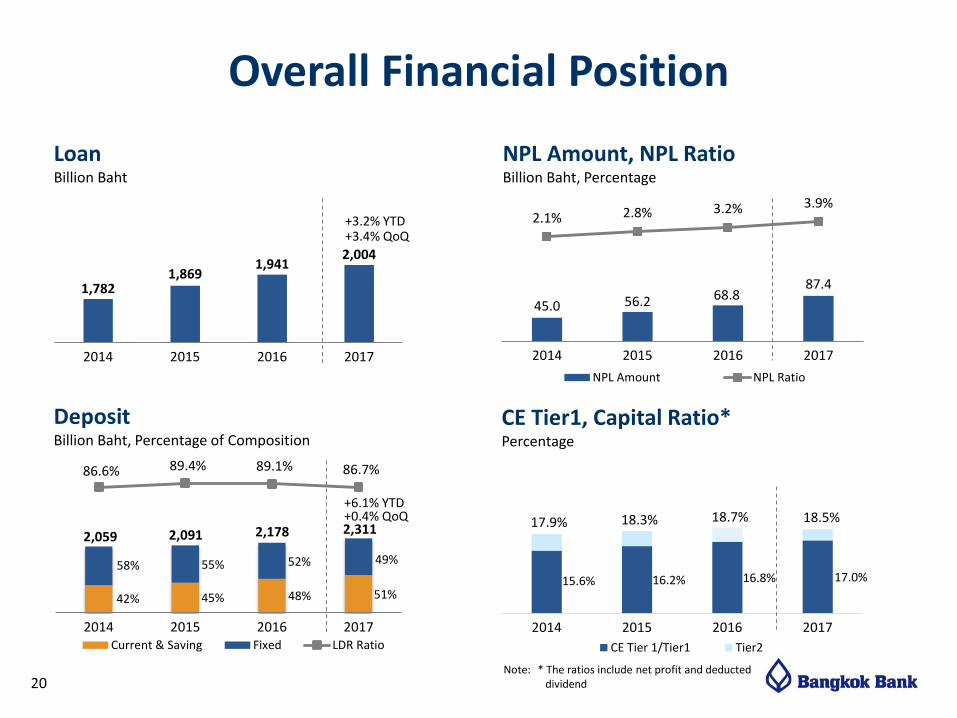
Note: * The ratios include net profit and deducted dividend
45.0 56.2 68.8 87.4
2.1% 2.8% 3.2% 3.9%
-10.00 %
-5.00%
0.0 0%
5.0 0%
10.00%
0
50
100
150
200
250
300
350
2014 2015 2016 2017
NPL Amount NPL Ratio
1,782 1,869
1,941 2,004
2014 2015 2016 2017
86.6% 89.4% 89.1% 86.7%
2014 2015 2016 2017 Current & Saving Fixed LDR Ratio
Overall Financial Position
NPL Amount, NPL Ratio Billion Baht, Percentage
Loan Billion Baht
Deposit Billion Baht, Percentage of Composition
CE Tier1, Capital Ratio* Percentage
+3.2% YTD +3.4% QoQ
+6.1% YTD +0.4% QoQ
15.6% 16.2% 16.8% 17.0%
2014 2015 2016 2017
CE Tier 1/Tier1 Tier2
17.9% 18.3% 18.7%
2,059 2,091 2,311
58%
42%
55%
45%
52%
48%
2,178
49%
51%
18.5%
20

Note: /1 System refers to all commercial banks in Thailand Source: Bank of Thailand, Bangkok Bank Analysis
33.1 48.8 58.3 70.0
58.8 55.4
61.2
70.0
-
30.00
60.00
90.00
120.00
150.00
180.00
2014 2015 2016 2017
BBL's Excess Reserve over BOT Requirement
BBL's Required Reserve by BOT
Loan Loss Reserve Billion Baht
91.9
119.5 104.2
Coverage Ratio Percentage
140.0
Reserve for Asset Quality
204 185 174 160
141 130 136 138
0
50
100
150
200
250
300
2014 2015 2016 2017
System/1 BBL
21

2.37%
2.16%
2.34% 2.32%
2014 2015 2016 2017
44.5% 43.8% 47.7%
43.5%
2014 2015 2016 2017
47.4% 41.9% 45.5%
4Q16 3Q17 4Q17
60% 59% 59%
4Q16 3Q17 4Q17
Net Interest Income Net Fee Income Other Income
2.36% 2.30% 2.31%
4Q16 3Q17 4Q17
61% 56% 60% 59%
2014 2015 2016 2017
Total Income and Operating Expense
-5 bps YoY +1 bps QoQ
6.3 6.6 7.8
0
5
10
15
20
25
4Q16 3Q17 4Q17
+25.3% YoY +18.7% QoQ
40%
Income Breakdown Billion Baht, Percentage of Composition
NIM Percentage
28.5 27.4 28.7
41%
105.9 102.7 96.9
39% 44% 40% -2 bps YoY
Net Fee Income Billion Baht
21.7 24.1 24.5
27.5
0
10
20
30
40
2014 2015 2016 2017
Cost-to-Income Ratio Percentage
+12.4% YoY
+5.0% YoY +0.9% QoQ 41%
112.5 +6.2% YoY
41%
22

8.3 8.2 8.5
3.6 6.3 4.6
13.0 11.9 13.1
4Q16 3Q17 4Q17
36.3 34.2 31.8 33.0
8.7 14.7 15.7 22.4
43.1 45.0 50.5
48.9
2014 2015 2016 2017
Overall Profitability
Profitability Driver Billion Baht
Note: /1 Attributable to owners of the Bank
105.9 102.7 96.9
Operating Expense Provisioning Expense Tax Net Profit/1
27.4 28.5 28.7
112.5
23
Appendix
24

Disbursement Schedule of Infrastructure Projects
-
50
100
150
200
250
300
350
400
450
500
2017 2018 2019 2020 2021 2022 2023 2024
Billion Baht
Action Plan 2016 Action Plan 2017 Action Plan 2018
Source: Ministry of Transport, Office of Transport and Traffic Policy and Planning
25

Opportunities from Regionalization & Urbanization
Higher Connectivity in the AEC
Next-Generation Automotive
Smart Electronics
Affluent, Medical & Wellness Tourism
Agriculture & Biotechnology
Food for the Future
Robotics
Aviation & Logistics
Biofuels & Biochemicals
Digital
Medical Hub
10 Target Industries
26

Loan Growth and Composition
Loan by Business Unit Percentage of Composition
Dec-16
Loan by Industry Percentage of Composition
21% Utility & Service
11% Housing
15% Others
Agriculture & Mining 2%
26% Manufacturing
Real Estate &Construction
9%
16% Commercial
1,782 1,869
1,941 2,004
2014 2015 2016 2017
Loan Billion Baht
+3.2% YTD +3.4% QoQ
10% Business
14% Consumer
International 16% Corporate
40%
20% Commercial
Dec-17
9% Business
14% Consumer
21% Commercial
Dec-16
21% Utility & Service
11% Housing
15% Others
Agriculture & Mining 2%
26% Manufacturing
Real Estate &Construction
10%
15% Commercial
Dec-17
International 15% Corporate
41%
27

15% 15% 19%
26% 24% 22%
22% 23% 20%
8% 8% 7%
15% 18% 18%
14% 12% 14%
4Q16 3Q17 4Q17
6.3 6.6 7.8
4Q16 3Q17 4Q17
21.7 24.1 24.5
27.5
2014 2015 2016 2017
16% 16% 16% 17%
26% 26% 26% 24%
24% 22% 23% 22%
9% 8% 8% 8%
13% 15% 15% 17%
12% 13% 12% 12%
2014 2015 2016 2017
Fee Income Breakdown Percentage of Composition
Net Fee Income Billion Baht
Fee Income
+12.4% YoY
Other Fees and Commissions
Bancassurance and Mutual Fund
Global Market Service
Transaction Service
Credit Card Business
Loan Related Fee
+25.3% YoY +18.7% QoQ
28

Capital requirements/2 as of the year 2020 Capital requirements/1 as of the year 2019
Dec-16 Dec-17
Capital requirements/1 as of the year 2017
Common Equity Tier 1 Ratio
Basel III
Tier 1 Ratio Total Capital Adequacy Ratio
8.0%
17.0%
Note: /1 The Bank of Thailand requires commercial banks to maintain an additional capital conservation buffer. The buffer will gradually increase by more than 0.625% each year from January 1, 2016 until it reaches more than 2.5% in January 1, 2019.
Note: /2 The Bank of Thailand announced the guidelines for identifying and regulating Domestic Systemically Important Banks (D-SIBs) in September 2017. The BOT requires D-SIBs to hold additional capital for Higher Loss Absorbency (HLA) by gradually increasing its additional capital ratio by an increment of 0.5 percent from January 1, 2019 until completion of the increment to 1.0 percent in January 1, 2020 onwards.
Note: /3 The ratios include net profit and deducted dividend
Total Capital (Billion Baht)
CE Tier1/ Tier 1 capital
420
Tier 2 capital
Capital Position
7.25% 9.75%
361
42
12.0%
9.5% 384
36 403
5.75%
16.8% 17.0% 16.8% 18.5% 18.7%
Dec-16 Dec-17 Dec-16 Dec-17 Dec-16 Dec-17
and ratio as of December 31, 2017/3
BBL’s ratio as of December 31, 2016
7.0% 8.5%
11.0%
29
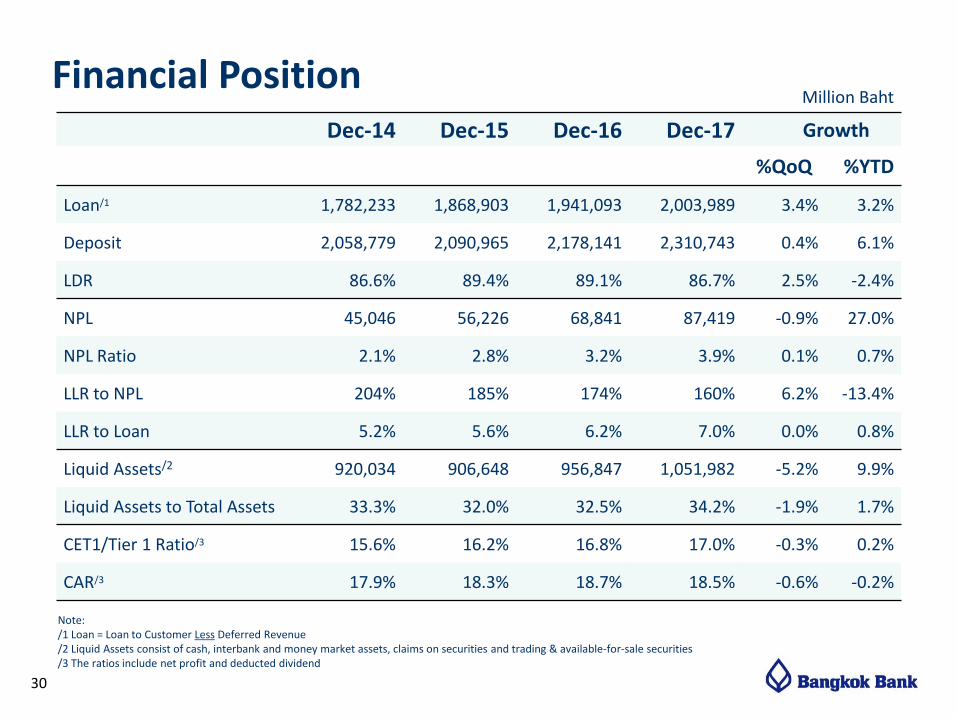
Million Baht
Dec-14 Dec-15 Dec-16 Dec-17 Growth
%QoQ %YTD
Loan/1 1,782,233 1,868,903 1,941,093 2,003,989 3.4% 3.2%
Deposit 2,058,779 2,090,965 2,178,141 2,310,743 0.4% 6.1%
LDR 86.6% 89.4% 89.1% 86.7% 2.5% -2.4%
NPL 45,046 56,226 68,841 87,419 -0.9% 27.0%
NPL Ratio 2.1% 2.8% 3.2% 3.9% 0.1% 0.7%
LLR to NPL 204% 185% 174% 160% 6.2% -13.4%
LLR to Loan 5.2% 5.6% 6.2% 7.0% 0.0% 0.8%
Liquid Assets/2 920,034 906,648 956,847 1,051,982 -5.2% 9.9%
Liquid Assets to Total Assets 33.3% 32.0% 32.5% 34.2% -1.9% 1.7%
CET1/Tier 1 Ratio/3 15.6% 16.2% 16.8% 17.0% -0.3% 0.2%
CAR/3 17.9% 18.3% 18.7% 18.5% -0.6% -0.2%
Financial Position
Note: /1 Loan = Loan to Customer Less Deferred Revenue /2 Liquid Assets consist of cash, interbank and money market assets, claims on securities and trading & available-for-sale securities /3 The ratios include net profit and deducted dividend
30

Financial Performance – 4Q17
Note: /1 Attributable to owners of the Bank
Million Baht
4Q16 3Q17 4Q17 Growth (%)
QoQ YoY
Net Interest Income 16,303 16,825 16,955 0.8% 4.0%
Net Fee Income 6,255 6,599 7,836 18.7% 25.3%
Non-Interest Income 11,063 11,651 11,789 1.2% 6.6%
Total Income 27,366 28,476 28,744 9.4% 5.0%
Operating Expense 12,968 11,939 13,089 9.6% 0.9%
Provisioning Expense 3,596 6,259 4,617 -26.2% 28.4%
Net Profit/1 8,267 8,161 8,496 4.1% 2.8%
EPS/1 (Baht per Share) 4.33 4.28 4.45 4.1% 2.8%
NIM 2.36% 2.30% 2.31% 0.01% -0.05%
Net Fee Income Ratio 22.9% 23.2% 25.5% 2.3% 2.6%
Cost to Income Ratio 47.4% 41.9% 45.5% 3.6% -1.9%
ROA/1 1.13% 1.06% 1.10% 0.04% -0.03%
ROE/1 8.77% 8.33% 8.48% 0.15% -0.29%
31

Financial Performance – Year
Note: /1 Attributable to owners of the Bank
Million Baht
2014 2015 2016 2017 Growth (%)
YoY
Net Interest Income 58,997 57,510 63,998 66,625 4.1%
Net Fee Income 21,726 24,071 24,492 27,526 12.4%
Non-Interest Income 37,860 45,219 41,860 45,843 9.5%
Total Income 96,857 102,728 105,858 112,468 6.2%
Operating Expense 43,087 45,045 50,505 48,948 -3.1%
Provisioning Expense 8,687 14,654 15,728 22,370 42.2%
Net Profit/1 36,332 34,181 31,815 33,009 3.8%
EPS/1 (Baht per Share) 19.03 17.91 16.67 17.29 3.8%
NIM 2.37% 2.16% 2.34% 2.32% -0.02%
Net Fee Income Ratio 22.4% 23.4% 23.1% 24.1% 1.0%
Cost to Income Ratio 44.5% 43.8% 47.7% 43.5% 4.2%
ROA/1 1.39% 1.21% 1.09% 1.09% 0.00%
ROE/1 11.66% 9.91% 8.59% 8.49% -0.10%
32

Baht
0.75 0.75 1.00 1.00 1.00 1.00 1.50 2.00 2.00 2.00 2.00 2.00 2.00 2.00 1.00 1.25 1.75 2.00 2.00
3.00 3.50
4.00 4.50 4.50 4.50 4.50 4.50 4.50
0
10
20
30
40
50
0
2
4
6
8
10
12
2003 2004 2005 2006 2007 2008 2009 2010 2011 2012 2013 2014 2015 2016 2017
Interim (L) Final (L) Dividend Payout Ratio (R)
5.00
3.00 4.00
6.00 6.50 6.50
39.3%
3.00 2.75 2.00 1.75
Percent
6.50 6.50
Dividend and Payout Ratio
6.50
33
6.50
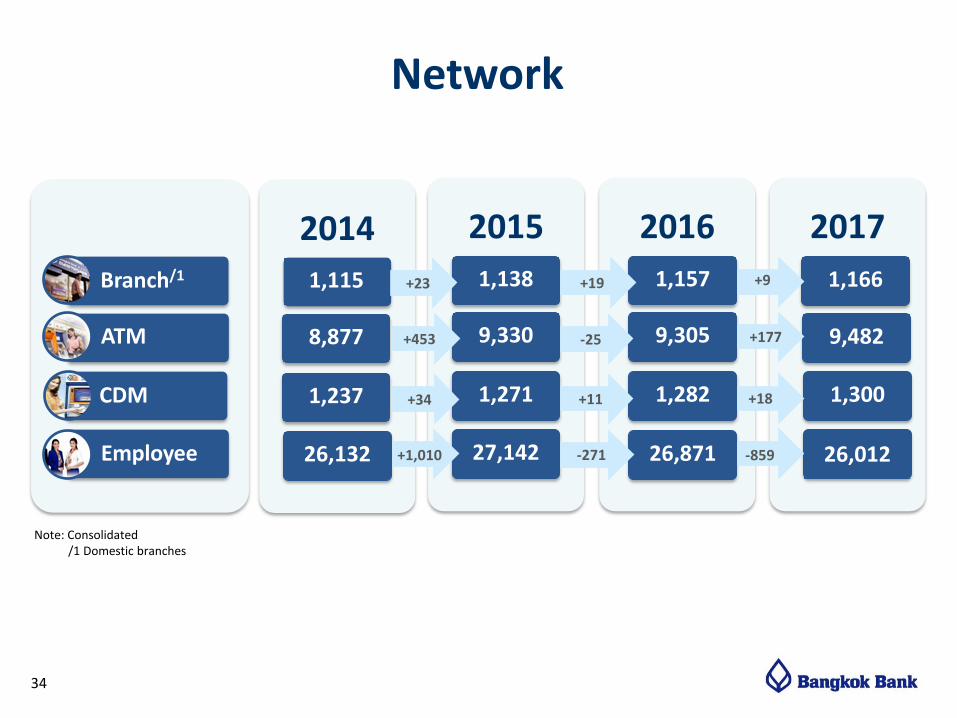
2014 2015 2016 2017
Branch/1
ATM
CDM
Employee
1,115
8,877
1,237
26,132
1,138
9,330
1,271
27,142
1,157
9,305
1,282
26,871
1,166
9,482
1,300
Note: Consolidated /1 Domestic branches
+23
+453
+34
+1,010
+19
-25
+11
+9
+177
+18
-271
Network
26,012 -859
34

Long-Standing International Presence
Japan Branch: 2 Number of Year: 62
UK Branch: 1 Number of Year: 60
USA Branch: 1 Number of Year: 52
Laos Branch: 2 Number of Year: 24
Philippines Branch: 1 Number of Year: 22
Vietnam Branch: 2 Number of Year: 25
China/1
Branch: 6 Number of Year: 31
Myanmar
Branch: 1 Number of Year: 22
Malaysia/1
Branch: 5 Number of Year: 58
Singapore Branch: 1 Number of Year: 60 Indonesia
Branch: 3 Number of Year: 45
Taiwan Branch: 3 Number of Year: 52
Hong Kong Branch: 2 Number of Year: 63
Cayman Islands Branch: 1 Number of Year: 2
Cambodia Branch: 1 Number of Year: 3
Note: As at December 2017
/1 Wholly-Owned Subsidiary
Source: Bangkok Bank Filing
32 International Locations
in 15 Economies
35

Consolidated 2018 Financial Target
Loan Growth 5-6%
NPL Ratio (Gross) Maintain
Net Interest Margin (NIM) Maintain
Net Fee Income Growth Mid to High Single Digit
Cost to Income Ratio Mid-40s
2018 Financial Target
Note: The above financial targets are based on the Bank’s preliminary estimates that may change due to the operating environments and other unforeseen circumstances.
36

This presentation is made by Bangkok Bank and may not be copied, altered, offered, sold or otherwise distributed to any other person by any recipient without the consent of Bangkok Bank. Although all reasonable effort has been made to ensure the facts stated herein are accurate and that the opinions contained herein are fair and reasonable, this document is selective in nature and is intended to provide an introduction to, and overview of, the business of Bangkok Bank. Where any information and statistics are quoted from any external source, such information or statistics should not be interpreted as having been adopted or endorsed by Bangkok bank as being accurate. Neither Bangkok Bank nor any of its directors, officers, employees, and advisors nor any other person shall have any liability whatsoever for loss howsoever arising, directly or indirectly, from any use of this information. The facts and information contained herein are as up to date as is reasonably possible and may be subject to revision in the future. Neither Bangkok Bank nor any of its directors, officers, employees or advisors nor any other person makes any representation or warranty, express or implied, as to the accuracy or completeness of the information contained in this presentation. Neither Bangkok Bank nor any of its directors, officers, employees and advisors nor any other person shall have any liability whatsoever for loss howsoever arising, directly or indirectly, from any use of this presentation. This presentation may contain projections or other forward-looking statements related to Bangkok Bank that involve risks and uncertainties. Readers are cautioned that these statements are only projections and may differ materially from actual future results or events. All forward-looking statements are based on information available to Bangkok Bank on the date of its posting and Bangkok Bank assumes no obligation to update such statements unless otherwise required by applicable law. This presentation does not constitute an offer or invitation to subscribe for, or purchase, any shares of Bangkok Bank.
Contact: Investor Relations Team Tel (66) 2 626 4981 Fax (66) 2 231 4890 Email: [email protected] Bangkok Bank Website www.bangkokbank.com
For Further Information