Bangkok September, 2012 1 Economic Integration 2 Bangkok September, 2012.

Investor Presentation For 1Q17
1. Operating Environment
2. Bangkok Bank’s Position
3. Our Key Focus & Strategy
4. Our Financial Results 2016 & 1Q17
Bangkok Bank
2
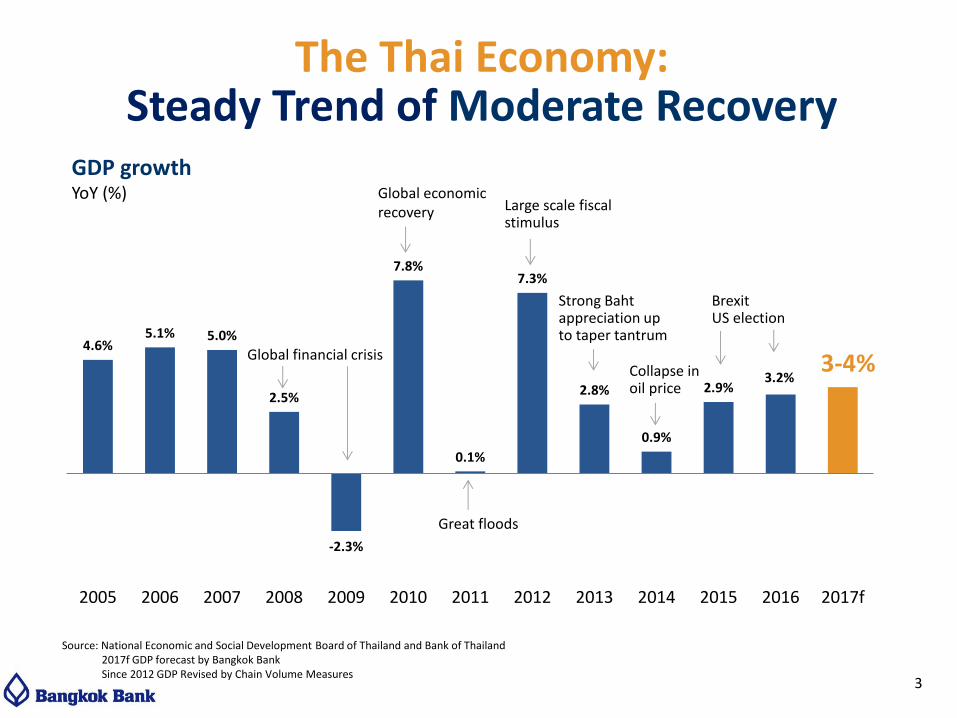
The Thai Economy: Steady Trend of Moderate Recovery
3
GDP growth YoY (%)
4.6% 5.1% 5.0%
2.5%
-2.3%
7.8%
0.1%
7.3%
2.8%
0.9%
2.9% 3.2%
3-4%
2005 2006 2007 2008 2009 2010 2011 2012 2013 2014 2015 2016 2017f
Collapse in oil price
Great floods
Large scale fiscal stimulus
Global economic recovery
Global financial crisis
Strong Baht appreciation up to taper tantrum
Source: National Economic and Social Development Board of Thailand and Bank of Thailand 2017f GDP forecast by Bangkok Bank Since 2012 GDP Revised by Chain Volume Measures
Brexit US election
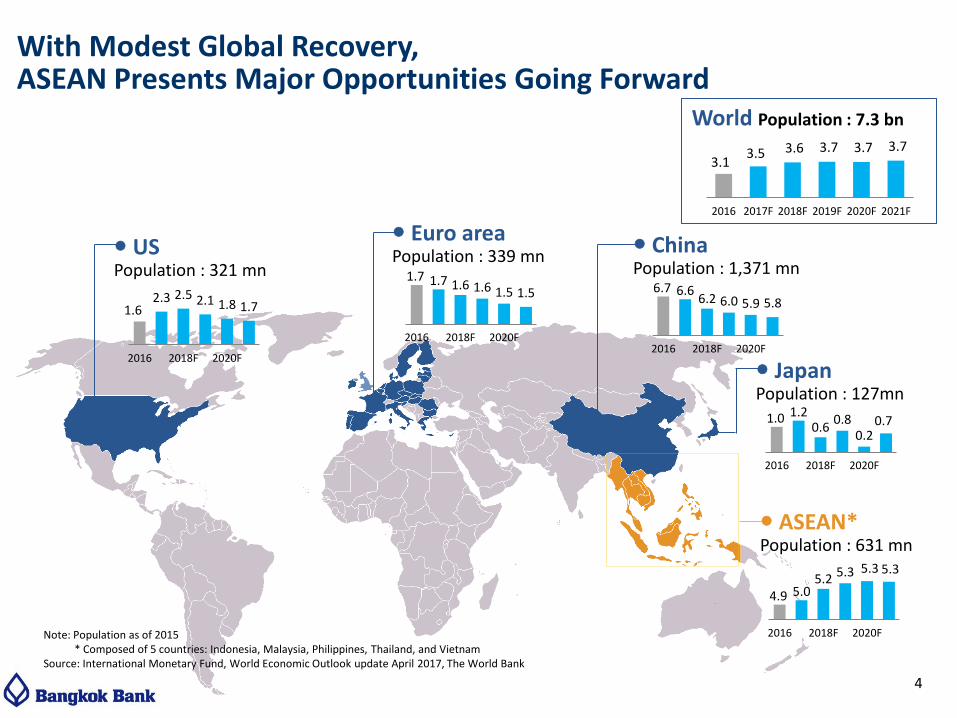
With Modest Global Recovery, ASEAN Presents Major Opportunities Going Forward
US Population : 321 mn
Euro area Population : 339 mn China
Population : 1,371 mn
World Population : 7.3 bn
Note: Population as of 2015 * Composed of 5 countries: Indonesia, Malaysia, Philippines, Thailand, and Vietnam Source: International Monetary Fund, World Economic Outlook update April 2017, The World Bank
ASEAN* Population : 631 mn
Japan Population : 127mn
1.6 2.3 2.5 2.1 1.8 1.7
0
1
1
2
2
3
3
2016 2018F 2020F
1.7 1.7 1.6 1.6 1.5 1.5
1
1
2
2
2
2
2016 2018F 2020F
6.7 6.6 6.2 6.0 5.9 5.8
5
6
6
7
7
2016 2018F 2020F
1.0 1.2 0.6
0.8 0.2
0.7
0
1
1
2
2016 2018F 2020F
4.9 5.0 5.2 5.3 5.3 5.3
55555555
2016 2018F 2020F
3.1 3.5 3.6 3.7 3.7 3.7
2
3
3
4
4
2016 2017F 2018F 2019F 2020F 2021F
4
0
10
20
30
40
50
60
70
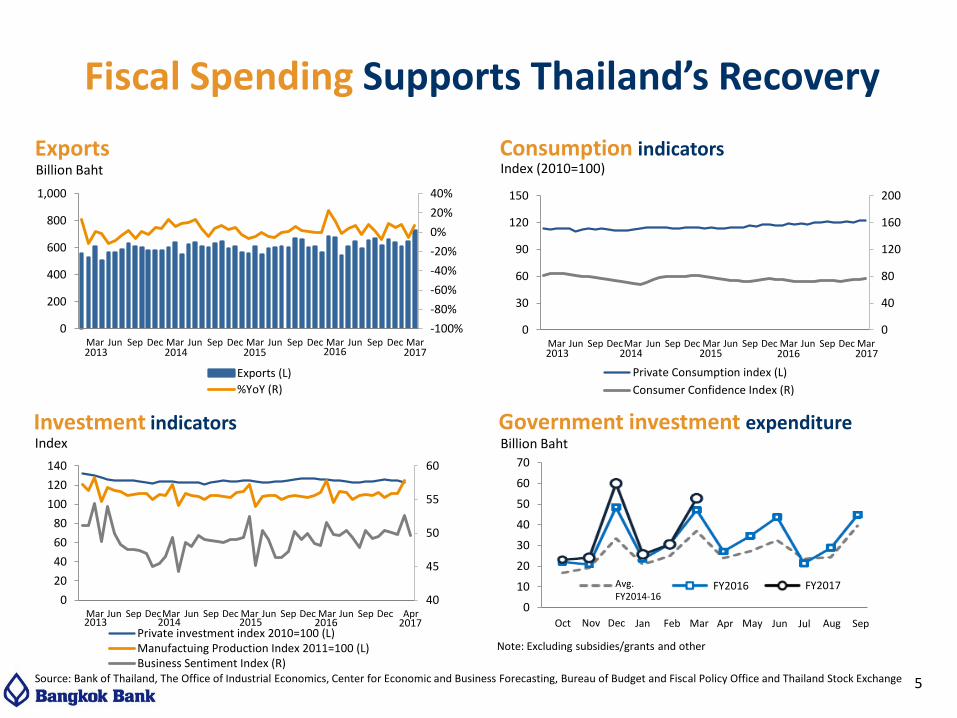
Fiscal Spending Supports Thailand’s Recovery
40
45
50
55
60
0
20
40
60
80
100
120
140
Mar Jun Sep DecMar Jun Sep Dec Mar Jun Sep Dec Mar Jun Sep Dec Apr
Private investment index 2010=100 (L)Manufactuing Production Index 2011=100 (L)Business Sentiment Index (R)
-100%
-80%
-60%
-40%
-20%
0%
20%
40%
0
200
400
600
800
1,000
Mar Jun Sep Dec Mar Jun Sep Dec Mar Jun Sep Dec Mar Jun Sep Dec Mar
Exports (L)
%YoY (R)
0
40
80
120
160
200
0
30
60
90
120
150
Mar Jun Sep DecMar Jun Sep Dec Mar Jun Sep Dec Mar Jun Sep Dec Mar
Private Consumption index (L)
Consumer Confidence Index (R)
Exports Billion Baht
Consumption indicators Index (2010=100)
2013 2014 2015 2013 2014 2015
Investment indicators Index
2013 2014 2015
Source: Bank of Thailand, The Office of Industrial Economics, Center for Economic and Business Forecasting, Bureau of Budget and Fiscal Policy Office and Thailand Stock Exchange
2016 2016
2016
5
Government investment expenditure Billion Baht
Oct Dec Apr Jun Aug
Avg. FY2014-16
FY2016 FY2017
Nov Jan Feb Mar May Jul Sep
Note: Excluding subsidies/grants and other
2017
2017
2017
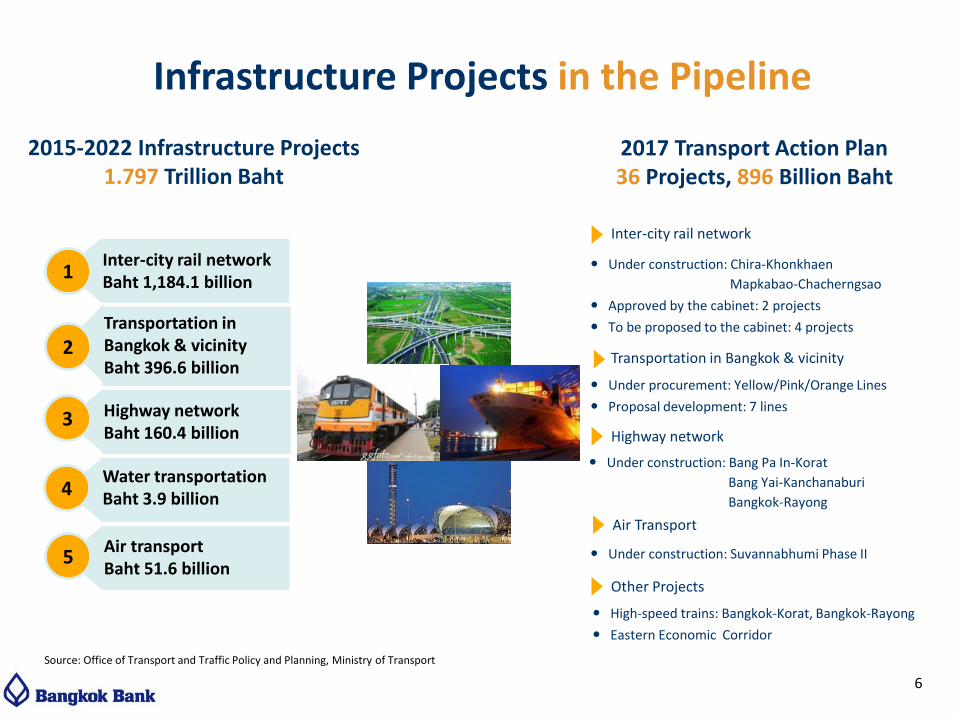
Infrastructure Projects in the Pipeline
6
Inter-city rail network Baht 1,184.1 billion
Transportation in Bangkok & vicinity Baht 396.6 billion
1
2
3 Highway network Baht 160.4 billion
Water transportation Baht 3.9 billion 4
Air transport Baht 51.6 billion
5
Source: Office of Transport and Traffic Policy and Planning, Ministry of Transport
2015-2022 Infrastructure Projects 1.797 Trillion Baht
2017 Transport Action Plan 36 Projects, 896 Billion Baht
Inter-city rail network
Under construction: Chira-Khonkhaen
Mapkabao-Chacherngsao
Approved by the cabinet: 2 projects
To be proposed to the cabinet: 4 projects
Transportation in Bangkok & vicinity
Under procurement: Yellow/Pink/Orange Lines
Proposal development: 7 lines
Highway network
Under construction: Bang Pa In-Korat
Bang Yai-Kanchanaburi
Bangkok-Rayong
Air Transport
Under construction: Suvannabhumi Phase II
Other Projects
High-speed trains: Bangkok-Korat, Bangkok-Rayong
Eastern Economic Corridor
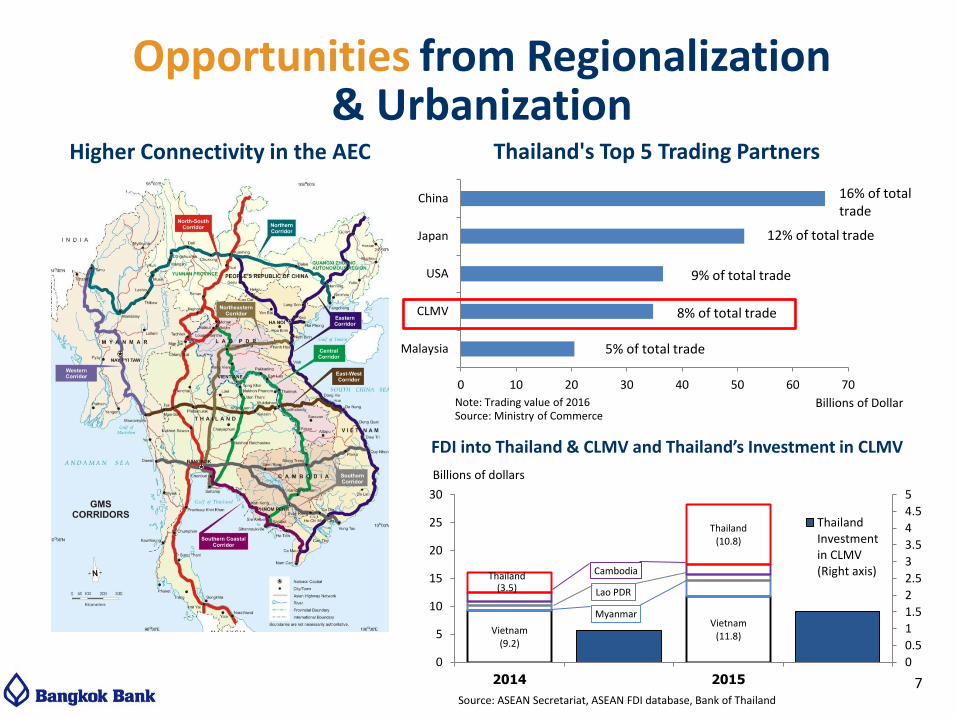
Opportunities from Regionalization & Urbanization
Higher Connectivity in the AEC
0 10 20 30 40 50 60 70
Malaysia
CLMV
USA
Japan
China
Billions of Dollar
16% of total trade
12% of total trade
9% of total trade
8% of total trade
5% of total trade
Note: Trading value of 2016 Source: Ministry of Commerce
Source: ASEAN Secretariat, ASEAN FDI database, Bank of Thailand
Vietnam (9.2)
Vietnam (11.8)
Myanmar
Lao PDR
Cambodia Thailand (3.5)
Thailand (10.8)
0
0.5
1
1.5
2
2.5
3
3.5
4
4.5
5
0
5
10
15
20
25
30
2014 2015
Billions of dollars
ThailandInvestmentin CLMV(Right axis)
Thailand's Top 5 Trading Partners
7
FDI into Thailand & CLMV and Thailand’s Investment in CLMV
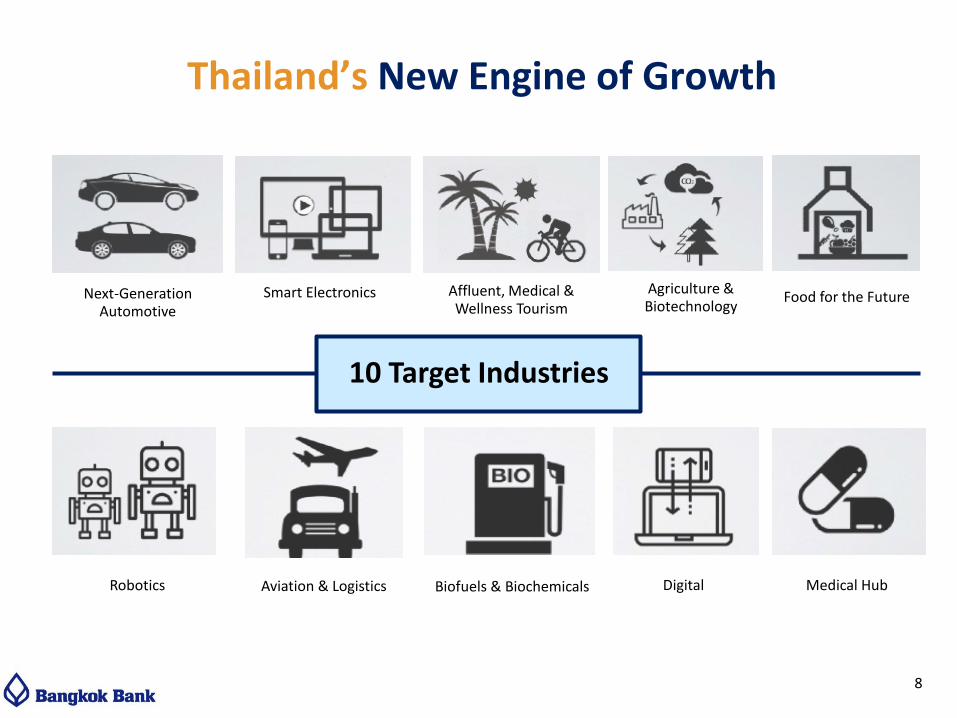
Thailand’s New Engine of Growth
10 Target Industries
Next-Generation Automotive
Smart Electronics Affluent, Medical & Wellness Tourism
Agriculture & Biotechnology
Food for the Future
Robotics Aviation & Logistics Biofuels & Biochemicals Digital Medical Hub
8
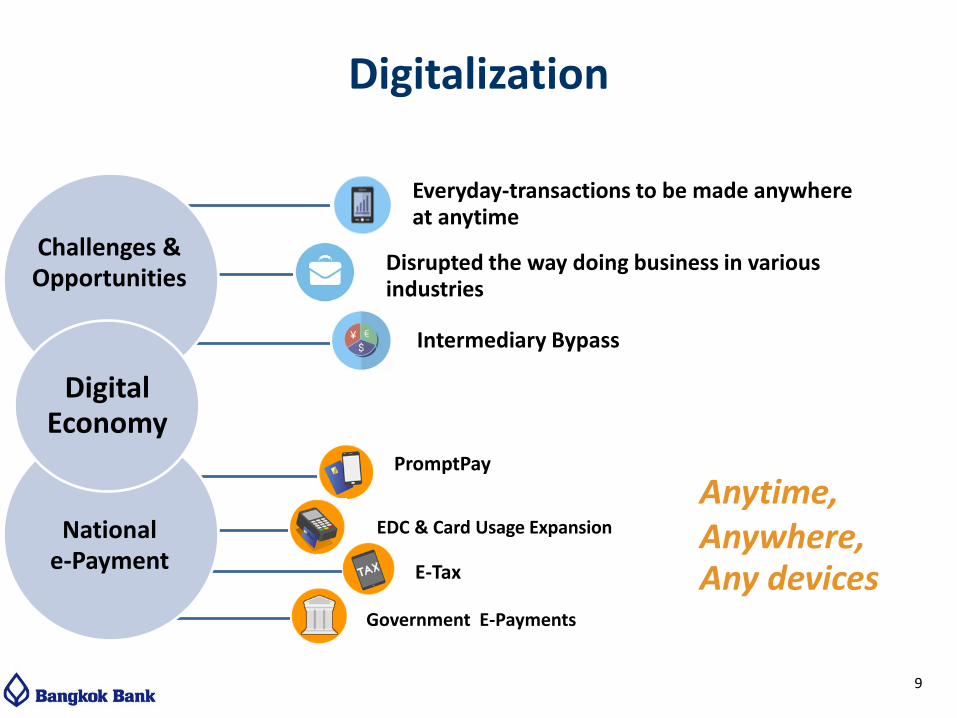
National e-Payment
Digitalization
Anytime, Anywhere, Any devices
Challenges & Opportunities
PromptPay
EDC & Card Usage Expansion
E-Tax
Government E-Payments
Everyday-transactions to be made anywhere at anytime
Disrupted the way doing business in various industries
9
Intermediary Bypass
Digital Economy
1. Operating Environment
2. Bangkok Bank’s Position
3. Our Key Focus & Strategy
4. Our Financial Results 2016 & 1Q17
Bangkok Bank
10
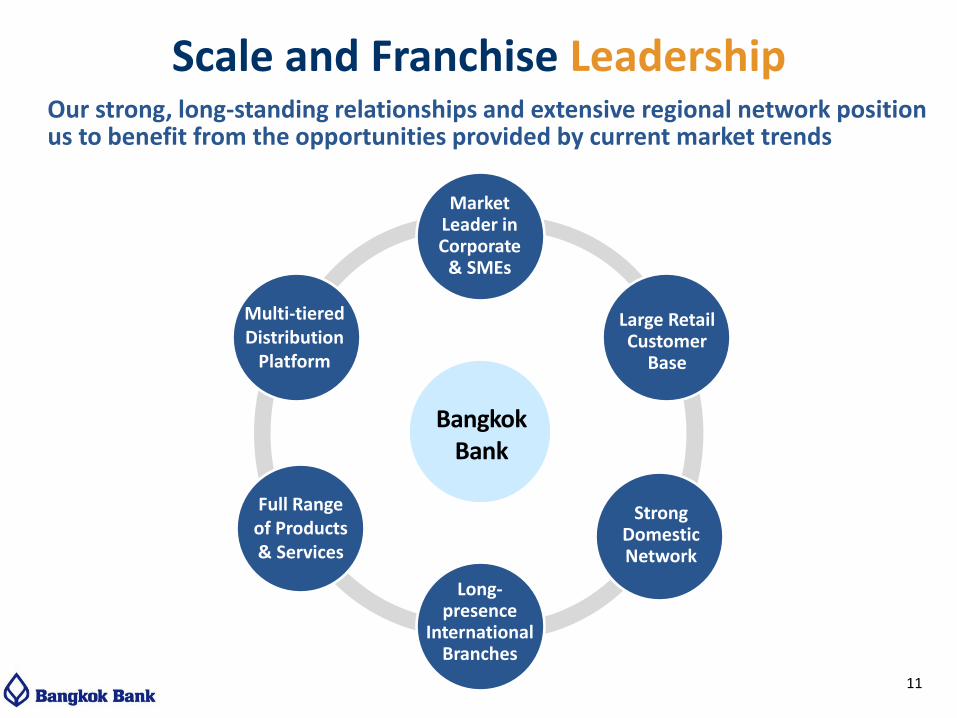
Large Retail Customer
Base
Scale and Franchise Leadership
Multi-tiered Distribution
Platform
Long-presence
International Branches
Full Range of Products & Services
Bangkok Bank
Our strong, long-standing relationships and extensive regional network position us to benefit from the opportunities provided by current market trends
Market Leader in Corporate
& SMEs
Strong Domestic Network
11
60%
70%
80%
90%
100%
110%
2009 2011 2013 2015
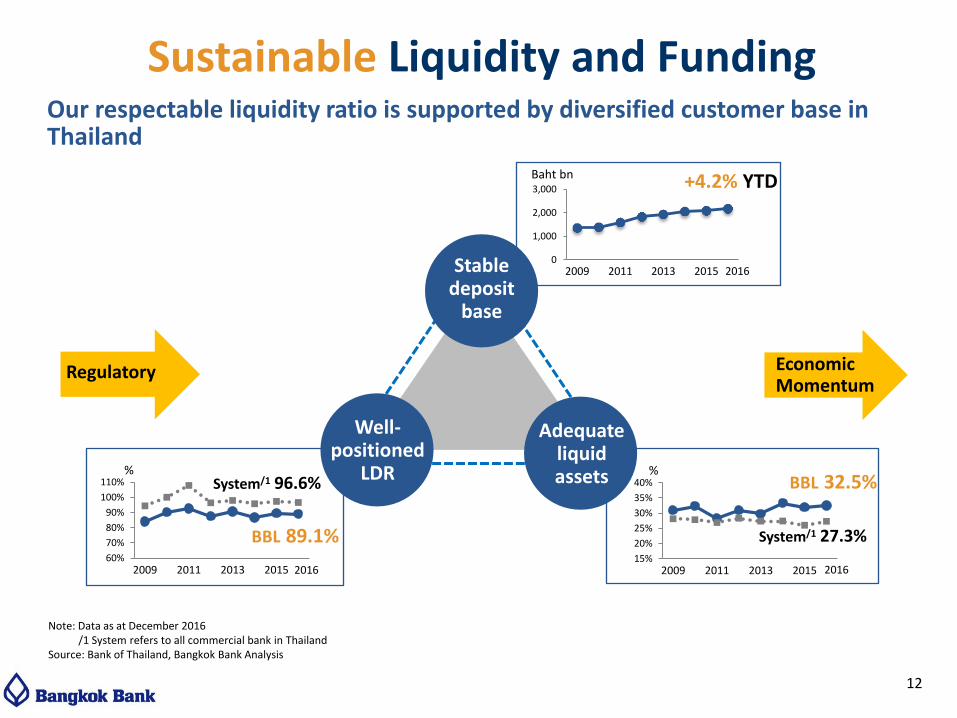
Sustainable Liquidity and Funding
Note: Data as at December 2016 /1 System refers to all commercial bank in Thailand Source: Bank of Thailand, Bangkok Bank Analysis
Stable deposit
base
Well-positioned
LDR
Adequate liquid assets
System/1 96.6%
BBL 89.1%
0
1,000
2,000
3,000
2009 2011 2013 2015
Baht bn +4.2% YTD
Our respectable liquidity ratio is supported by diversified customer base in Thailand
Regulatory Economic Momentum
12
15%
20%
25%
30%
35%
40%
2009 2011 2013 2015
BBL 32.5%
System/1 27.3%
% %
2016
2016
2016
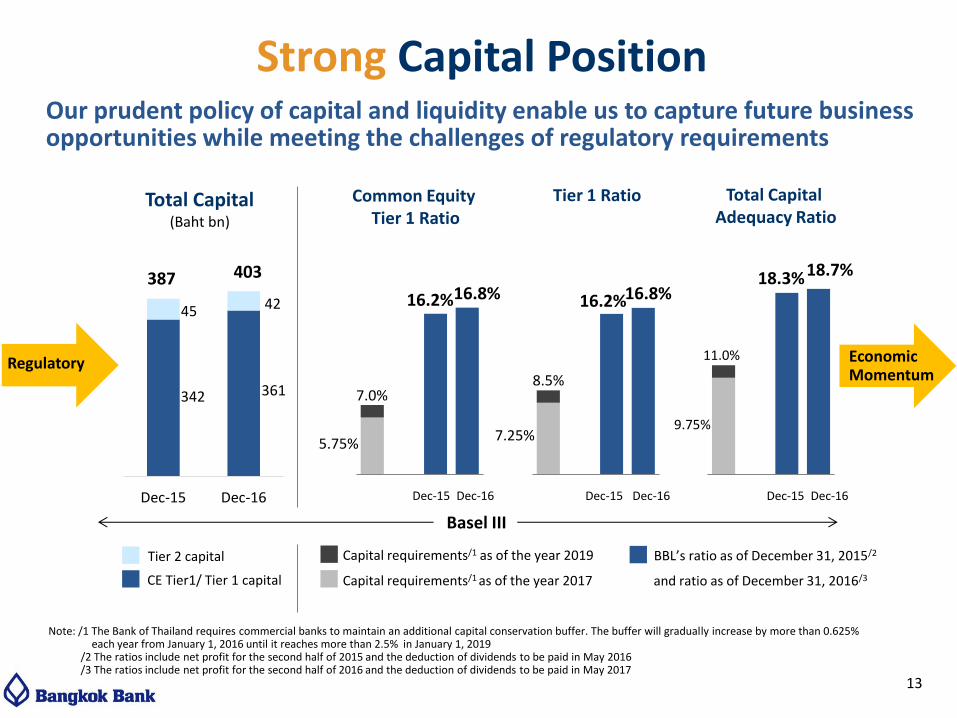
Capital requirements/1 as of the year 2017
Common Equity Tier 1 Ratio
Basel III
Tier 1 Ratio Total Capital Adequacy Ratio
Capital requirements/1 as of the year 2019
7.0%
16.8%
Note: /1 The Bank of Thailand requires commercial banks to maintain an additional capital conservation buffer. The buffer will gradually increase by more than 0.625% each year from January 1, 2016 until it reaches more than 2.5% in January 1, 2019
/2 The ratios include net profit for the second half of 2015 and the deduction of dividends to be paid in May 2016 /3 The ratios include net profit for the second half of 2016 and the deduction of dividends to be paid in May 2017
Dec-15 Dec-16
Total Capital (Baht bn)
CE Tier1/ Tier 1 capital
403
Tier 2 capital
Strong Capital Position Our prudent policy of capital and liquidity enable us to capture future business opportunities while meeting the challenges of regulatory requirements
7.25% 9.75%
342
45
11.0%
8.5%
13
Regulatory Economic Momentum
361
42
387
5.75%
16.2% 16.8% 16.2%
18.7% 18.3%
Dec-15 Dec-16 Dec-15 Dec-16 Dec-15 Dec-16
and ratio as of December 31, 2016/3
BBL’s ratio as of December 31, 2015/2
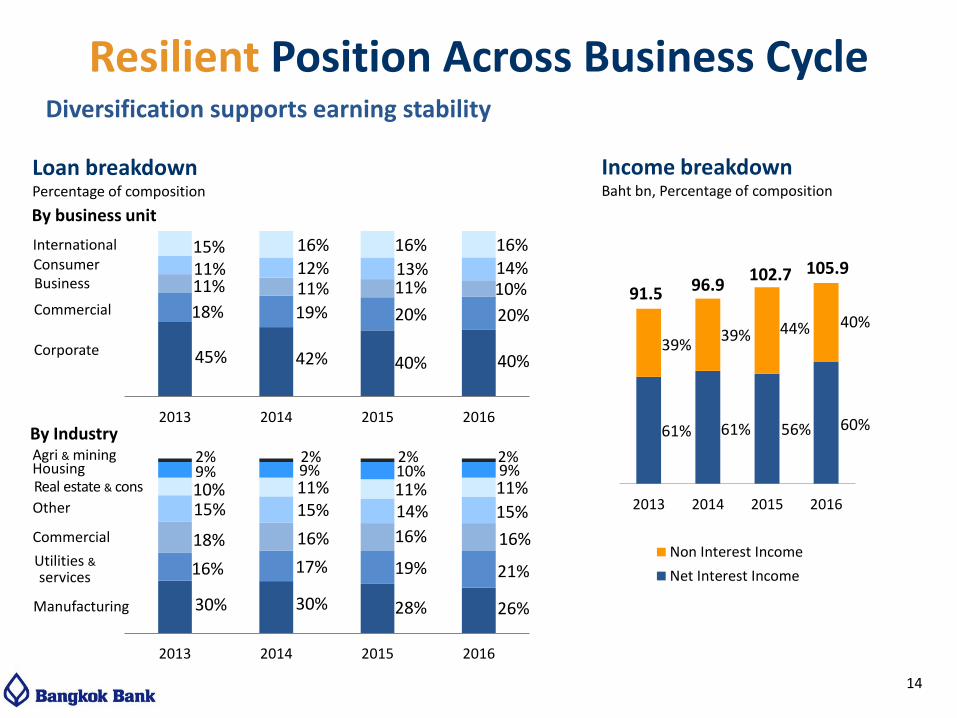
45% 42% 40% 40%
18% 19% 20% 20%
11% 11% 11% 10% 11% 12% 13% 14% 15% 16% 16% 16%
2013 2014 2015 2016
30% 30% 28% 26%
16% 17% 19% 21%
18% 16% 16% 16%
15% 15% 14% 15% 10% 11% 11% 11% 9% 9% 10% 9% 2% 2% 2% 2%
2013 2014 2015 2016
Loan breakdown Percentage of composition
61% 61% 56% 60%
39% 39% 44% 40%
2013 2014 2015 2016
Non Interest Income
Net Interest Income
Income breakdown Baht bn, Percentage of composition
105.9 96.9 91.5
102.7
Resilient Position Across Business Cycle Diversification supports earning stability
By business unit
By Industry
International Consumer Business
Commercial
Corporate
Manufacturing
Utilities & services
Commercial
Other
Housing Real estate & cons
Agri & mining
14
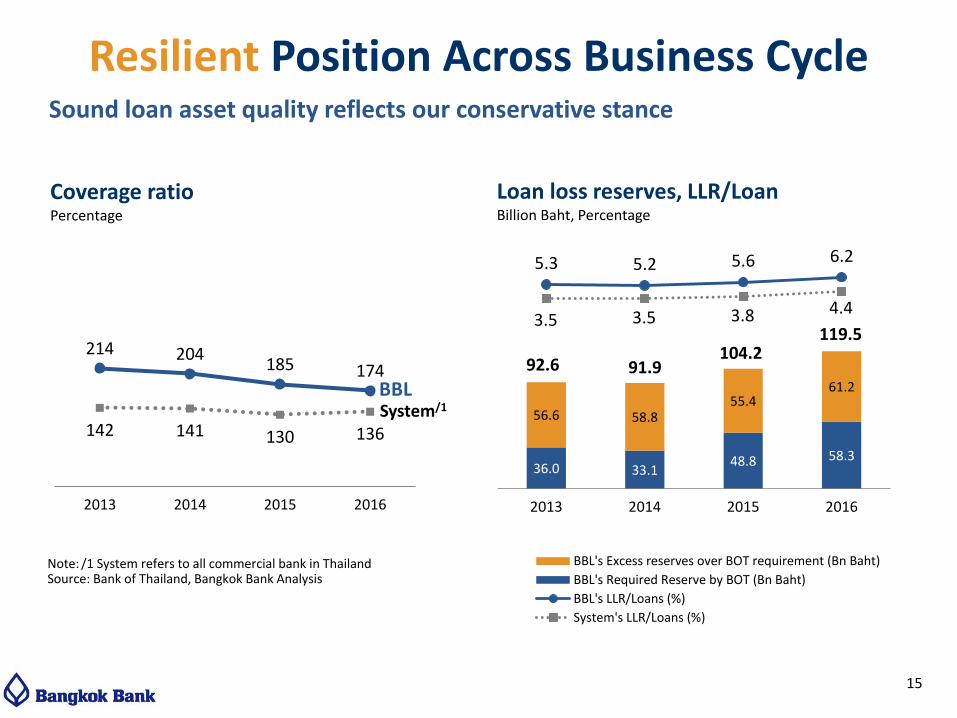
214 204 185 174
142 141 130 136
0
50
100
150
200
250
300
2013 2014 2015 2016
Note: /1 System refers to all commercial bank in Thailand Source: Bank of Thailand, Bangkok Bank Analysis
36.0 33.1 48.8 58.3
56.6 58.8 55.4
61.2
5.3 5.2 5.6 6.2
3.5 3.5 3.8 4.4
-20.00-19.94-19.89-19.83-19.77-19.72-19.66-19.60-19.54-19.49-19.43-19.37-19.32-19.26-19.20-19.15-19.09-19.03-18.97-18.92-18.86-18.80-18.75-18.69-18.63-18.58-18.52-18.46-18.40-18.35-18.29-18.23-18.18-18.12-18.06-18.01-17.95-17.89-17.83-17.78-17.72-17.66-17.61-17.55-17.49-17.44-17.38-17.32-17.26-17.21-17.15-17.09-17.04-16.98-16.92-16.87-16.81-16.75-16.69-16.64-16.58-16.52-16.47-16.41-16.35-16.30-16.24-16.18-16.12-16.07-16.01-15.95-15.90-15.84-15.78-15.73-15.67-15.61-15.55-15.50-15.44-15.38-15.33-15.27-15.21-15.16-15.10-15.04-14.98-14.93-14.87-14.81-14.76-14.70-14.64-14.59-14.53-14.47-14.41-14.36-14.30-14.24-14.19-14.13-14.07-14.02-13.96-13.90-13.84-13.79-13.73-13.67-13.62-13.56-13.50-13.45-13.39-13.33-13.27-13.22-13.16-13.10-13.05-12.99-12.93-12.88-12.82-12.76-12.70-12.65-12.59-12.53-12.48-12.42-12.36-12.31-12.25-12.19-12.13-12.08-12.02-11.96-11.91-11.85-11.79-11.74-11.68-11.62-11.56-11.51-11.45-11.39-11.34-11.28-11.22-11.17-11.11-11.05-10.99-10.94-10.88-10.82-10.77-10.71-10.65-10.60-10.54-10.48-10.42-10.37-10.31-10.25-10.20-10.14-10.08-10.03-9.97-9.91-9.85-9.80-9.74-9.68-9.63-9.57-9.51-9.46-9.40-9.34-9.28-9.23-9.17-9.11-9.06-9.00-8.94-8.89-8.83-8.77-8.71-8.66-8.60-8.54-8.49-8.43-8.37-8.32-8.26-8.20-8.14-8.09-8.03-7.97-7.92-7.86-7.80-7.75-7.69-7.63-7.57-7.52-7.46-7.40-7.35-7.29-7.23-7.18-7.12-7.06-7.00-6.95-6.89-6.83-6.78-6.72-6.66-6.61-6.55-6.49-6.43-6.38-6.32-6.26-6.21-6.15-6.09-6.04-5.98-5.92-5.86-5.81-5.75-5.69-5.64-5.58-5.52-5.47-5.41-5.35-5.29-5.24-5.18-5.12-5.07-5.01-4.95-4.90-4.84-4.78-4.72-4.67-4.61-4.55-4.50-4.44-4.38-4.33-4.27-4.21-4.15-4.10-4.04-3.98-3.93-3.87-3.81-3.76-3.70-3.64-3.58-3.53-3.47-3.41-3.36-3.30-3.24-3.19-3.13-3.07-3.01-2.96-2.90-2.84-2.79-2.73-2.67-2.62-2.56-2.50-2.44-2.39-2.33-2.27-2.22-2.16-2.10-2.05-1.99-1.93-1.87-1.82-1.76-1.70-1.65-1.59-1.53-1.48-1.42-1.36-1.30-1.25-1.19-1.13-1.08-1.02-0.96-0.91-0.85-0.79-0.73-0.68-0.62-0.56-0.51-0.45-0.39-0.34-0.28-0.22-0.16-0.11-0.050.010.060.120.180.240.290.350.410.460.520.580.630.690.750.810.860.920.981.031.091.151.201.261.321.381.431.491.551.601.661.721.771.831.891.952.002.062.122.172.232.292.342.402.462.522.572.632.692.742.802.862.912.973.033.093.143.203.263.313.373.433.483.543.603.663.713.773.833.883.944.004.054.114.174.234.284.344.404.454.514.574.624.684.744.804.854.914.975.025.085.145.195.255.315.375.425.485.545.595.655.715.765.825.885.945.996.056.116.166.226.286.336.396.456.516.566.626.686.736.796.856.906.967.027.087.137.197.257.307.367.427.477.537.597.657.707.767.827.877.937.998.048.108.168.228.278.338.398.448.50
-
30.00
60.00
90.00
120.00
150.00
180.00
2013 2014 2015 2016
BBL's Excess reserves over BOT requirement (Bn Baht)
BBL's Required Reserve by BOT (Bn Baht)
BBL's LLR/Loans (%)
System's LLR/Loans (%)
Resilient Position Across Business Cycle
Loan loss reserves, LLR/Loan Billion Baht, Percentage
92.6 91.9
119.5 104.2
System/1
Sound loan asset quality reflects our conservative stance
Coverage ratio Percentage
System/1 BBL
15
1. Operating Environment
2. Bangkok Bank’s Position
3. Our Key Focus & Strategy
4. Our Financial Results 2016 & 1Q17
Bangkok Bank
16
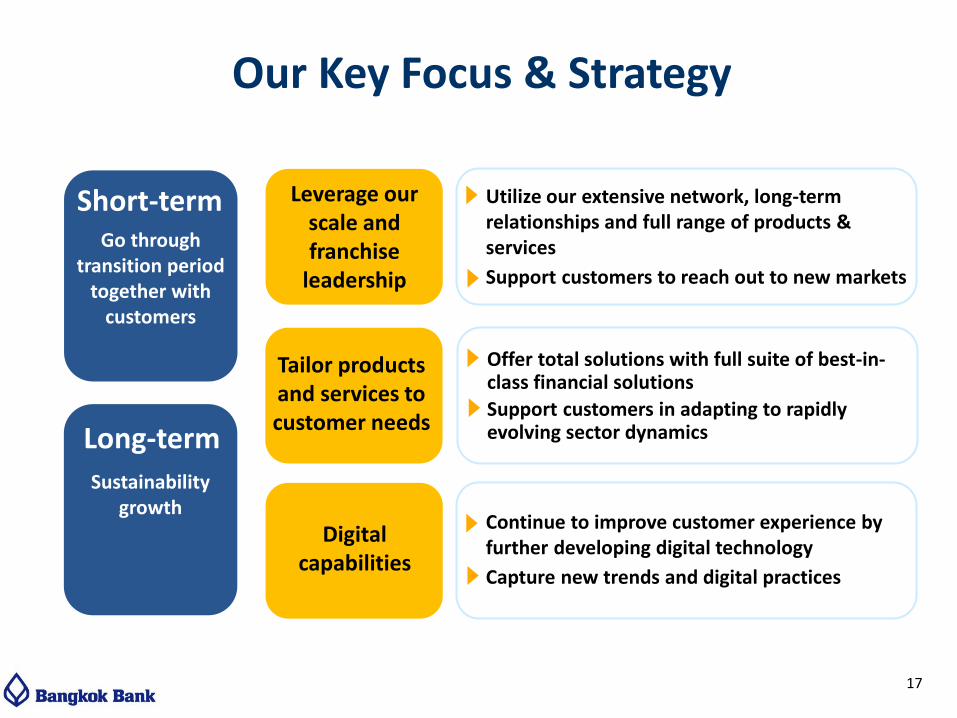
Our Key Focus & Strategy
Go through transition period
together with customers
Short-term
Sustainability growth
Long-term
Leverage our scale and franchise
leadership
Tailor products and services to customer needs
Digital capabilities
Utilize our extensive network, long-term relationships and full range of products & services
Support customers to reach out to new markets
Offer total solutions with full suite of best-in-class financial solutions
Support customers in adapting to rapidly evolving sector dynamics
Continue to improve customer experience by further developing digital technology
Capture new trends and digital practices
17
18
1. Operating Environment
2. Bangkok Bank’s Position
3. Our Key Focus & Strategy
4. Our Financial Results 2016 & 1Q17
Bangkok Bank
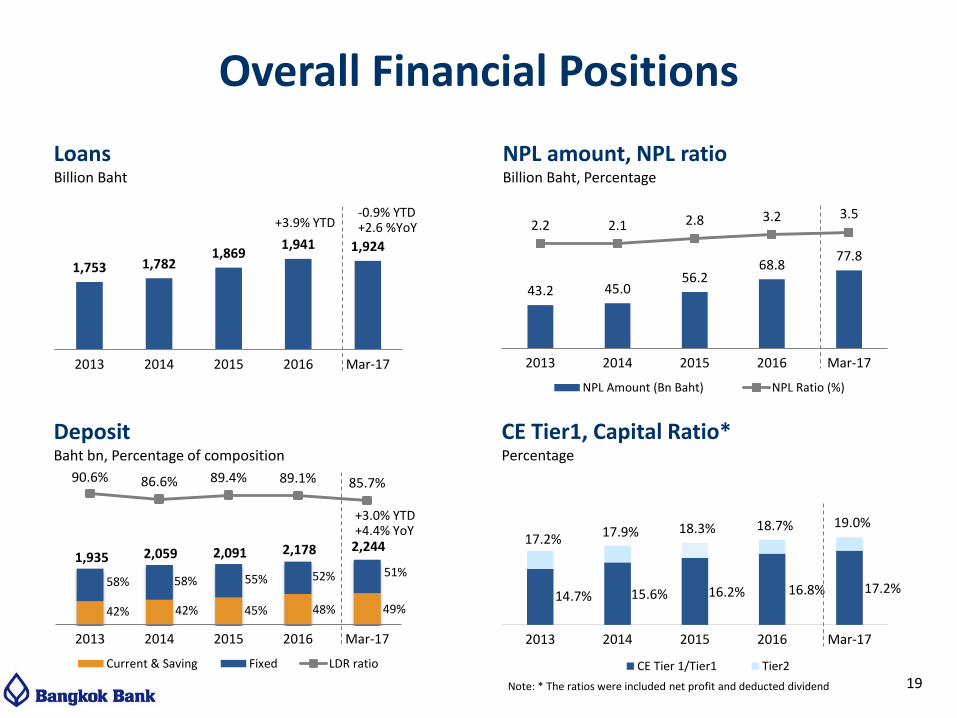
1,753 1,782 1,869
1,941 1,924
2013 2014 2015 2016 Mar-17
90.6% 86.6% 89.4% 89.1% 85.7%
2013 2014 2015 2016 Mar-17
Current & Saving Fixed LDR ratio
Overall Financial Positions
19
NPL amount, NPL ratio Billion Baht, Percentage
Loans Billion Baht
Deposit Baht bn, Percentage of composition
CE Tier1, Capital Ratio* Percentage
43.2 45.0 56.2
68.8 77.8
2.2 2.1 2.8 3.2 3.5
(1 0.00 )
(5 .00)
-
5.0 0
10.00
0
20
40
60
80
100
120
140
160
180
2013 2014 2015 2016 Mar-17
NPL Amount (Bn Baht) NPL Ratio (%)
+3.9% YTD -0.9% YTD +2.6 %YoY
+3.0% YTD +4.4% YoY
14.7% 15.6% 16.2% 16.8% 17.2%
2013 2014 2015 2016 Mar-17
CE Tier 1/Tier1 Tier2
17.2% 17.9% 18.3% 18.7% 19.0%
1,935 2,059 2,091 2,244
58%
42%
58%
42%
55%
45%
52%
48%
2,178
51%
49%
Note: * The ratios were included net profit and deducted dividend
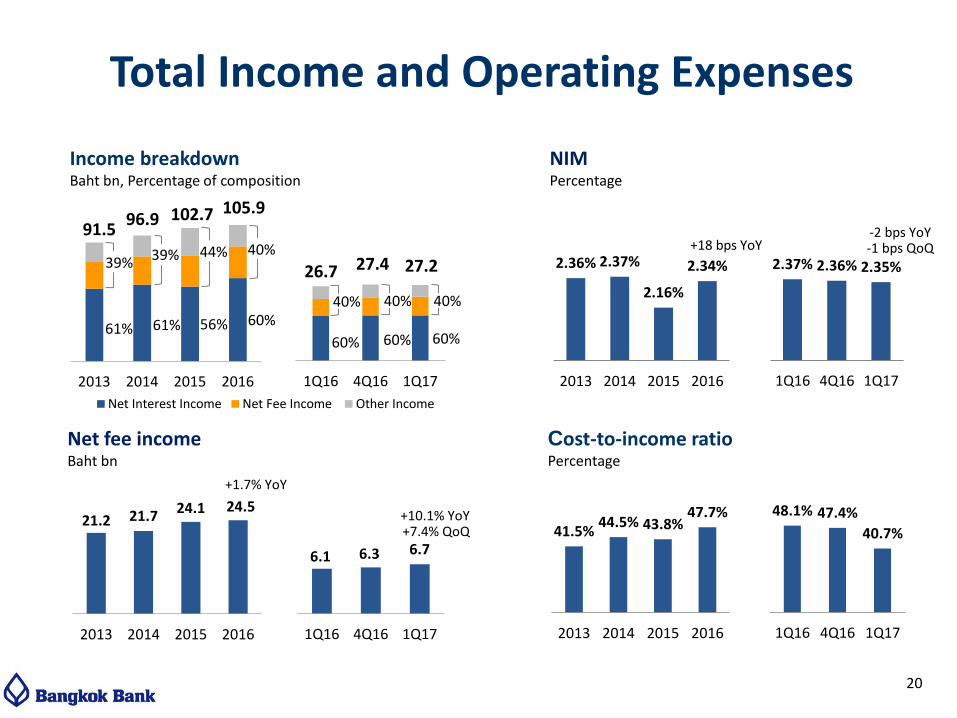
2.37% 2.36% 2.35%
1Q16 4Q16 1Q17
-2 bps YoY -1 bps QoQ
41.5% 44.5% 43.8%
47.7%
2013 2014 2015 2016
6.1 6.3 6.7
0
5
10
15
20
1Q16 4Q16 1Q17
+10.1% YoY +7.4% QoQ
60% 60% 60%
1Q16 4Q16 1Q17
Net Interest Income Net Fee Income Other Income
61% 61% 56% 60%
2013 2014 2015 2016
40%
20
Income breakdown Baht bn, Percentage of composition
NIM Percentage
27.4 26.7
Total Income and Operating Expenses
27.2
40% 40%
105.9 102.7 96.9 91.5
39% 44% 40% 2.36% 2.37%
2.16%
2.34%
2013 2014 2015 2016
+18 bps YoY
Net fee income Baht bn
21.2 21.7 24.1 24.5
0
10
20
30
40
2013 2014 2015 2016
48.1% 47.4%
40.7%
1Q16 4Q16 1Q17
Cost-to-income ratio Percentage
+1.7% YoY
39%
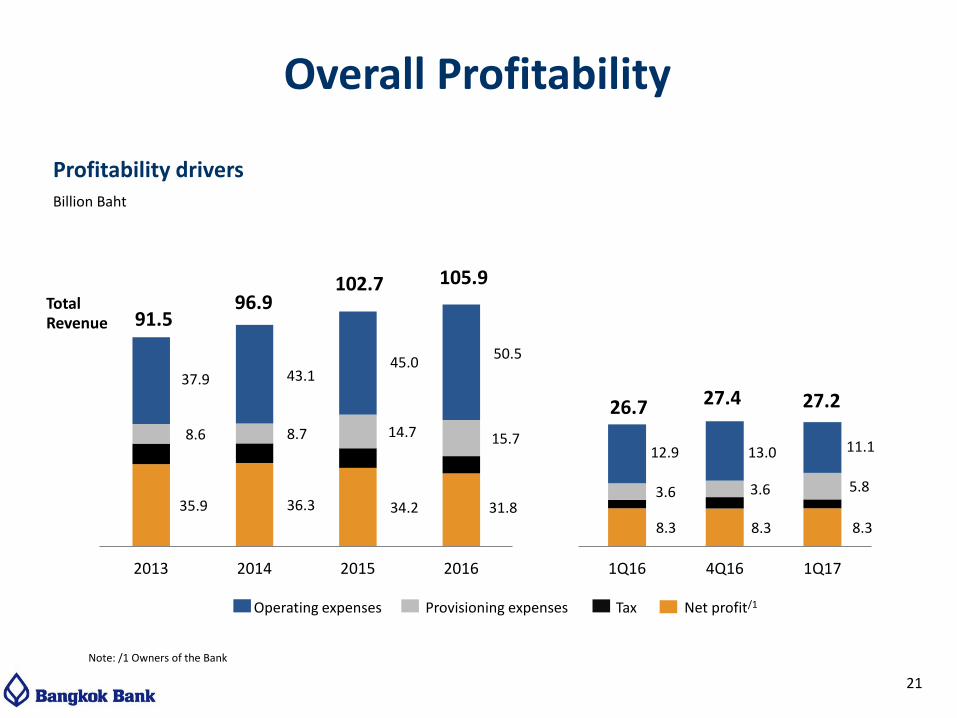
8.3 8.3 8.3
3.6 3.6 5.8
12.9 13.0 11.1
1Q16 4Q16 1Q17
35.9 36.3 34.2 31.8
8.6 8.7 14.7 15.7
37.9 43.1 45.0
50.5
2013 2014 2015 2016
Overall Profitability
Profitability drivers Billion Baht
Note: /1 Owners of the Bank
21
Total Revenue
105.9 102.7 96.9
91.5
26.7 27.4 27.2
Operating expenses Provisioning expenses Tax Net profit/1
Appendix
22
- Financial Results
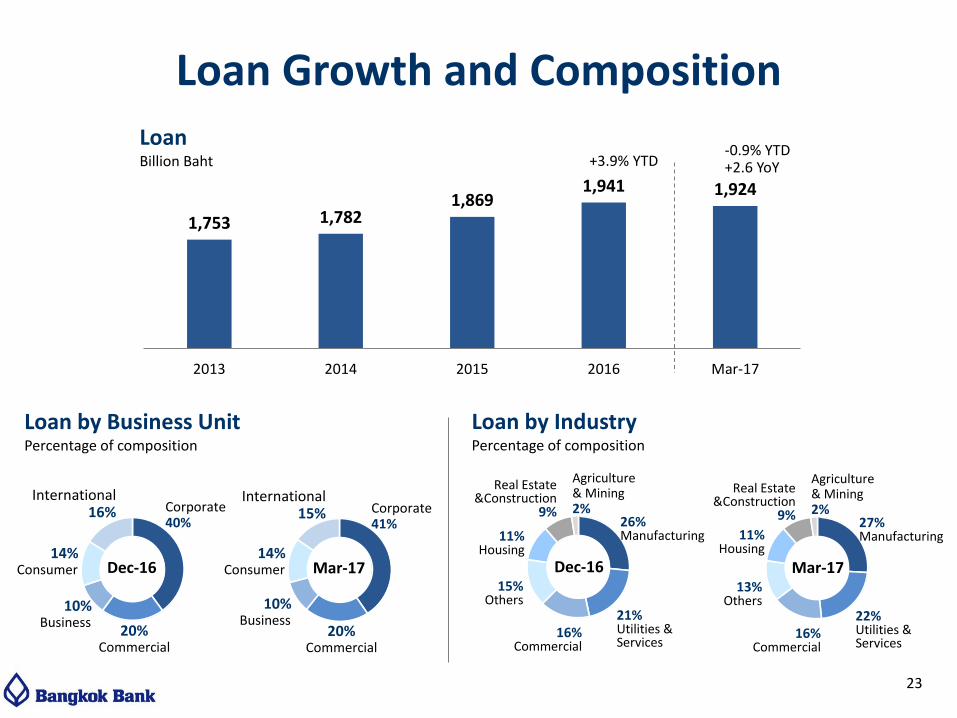
Loan Growth and Composition
Loan by Business Unit Percentage of composition
Dec-16
Loan by Industry Percentage of composition
21% Utilities & Services
11% Housing
15% Others
Agriculture & Mining 2%
26% Manufacturing
Real Estate &Construction
9%
16% Commercial
23
1,753 1,782 1,869
1,941 1,924
2013 2014 2015 2016 Mar-17
Loan Billion Baht
-0.9% YTD +2.6 YoY +3.9% YTD
10% Business
14% Consumer
International 16% Corporate
40%
20% Commercial
Mar-17
10% Business
14% Consumer
20% Commercial
Dec-16
22% Utilities & Services
11% Housing
13% Others
Agriculture & Mining 2%
27% Manufacturing
Real Estate &Construction
9%
16% Commercial
Mar-17
International 15% Corporate
41%
24
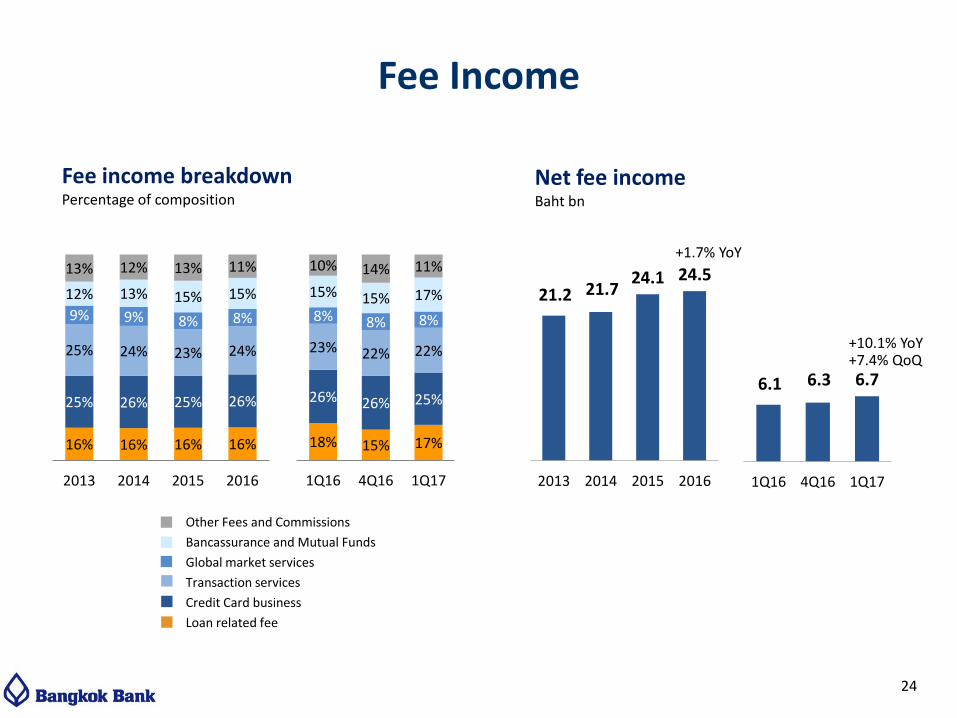
Fee income breakdown Percentage of composition
18% 15% 17%
26% 26% 25%
23% 22% 22%
8% 8% 8%
15% 15% 17%
10% 14% 11%
1Q16 4Q16 1Q17
6.1 6.3 6.7
2
4
6
8
10
12
14
16
18
20
1Q16 4Q16 1Q17
Net fee income Baht bn
+10.1% YoY +7.4% QoQ
Fee Income
16% 16% 16% 16%
25% 26% 25% 26%
25% 24% 23% 24%
9% 9% 8% 8%
12% 13% 15% 15%
13% 12% 13% 11%
2013 2014 2015 2016
21.2 21.7 24.1 24.5
2013 2014 2015 2016
+1.7% YoY
Other Fees and Commissions
Bancassurance and Mutual Funds
Global market services
Transaction services
Credit Card business
Loan related fee

Baht mn
Dec-13 Dec-14 Dec-15 Dec-16 Growth Mar-17 Growth
%YTD %QoQ %YoY
Loans/1 1,752,667 1,782,233 1,868,903 1,941,093 3.9% 1,923,953 -0.9% 2.6%
Deposits 1,935,272 2,058,779 2,090,965 2,178,141 4.2% 2,244,032 3.0% 4.4%
LDR 90.6% 86.6% 89.4% 89.1% -0.3% 85.7% -3.4% -1.5%
NPL 43,228 45,046 56,226 68,841 22.4% 77,772 13.0% 25.8%
NPL ratio 2.2% 2.1% 2.8% 3.2% 0.4% 3.5% 0.3% 0.6%
LLR to NPL 214% 204% 185% 174% -11% 160% -14% -14%
LLR to loans 5.3% 5.2% 5.6% 6.2% 0.6% 6.5% 0.3% 0.7%
Liquid assets/2 772,733 920,034 906,648 956,847 5.5% 1,034,151 8.1% 3.1%
Liquid asset to total assets 29.8% 33.3% 32.0% 32.5% 0.5% 34.5% 2.0% 0.4%
CET1/Tier 1 ratio/3 14.7% 15.6% 16.2% 16.8% 0.6% 17.2% 0.4% 0.7%
CAR/3 17.2% 17.9% 18.3% 18.7% 0.4% 19.0% 0.3% 0.5%
Financial Position
Note: /1 Loans = Loans to customers Less Deferred revenue /2 Liquid assets consist of cash, interbank and money market assets, claims on securities and trading & available-for-sale securities /3 The ratios were included net profit and deducted dividend
25
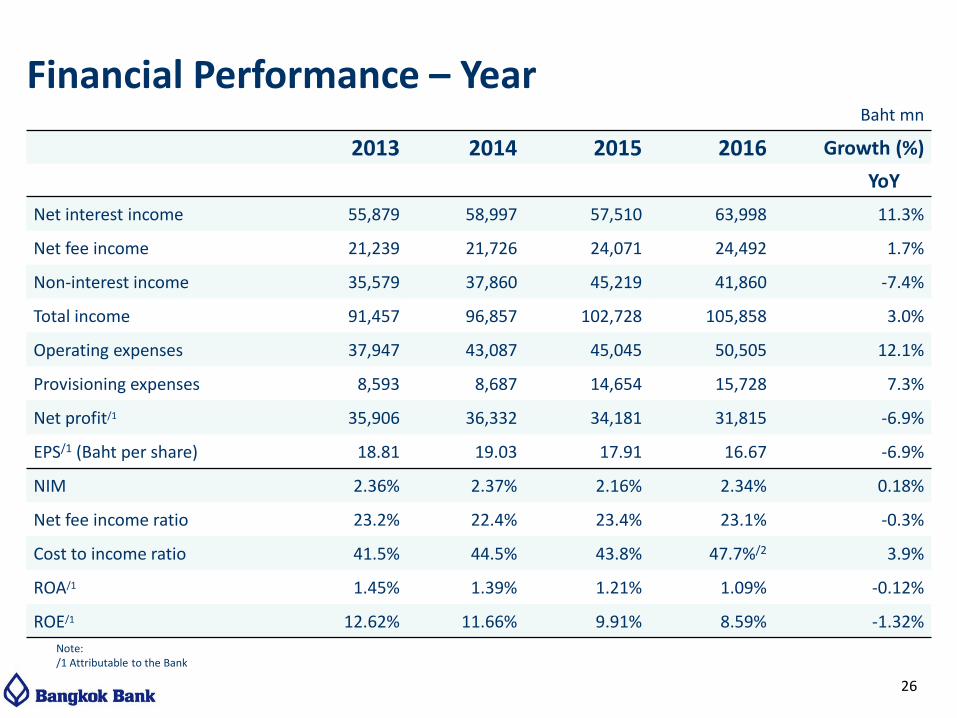
Financial Performance – Year
Note: /1 Attributable to the Bank
Baht mn
2013 2014 2015 2016 Growth (%)
YoY
Net interest income 55,879 58,997 57,510 63,998 11.3%
Net fee income 21,239 21,726 24,071 24,492 1.7%
Non-interest income 35,579 37,860 45,219 41,860 -7.4%
Total income 91,457 96,857 102,728 105,858 3.0%
Operating expenses 37,947 43,087 45,045 50,505 12.1%
Provisioning expenses 8,593 8,687 14,654 15,728 7.3%
Net profit/1 35,906 36,332 34,181 31,815 -6.9%
EPS/1 (Baht per share) 18.81 19.03 17.91 16.67 -6.9%
NIM 2.36% 2.37% 2.16% 2.34% 0.18%
Net fee income ratio 23.2% 22.4% 23.4% 23.1% -0.3%
Cost to income ratio 41.5% 44.5% 43.8% 47.7%/2 3.9%
ROA/1 1.45% 1.39% 1.21% 1.09% -0.12%
ROE/1 12.62% 11.66% 9.91% 8.59% -1.32%
26
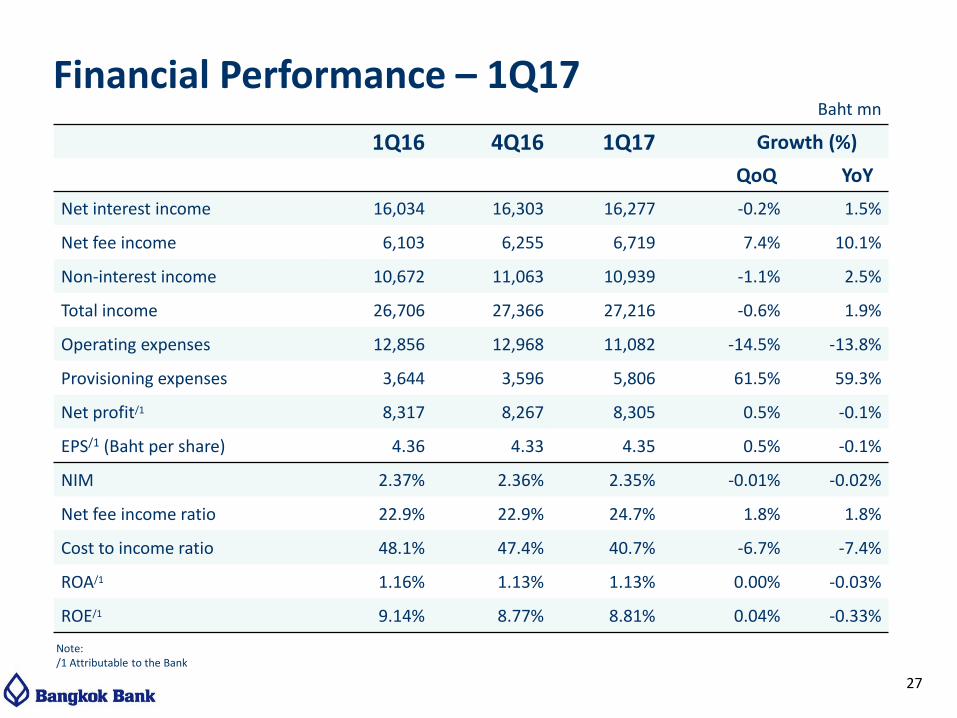
Financial Performance – 1Q17
Note: /1 Attributable to the Bank
Baht mn
1Q16 4Q16 1Q17 Growth (%)
QoQ YoY
Net interest income 16,034 16,303 16,277 -0.2% 1.5%
Net fee income 6,103 6,255 6,719 7.4% 10.1%
Non-interest income 10,672 11,063 10,939 -1.1% 2.5%
Total income 26,706 27,366 27,216 -0.6% 1.9%
Operating expenses 12,856 12,968 11,082 -14.5% -13.8%
Provisioning expenses 3,644 3,596 5,806 61.5% 59.3%
Net profit/1 8,317 8,267 8,305 0.5% -0.1%
EPS/1 (Baht per share) 4.36 4.33 4.35 0.5% -0.1%
NIM 2.37% 2.36% 2.35% -0.01% -0.02%
Net fee income ratio 22.9% 22.9% 24.7% 1.8% 1.8%
Cost to income ratio 48.1% 47.4% 40.7% -6.7% -7.4%
ROA/1 1.16% 1.13% 1.13% 0.00% -0.03%
ROE/1 9.14% 8.77% 8.81% 0.04% -0.33%
27
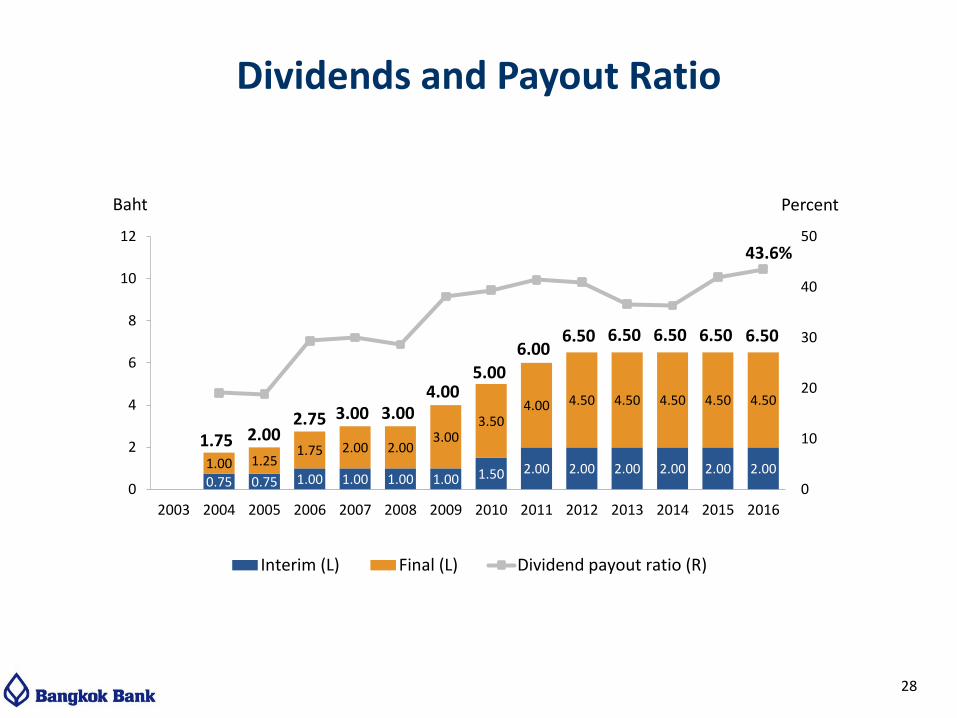
Baht
0.75 0.75 1.00 1.00 1.00 1.00 1.50 2.00 2.00 2.00 2.00 2.00 2.00 1.00 1.25 1.75 2.00 2.00
3.00 3.50
4.00 4.50 4.50 4.50 4.50 4.50
0
10
20
30
40
50
0
2
4
6
8
10
12
2003 2004 2005 2006 2007 2008 2009 2010 2011 2012 2013 2014 2015 2016
Interim (L) Final (L) Dividend payout ratio (R)
5.00
3.00 4.00
6.00 6.50 6.50
43.6%
3.00 2.75 2.00 1.75
Percent
6.50 6.50
Dividends and Payout Ratio
28
6.50
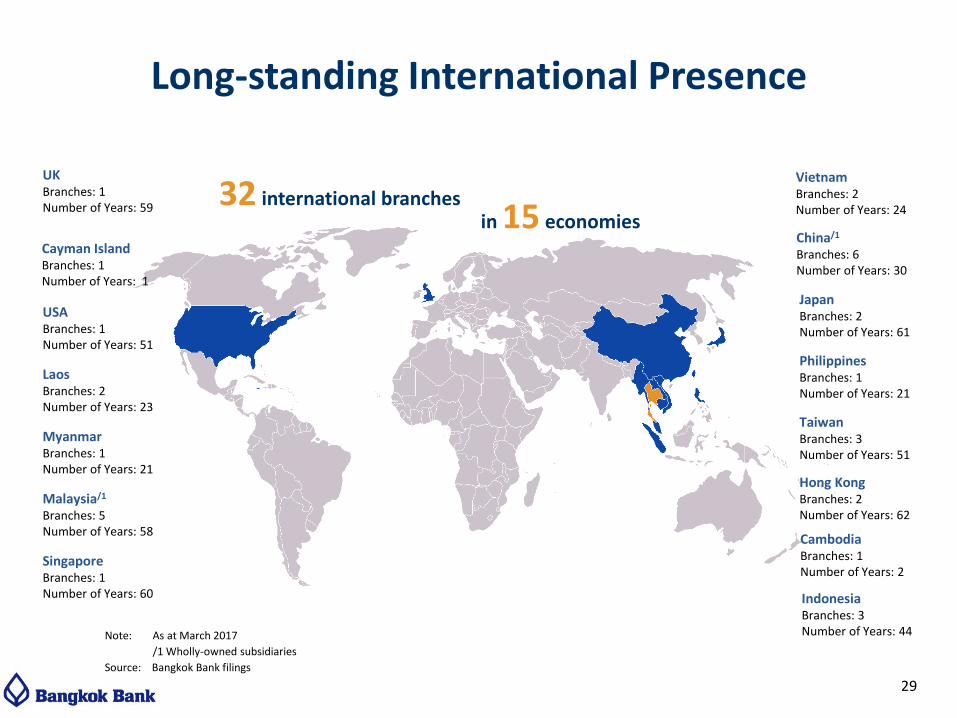
Long-standing International Presence
Japan Branches: 2 Number of Years: 61
UK Branches: 1 Number of Years: 59
USA Branches: 1 Number of Years: 51
Laos Branches: 2 Number of Years: 23
Philippines Branches: 1 Number of Years: 21
Vietnam Branches: 2 Number of Years: 24
China/1
Branches: 6 Number of Years: 30
Myanmar
Branches: 1 Number of Years: 21
Malaysia/1
Branches: 5 Number of Years: 58
Singapore Branches: 1 Number of Years: 60 Indonesia
Branches: 3 Number of Years: 44
Taiwan Branches: 3 Number of Years: 51
Hong Kong Branches: 2 Number of Years: 62
Cayman Island Branches: 1 Number of Years: 1
Cambodia Branches: 1 Number of Years: 2
Note: As at March 2017
/1 Wholly-owned subsidiaries
Source: Bangkok Bank filings
32 international branches
in 15 economies
29
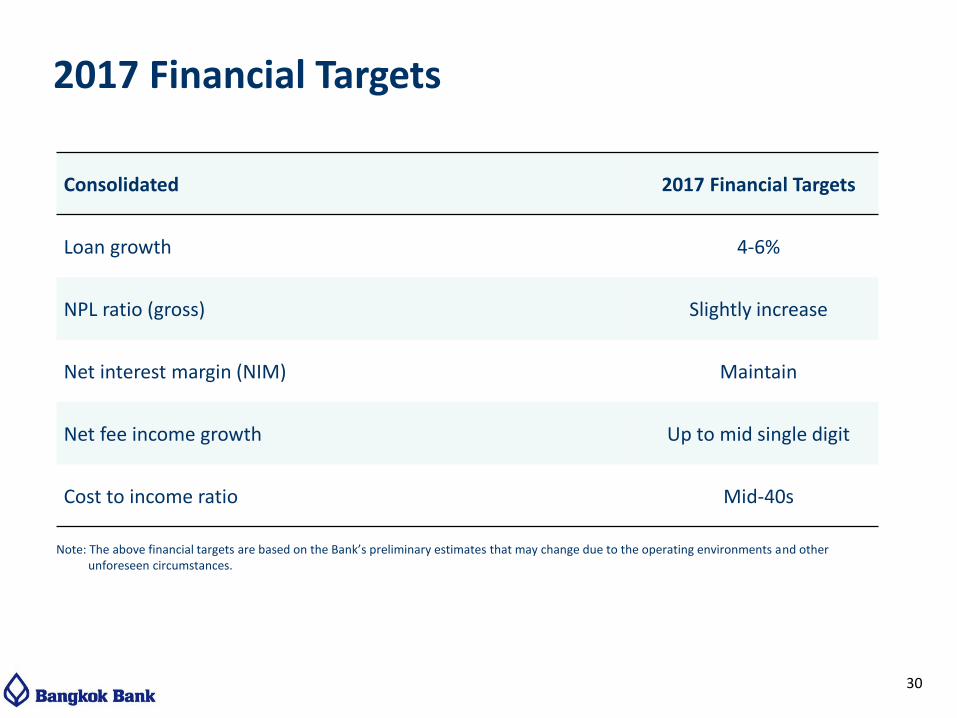
Consolidated 2017 Financial Targets
Loan growth 4-6%
NPL ratio (gross) Slightly increase
Net interest margin (NIM) Maintain
Net fee income growth Up to mid single digit
Cost to income ratio Mid-40s
2017 Financial Targets
Note: The above financial targets are based on the Bank’s preliminary estimates that may change due to the operating environments and other unforeseen circumstances.
30

This presentation is made by Bangkok Bank and may not be copied, altered, offered, sold or otherwise distributed to any other person by any recipient without the consent of Bangkok Bank. Although all reasonable effort has been made to ensure the facts stated herein are accurate and that the opinions contained herein are fair and reasonable, this document is selective in nature and is intended to provide an introduction to, and overview of, the business of Bangkok Bank. Where any information and statistics are quoted from any external source, such information or statistics should not be interpreted as having been adopted or endorsed by Bangkok bank as being accurate. Neither Bangkok Bank nor any of its directors, officers, employees, and advisors nor any other person shall have any liability whatsoever for loss howsoever arising, directly or indirectly, from any use of this information. The facts and information contained herein are as up to date as is reasonably possible and may be subject to revision in the future. Neither Bangkok Bank nor any of its directors, officers, employees or advisors nor any other person makes any representation or warranty, express or implied, as to the accuracy or completeness of the information contained in this presentation. Neither Bangkok Bank nor any of its directors, officers, employees and advisors nor any other person shall have any liability whatsoever for loss howsoever arising, directly or indirectly, from any use of this presentation. This presentation may contain projections or other forward-looking statements related to Bangkok Bank that involve risks and uncertainties. Readers are cautioned that these statements are only projections and may differ materially from actual future results or events. All forward-looking statements are based on information available to Bangkok Bank on the date of its posting and Bangkok Bank assumes no obligation to update such statements unless otherwise required by applicable law. This presentation does not constitute an offer or invitation to subscribe for, or purchase, any shares of Bangkok Bank.
Contact: Investor Relations Team Tel (66) 2 626 4981-2 Fax (66) 2 231 4890 Email: [email protected] Bangkok Bank Website www.bangkokbank.com
For Further Information