
INVESTOR PRESENTATION - Asian Paints
24
Transcript of INVESTOR PRESENTATION - Asian Paints


INVESTOR PRESENTATION
Q4 & 12M : FY 2017-1810th May 2018

This presentation may contain statements which reflect Management’s
current views and estimates and could be construed as forward looking
statements. The future involves certain risks and uncertainties that could
cause actual results to differ materially from the current views being
expressed. Potential risks and uncertainties include such factors as
general economic conditions, foreign exchange fluctuations, competitive
product and pricing pressures and regulatory developments.
Responses can only be given to questions which are not price sensitive.
2

Economic Environment
Company Performance
Business Review
Risks and Outlook
3
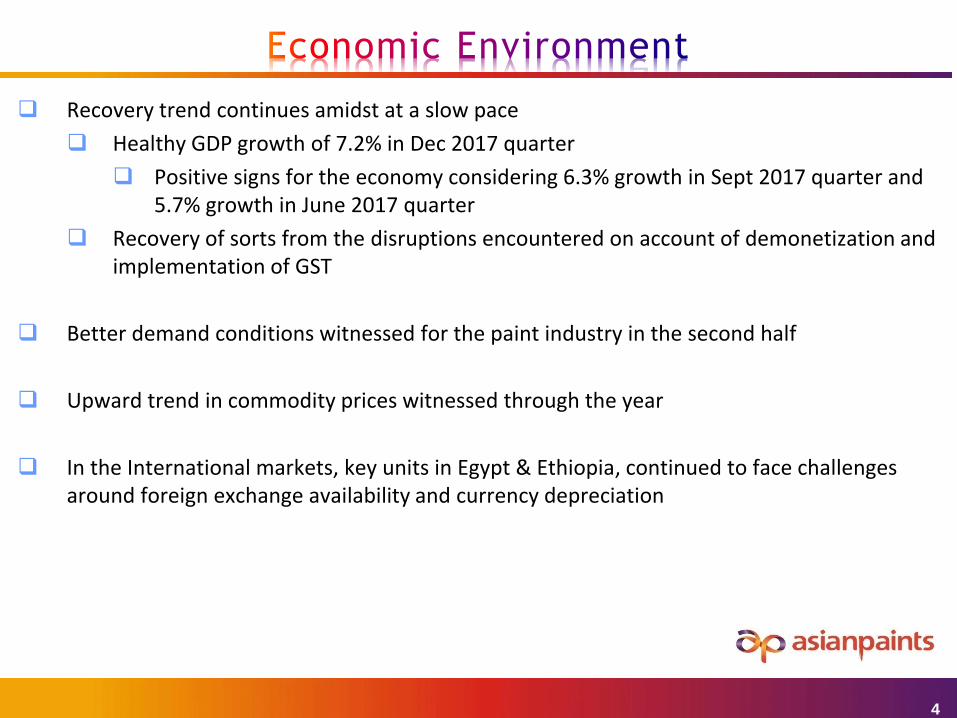
Recovery trend continues amidst at a slow pace
Healthy GDP growth of 7.2% in Dec 2017 quarter
Positive signs for the economy considering 6.3% growth in Sept 2017 quarter and5.7% growth in June 2017 quarter
Recovery of sorts from the disruptions encountered on account of demonetization andimplementation of GST
Better demand conditions witnessed for the paint industry in the second half
Upward trend in commodity prices witnessed through the year
In the International markets, key units in Egypt & Ethiopia, continued to face challengesaround foreign exchange availability and currency depreciation
4

Gro
wth
ove
r L
ast Y
ear
5
6.0% 7.2%
2.3%
13.2%
11.5%
10.2% 10.2%
2.6%
10.5%
5.5%
14.6%
11.3%
13.0%
0.0%
2.0%
4.0%
6.0%
8.0%
10.0%
12.0%
14.0%
16.0%
Mar-15 Jun-15 Sep-15 Dec-15 Mar-16 Jun-16 Sep-16 Dec-16 Mar-17 Jun-17 Sep-17 Dec-17 Mar-18
Demonetisation 8 Nov 2016
GST1 July 2017

Economic Environment
Company Performance
Business Review
Risks and Outlook
6

7
Consequent to the introduction of Goods and Services Tax (GST) with effect
from 1st July, 2017, Central Excise, Value Added Tax (VAT) etc. have been
subsumed into GST. In accordance with Indian Accounting Standard - 18 on
Revenue and Schedule III of the Companies Act, 2013, unlike Excise Duties,
levies like GST, VAT etc. are not part of Revenue. The figures and growth
percentages given herein have been suitably adjusted to make the revenue
from operations for periods upto 30th June 2017 comparable.
The Consolidated results for the current year include the results of Causeway
Paints Lanka (Private) Limited, Sri Lanka, in which Asian Paints International
Private Limited (erstwhile Berger International Private Limited, Singapore),
subsidiary of the company acquired 100% controlling stake on 3rd April 2017
and hence the results are not comparable with the previous periods.
8
0
5000
10000
15000
20000
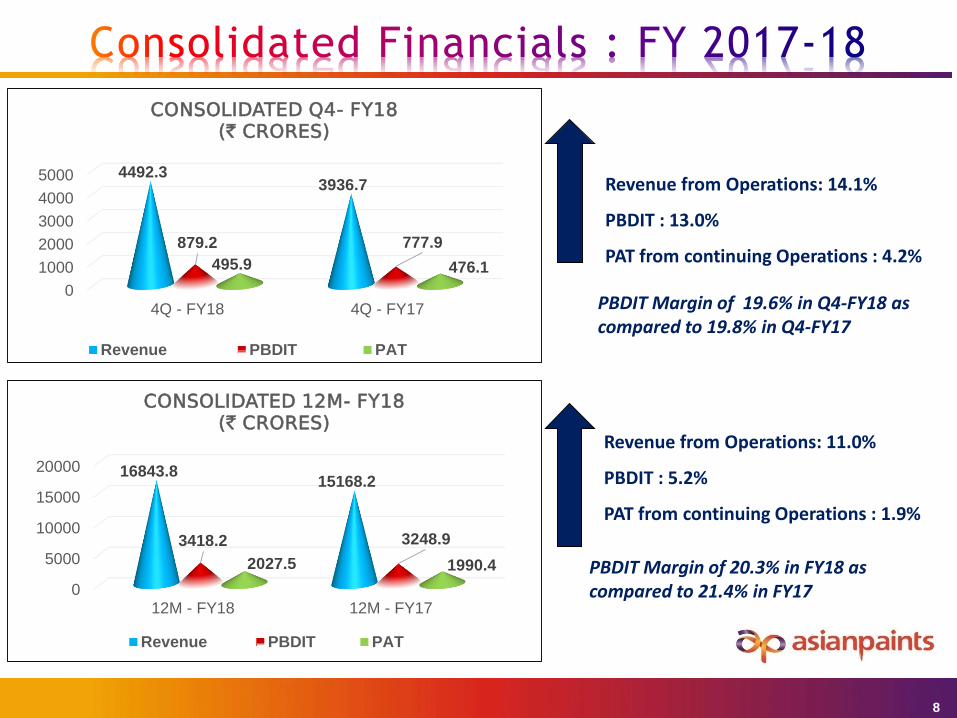
12M - FY18 12M - FY17
16843.815168.2
3418.2 3248.9
2027.5 1990.4
CONSOLIDATED 12M- FY18(` CRORES)
Revenue PBDIT PAT
0
1000
2000
3000
4000
5000
4Q - FY18 4Q - FY17
4492.33936.7
879.2 777.9
495.9 476.1
CONSOLIDATED Q4- FY18(` CRORES)
Revenue PBDIT PAT
Revenue from Operations: 11.0%
PBDIT : 5.2%
PAT from continuing Operations : 1.9%
Revenue from Operations: 14.1%
PBDIT : 13.0%
PAT from continuing Operations : 4.2%
PBDIT Margin of 20.3% in FY18 as compared to 21.4% in FY17
PBDIT Margin of 19.6% in Q4-FY18 as compared to 19.8% in Q4-FY17

9
0
5000
10000
15000
12M - FY18 12M - FY17
14153.712722.8
3198 2971
1894.8 1801.7
STANDALONE 12M- FY18(` CRORES)
Revenue PBDIT PAT
Revenue from Operations: 11.2%
PBDIT : 7.6%
PAT : 5.2%
PBDIT Margin of 22.6% in FY18 as compared to 23.4% in FY17
0
1000
2000
3000
4000
4Q - FY18 4Q - FY17
3775.43340.7
844.5 724.1
491.6 440.8
STANDALONE Q4- FY18(` CRORES)
Revenue PBDIT PAT
Revenue from Operations: 13.0%
PBDIT : 16.6%
PAT : 11.5%
PBDIT Margin of 22.4% in Q4-FY18 as compared to 21.7% in Q4-FY17

76%
12%
2%
9%
FY 2017-18
Deco - India International Home Improvement Industrial Paints
Deco India : Paints, Adhesives, Wall Coverings & Adhesives
International – Operations outside India (Asia, Africa, Middle East and South Pacific)
Industrial – Two 50:50 JVs with PPG Inc, USA for automotive & Industrial paints in India
Home Improvement – Bath & Kitchen business in India
Exited Caribbean operations in July 2017

11
Interim Dividend 265% (` 2.65)
Final Dividend 605% (` 6.05)
Total Dividend 870% (` 8.70)
Payout Ratio : 53.1%
FY
2017-2
018
Interim Dividend 265% (` 2.65)
Special Dividend 200% (` 2.00) **
Final Dividend 565% (` 5.65)
Total Dividend 1030% (` 10.30)
Payout Ratio : 53.1% (excl. special div)
FY
2016-2
017
** Completion of 75 years

0%
10%
20%
30%
40%
50%
60%2
00
7-0
8
200
8-0
9
200
9-1
0
201
0-1
1
201
1-1
2
201
2-1
3
201
3-1
4
201
4-1
5
201
5-1
6
201
6-1
7
201
7-1
8
51.0%
54.0%
39.0%
46.0% 47.0%49.0%
51.0%52.6%
54.2% 53.1% 53.1%
Dividend Payout Ratio
Rs.5.30
Rs.6.10
Rs.7.50
Rs.8.30*
Total dividend in Rs. Dividend Payout Ratio in %
Rs.17.00
Rs.17.50
Rs.27.00
Rs. 32.00
Rs.40.00
Rs.46.00
Rs.8.70
* FY 2016-17 Total dividend of Rs. 10.30 including special dividend of Rs. 2.00 per share

Economic Environment
Company Performance
Business Review
Risks and Outlook
13

Decorative Paints business in India registered low double digit volume growth for Q4
Continued focus on network expansion and opening new ‘Colour Ideas’ store
42,000+ ‘Colour World’ machines and 380+ ‘Colour Ideas’ stores across the country
Good response to the ‘AP Homes’ stores at Coimbatore, New Delhi and Kochi
Opened another store at Raipur in April 2018
Good growth witnessed in the Adhesive, Wall paper and waterproofing segment
Host of new products introduced in the Indian Paint market
Royale HealthShield, Royale Atmos, etc
14
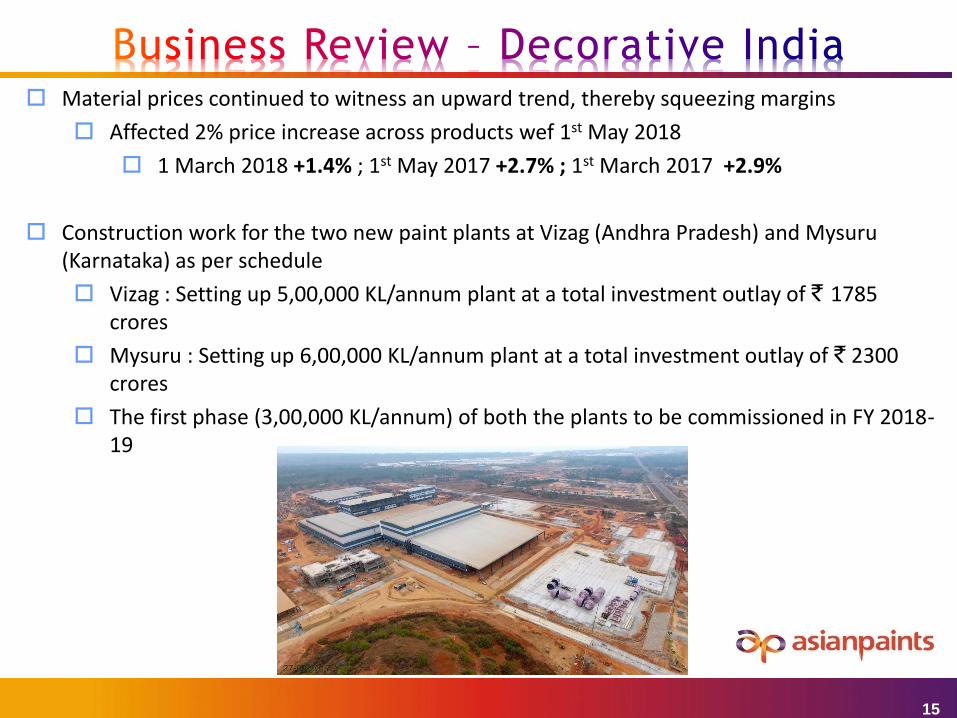
Material prices continued to witness an upward trend, thereby squeezing margins
Affected 2% price increase across products wef 1st May 2018
1 March 2018 +1.4% ; 1st May 2017 +2.7% ; 1st March 2017 +2.9%
Construction work for the two new paint plants at Vizag (Andhra Pradesh) and Mysuru(Karnataka) as per schedule
Vizag : Setting up 5,00,000 KL/annum plant at a total investment outlay of ` 1785crores
Mysuru : Setting up 6,00,000 KL/annum plant at a total investment outlay of ` 2300crores
The first phase (3,00,000 KL/annum) of both the plants to be commissioned in FY 2018-19
15

16
Financials of the current quarter include the financials of Causeway Paints, Sri Lanka which
was acquired by Asian Paints International Pvt Ltd, Singapore (erstwhile Berger International
Private Ltd (BIPL)), our wholly owned subsidiary, on 3rd April 2017
Hence the numbers are not comparable with the financials of the previous quarter
The units in Oman, Bangladesh & Nepal registered decent topline growth
Sluggish demand conditions in Sri Lanka impacted the financials significantly
The greenfield paint plant at Indonesia with a total capacity of 5,000 MT/annum wasinaugurated during the year
Business has picked up and we are witnessing good sales
Adverse exchange rate fluctuations, especially currency devaluation in Egypt & Ethiopiaimpacted operations
Raw Material procurement continued to be a concern due to forex unavailability
Higher material prices impacted operational profitability of the group

17
Asia : Nepal, Sri Lanka, Bangladesh, Singapore & Indonesia
Middle East : UAE, Bahrain & Oman
Africa : Egypt & Ethiopia
South Pacific : Fiji, Tonga, Solomon Islands, Vanuatu & Samoa
24.0%
21.0%48.0%
6.0%
IBU Group
Middle East Africa Asia South Pacific
Current year financials of Asia includes Causeway (Sri Lanka) which was acquired in April 2017 and hence not comparable with previous year
Excluding Causeway, The revenue growth of Asia would had been 14% ; IBU revenue would have been 3.8% lower than previous year
The company divested its entire stake in Caribbean (Jamaica, Barbados and Trinidad & Tobago) during the year. The resultant profit of Rs. 67.47 crores has been included in results from discontinued operations. (The above table excludes the financials of discontinued operations)
12M- FY18 12M - FY17 Gr(%) 12M- FY18 12M - FY17 Gr(%)
Asia 1,071 695 54% 81 54 50%
Middle East 538 519 4% 42 53 -21%
Africa 466 635 -27% 58 104 -44%
South Pacific 141 144 -2% 33 35 -6%
IBU 2,176 1,972 10% 167 231 -28%
PBT (` Crores)Net Sales (` Crores)

PPG Asian Paints (PPGAP)
The business registered better growth in H2 as compared to the earlierperiod.
Net sales grew by double digits during the year driven by gooddemand in the automotive and General Industrial business segment
The setting up of Dahej (Gujarat) plant for Resins is progressing as pertimelines
Asian Paints PPG (APPPG)
In FY18, Net Sales grew by 7.7% to ` 394.6 crores; PBIT at ` 10.6 crores
Registered decent growth in the quarter led by good performance inthe powder coatings and protective coatings segment
18
Under IND-AS, PPG-AP to be treated as an associate company wherein only APL’s share of Profit after Tax of PPG-
AP consolidated as against proportionate consolidation of every line item of P&L. At the same time, AP-PPG to be
consolidated as a subsidiary of APL in the consolidated financials.
Higher raw
material
prices
impacted
profitability
of both these
industrial
businesses

SLEEK
Present in the kitchen segment; introduced wardrobes over the last year
Registered Net Sales of ` 169.5 crores in FY18; Full year growth of 12.3%
PBIT Loss of ` 10.1 crores during the year
In Dec 2017, company acquired balance 49% of Sleek from its erstwhile promoters
Sleek is now a wholly owned subsidiary of the company
ESS ESS
Registered Net Sales of ` 158.2 crores in FY18; Full year growth of 20.3%
PBIT Loss of ` 19.0 crores for the year
19
• Both Sleek & Ess Ess saw pick-up in demand in the second half• Sleek revenues grew by 18% while Ess Ess sales grew by 32% in H2
• Higher material prices impacted business profitability for Sleek and Ess Ess• Continuous focus on enhancing distribution reach and driving operational efficiencies for
both the businesses.

Total capex at the Standalone level for FY18 was about ` 1350 crores
` 1100 crores was spent towards the two new paint manufacturing facilities being
built at Vizag (Andhra Pradesh) and Mysuru (Karnataka)
Capex for FY19 will be around ` 1000 crores

Economic Environment
Company Performance
Business Review
Risks and Outlook
21
Indian economy expected to fare better in FY19
Projections of GDP growth ~7.5% FY19
Normal monsoon forecast augurs well for the economy especially rural demand
Concerns on smooth roll-out of GST reporting requirements, e-way bills etc
Inflationary trend in the Indian as well as Global Economy Raw material prices expected to inch up further
Rupee volatility needs to be watched out for
Certain international markets continue to be volatile and unpredictable
22

THANK YOU
