Investor Presentation
24
Procera Networks Investor Presentation August 2011
-
Upload
proceranetworks -
Category
Business
-
view
414 -
download
5
description
Investor Presentation - August 2011
Transcript of Investor Presentation
Procera Networks Investor Presentation
August 2011
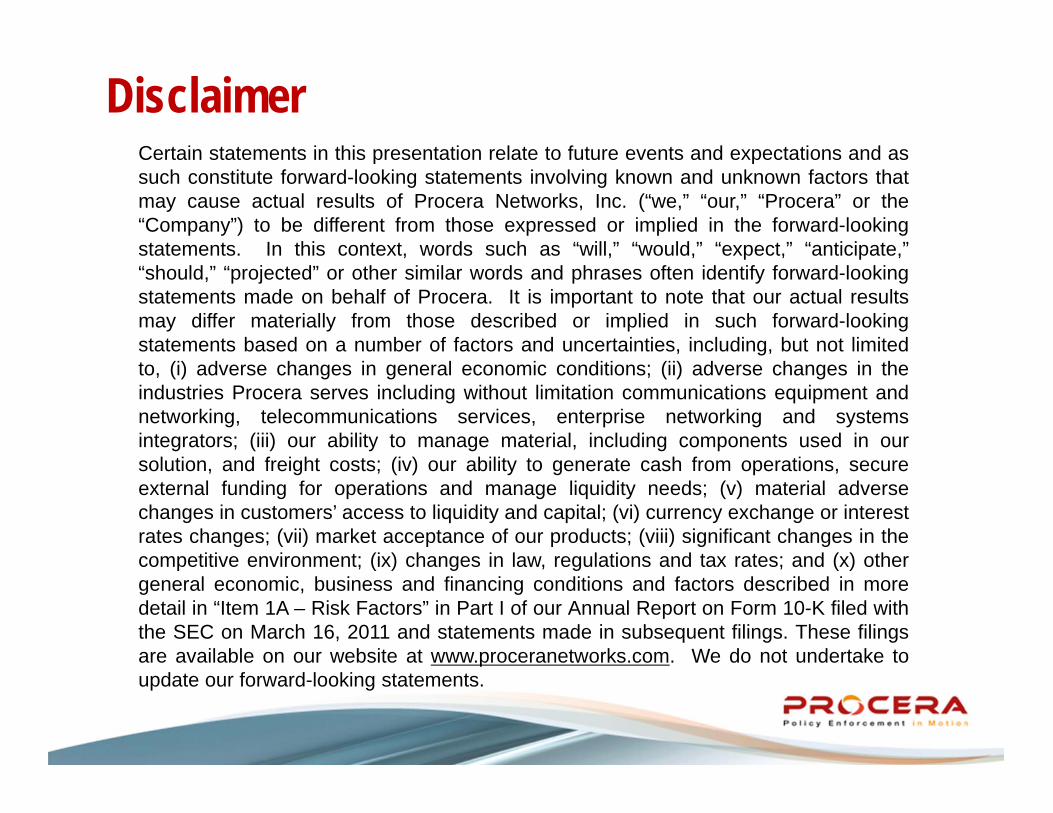
Disclaimer Certain statements in this presentation relate to future events and expectations and as such constitute forward-looking statements involving known and unknown factors that may cause actual results of Procera Networks, Inc. (“we,” “our,” “Procera” or the “Company”) to be different from those expressed or implied in the forward-looking statements. In this context, words such as “will,” “would,” “expect,” “anticipate,” “should,” “projected” or other similar words and phrases often identify forward-looking statements made on behalf of Procera. It is important to note that our actual results may differ materially from those described or implied in such forward-looking statements based on a number of factors and uncertainties, including, but not limited to, (i) adverse changes in general economic conditions; (ii) adverse changes in the industries Procera serves including without limitation communications equipment and networking, telecommunications services, enterprise networking and systems integrators; (iii) our ability to manage material, including components used in our solution, and freight costs; (iv) our ability to generate cash from operations, secure external funding for operations and manage liquidity needs; (v) material adverse changes in customers’ access to liquidity and capital; (vi) currency exchange or interest rates changes; (vii) market acceptance of our products; (viii) significant changes in the competitive environment; (ix) changes in law, regulations and tax rates; and (x) other general economic, business and financing conditions and factors described in more detail in “Item 1A – Risk Factors” in Part I of our Annual Report on Form 10-K filed with the SEC on March 16, 2011 and statements made in subsequent filings. These filings are available on our website at www.proceranetworks.com. We do not undertake to update our forward-looking statements.
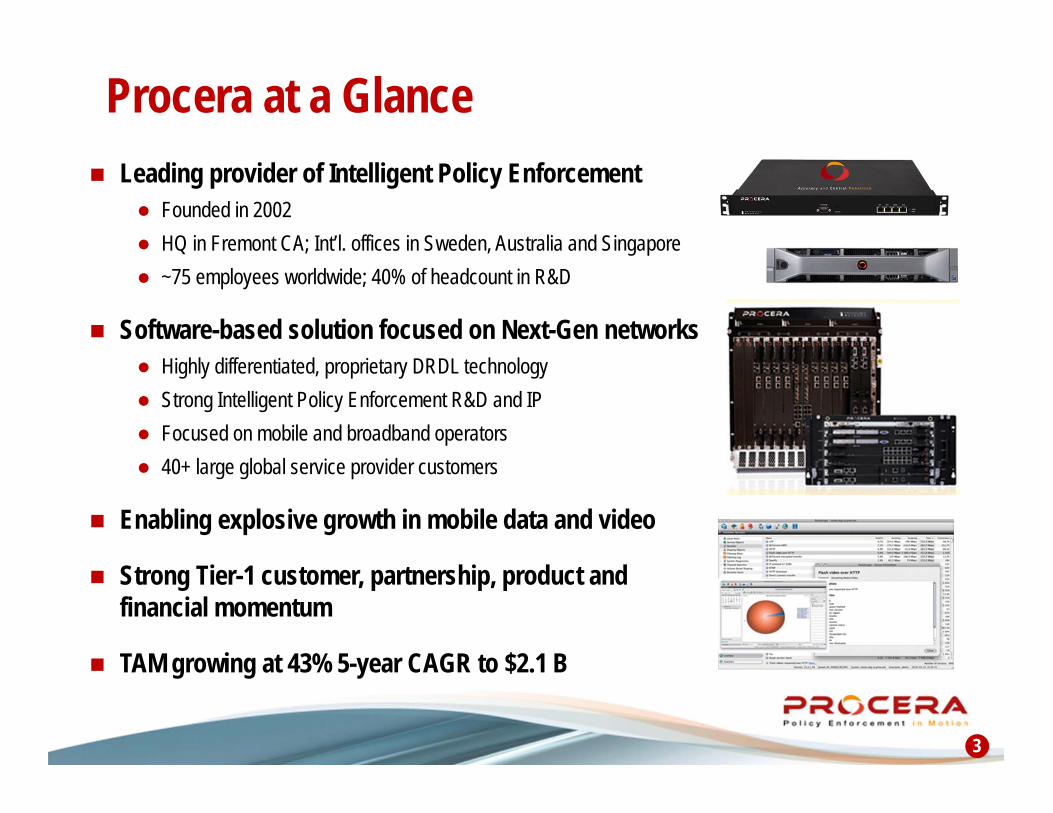
Leading provider of Intelligent Policy Enforcement Founded in 2002 HQ in Fremont CA; Int’l. offices in Sweden, Australia and Singapore ~75 employees worldwide; 40% of headcount in R&D
Software-based solution focused on Next-Gen networks Highly differentiated, proprietary DRDL technology Strong Intelligent Policy Enforcement R&D and IP Focused on mobile and broadband operators 40+ large global service provider customers
Enabling explosive growth in mobile data and video
Strong Tier-1 customer, partnership, product and financial momentum
TAM growing at 43% 5-year CAGR to $2.1 B
Procera at a Glance
3

Recent Business Momentum Tier-1 Customer Wins: 2010 – 2011 New Product Releases
Mobile Cable Fixed / Mobile
Strong Partnership Momentum Financial Momentum
IPv6 – PacketLogic Real-Time Enforcement compatible with 3GPP, DOCIS 3.0, TISPAN
PL8820 – 30 Gbps in 2RU chassis
Next Gen PL10000 – 120 Gbps, 10 mm subs per chasis
PacketLogic 12.4 – enhanced visibility into network congestion
Smart Campus – turnkey network management solution for Higher Education
Very strong revenue growth in 1H:11 – 105% growth YoY
Record Q2 bookings up 45% YoY; strong pipeline
Gross margin increased 5% YoY to 62% in Q2:11
Added 20 new service provider cust. in Q2:11; Increasing repeat orders from existing customers
Increased revenue guidance to $35 million for 2011 – 75% growth YoY
Integrated policy management solution
Integrated policy management solution for LTE
Integrated charging solution
Performance management and optimization
Technology license and re-sale agreement
Integrated policy management solution
4
Malaysian Mobile Operator
E. European Cable Company
U.S. Cable Company
Canadian Cable Company
Scandinavian Incumbent
E. European Incumbent
Australian Incumbent
New APAC Mobile
Operator

Investment Highlights
Leading Provider in the Large, High-Growth IPE Market
Leveraged to the Growth in Mobile and IP Data Consumption
Software-based Solution Leveraging Industry-Standard Hardware
Global Tier-1 Customer Footprint Across Mobile and Broadband
Accelerating Revenue Growth and Expanding Margins
Outstanding R&D Capabilities; Proven Leadership Team
5
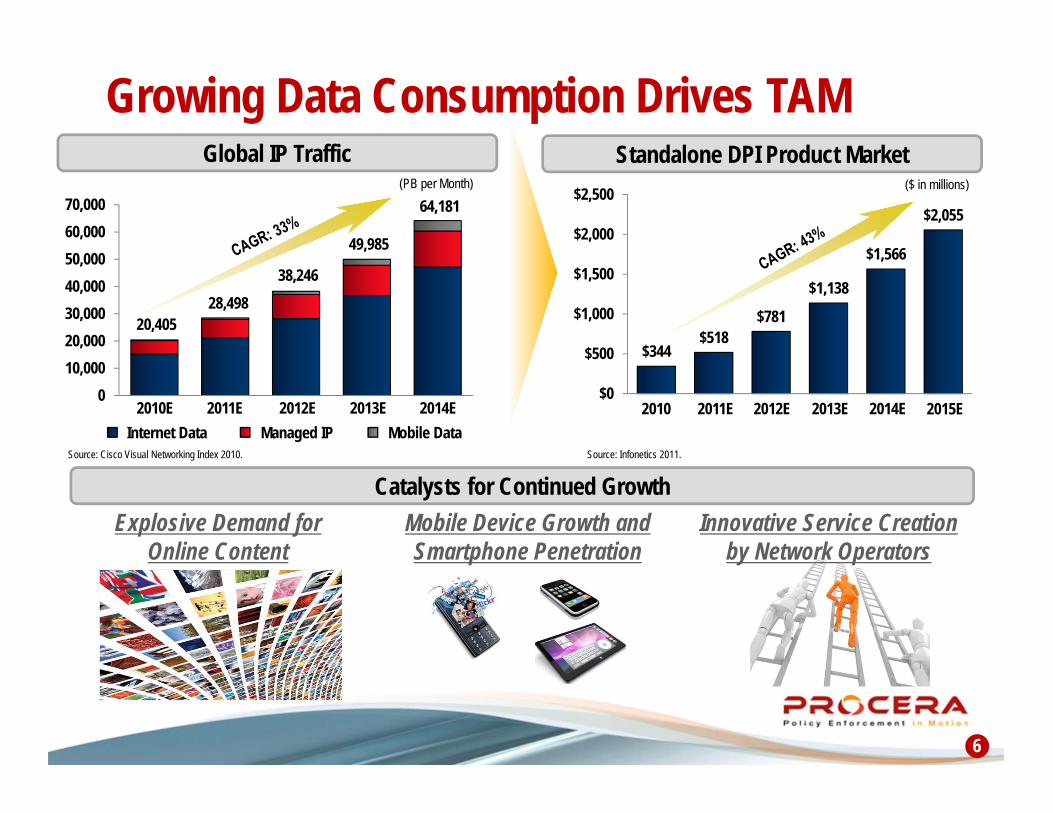
Catalysts for Continued Growth
$344 $518
$781
$1,138
$1,566
$2,055
$0
$500
$1,000
$1,500
$2,000
$2,500 ($ in millions)
2010 2011E 2012E 2013E 2014E 0
10,00020,00030,00040,00050,00060,00070,000
Internet Data Managed IP Mobile Data
(PB per Month)
64,181
38,246 28,498
20,405
2010E 2011E 2012E 2013E 2014E
Source: Cisco Visual Networking Index 2010. Source: Infonetics 2011.
Growing Data Consumption Drives TAM
Mobile Device Growth and Smartphone Penetration
Explosive Demand for Online Content
Innovative Service Creation by Network Operators
49,985
Standalone DPI Product Market Global IP Traffic
6
2015E

The Internet Will Be Televised In Real-Time
7

Smart Device Proliferation Changing Behavior
8
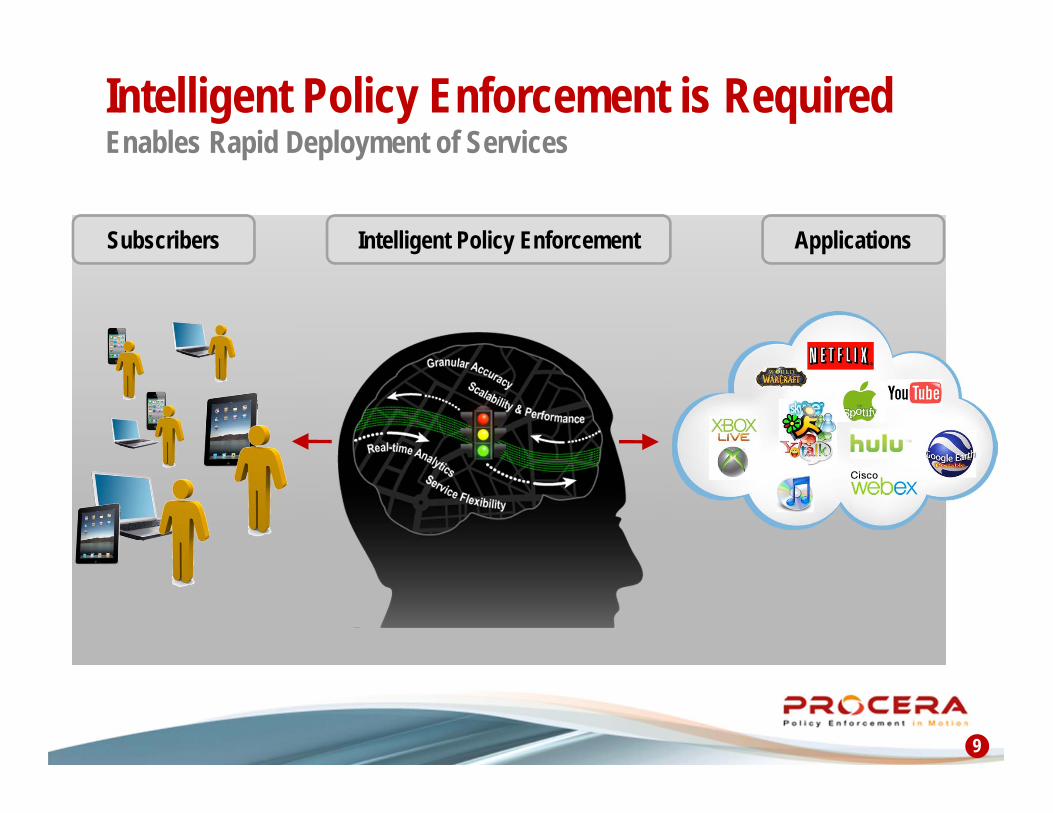
Intelligent Policy Enforcement is Required Enables Rapid Deployment of Services Subscribers Intelligent Policy Enforcement Applications
9

Why Are Operators Buying IPE?
Network Intelligence Network Optimization Security / Protection Tiered Services
Subscriber, service tier, location, device and traffic awareness intuitively combined to assess trends and user behavior. Improve quality and postpone CAPEX investments by optimizing the use of network resources to function with today’s plethora of applications. Intelligence enables early detection and mitigation of anomalies that indicate security issues. Manage subscriber offerings and service packages based on user behavior analysis and customer requests.
Solution Solution Benefit
10
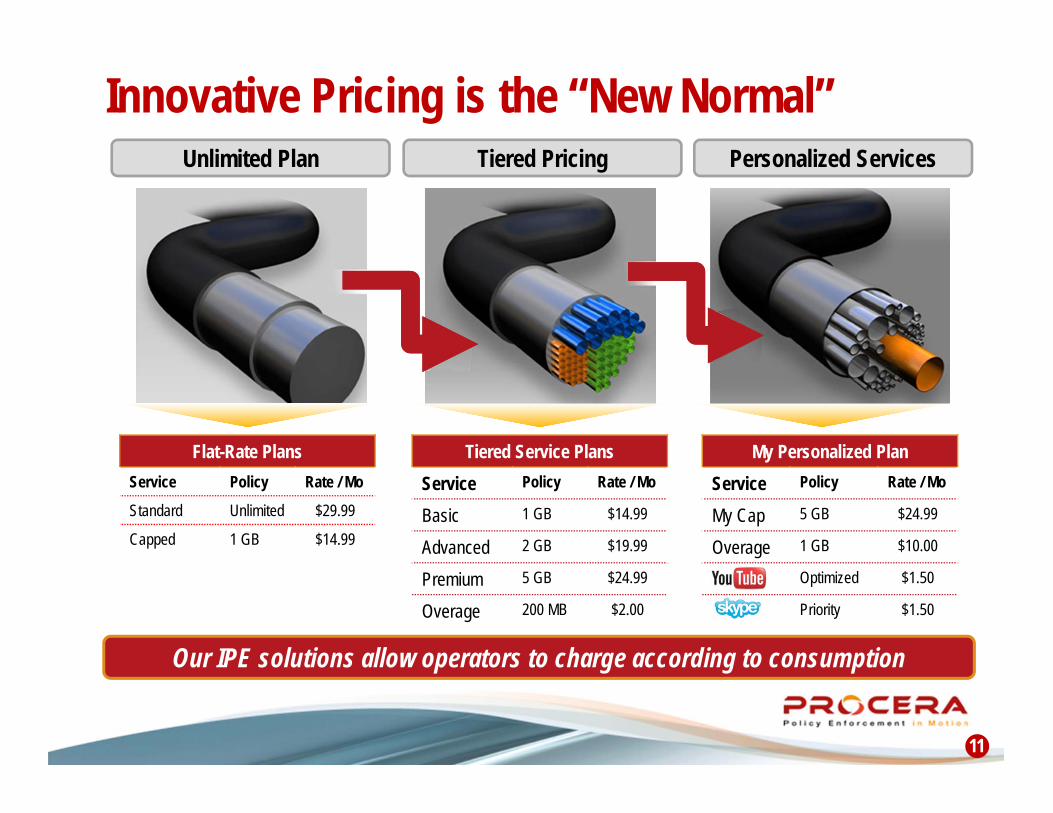
Our IPE solutions allow operators to charge according to consumption
Innovative Pricing is the “New Normal”
11
Unlimited Plan Tiered Pricing Personalized Services
Flat-Rate Plans Service Policy Rate / Mo
Standard Unlimited $29.99
Capped 1 GB $14.99
Tiered Service Plans Service Policy Rate / Mo
Basic 1 GB $14.99
Advanced 2 GB $19.99
Premium 5 GB $24.99
Overage 200 MB $2.00
My Personalized Plan Service Policy Rate / Mo
My Cap 5 GB $24.99
Overage 1 GB $10.00
Optimized $1.50
Priority $1.50
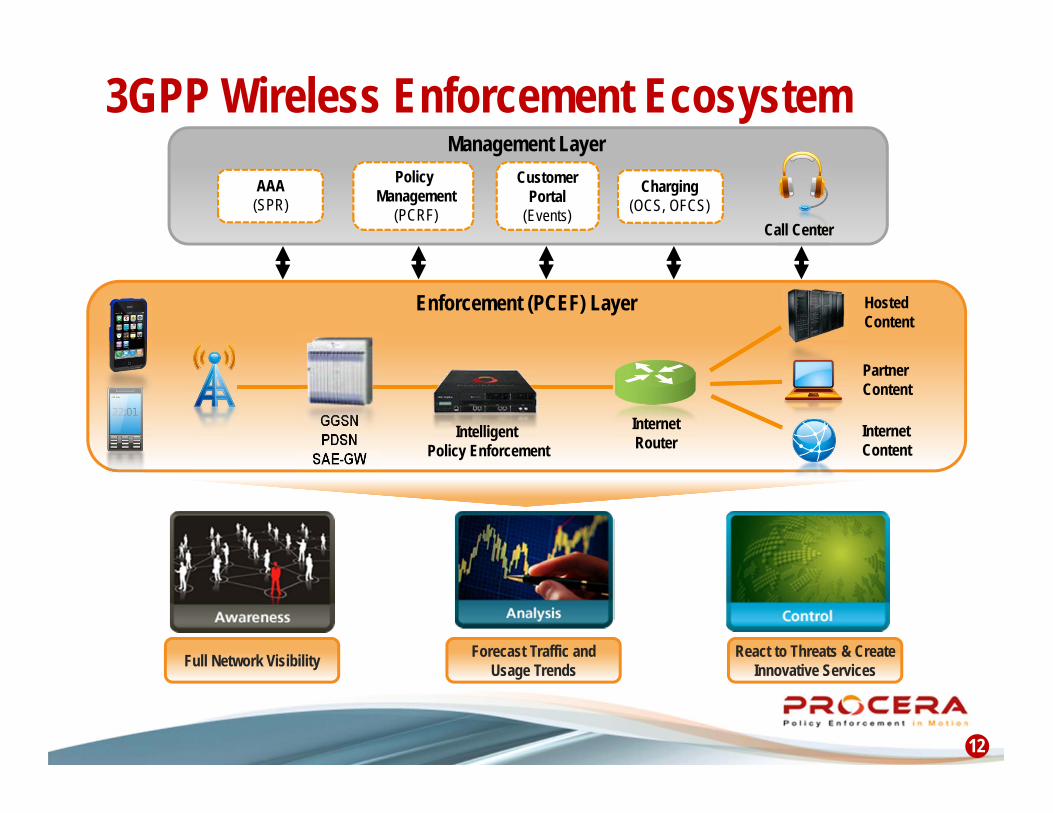
3GPP Wireless Enforcement Ecosystem
Hosted Content
Partner Content
Internet Content
Intelligent Policy Enforcement
Charging (OCS, OFCS)
Customer Portal
(Events)
Policy Management
(PCRF)
Enforcement (PCEF) Layer
Management Layer
GGSN PDSN
SAE-GW
Internet Router
Call Center
AAA (SPR)
Full Network Visibility Forecast Traffic and Usage Trends
React to Threats & Create Innovative Services
12

PSM PIC PRE PacketLogic
Subscriber Manager PacketLogic
Realtime Enforcement PacketLogic
Intelligence Center
Tight integration with BSS / OSS to deliver network, subscriber, service, and location awareness
Policy Management framework for standards compliance
Real-time and historical visibility into applications, locations, devices, and subscribers
Automated report generation and feeds for customer portals
Real-Time Policy Enforcement point to enforce business logic
Network Intelligence collection for PIC on thousands of user, location / device / application parameters
The Procera Solution Families Delivering Intelligent Policy Enforcement
13
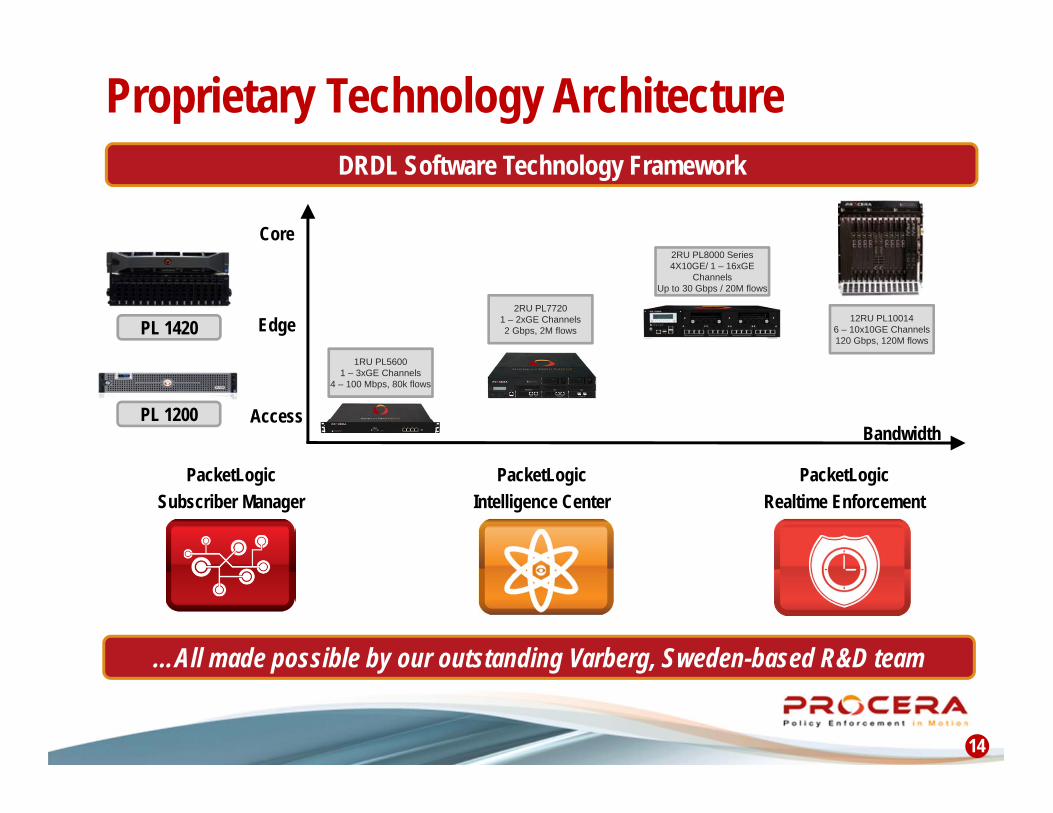
Proprietary Technology Architecture
Core
Edge
Access Bandwidth
1RU PL5600 1 – 3xGE Channels
4 – 100 Mbps, 80k flows
2RU PL7720 1 – 2xGE Channels 2 Gbps, 2M flows
2RU PL8000 Series 4X10GE/ 1 – 16xGE
Channels Up to 30 Gbps / 20M flows
12RU PL10014 6 – 10x10GE Channels 120 Gbps, 120M flows
…All made possible by our outstanding Varberg, Sweden-based R&D team
DRDL Software Technology Framework
PL 1420
PL 1200
14
PacketLogic Subscriber Manager
PacketLogic Realtime Enforcement
PacketLogic Intelligence Center

Higher Education
Cable MSOs
Procera Target Market
Direct Sales – 75%(1)
Mobile / Wireless
Go-to-Market Strategy
15
Indirect Sales – 25%(1)
OEMs Partners VARs Global SIs North America: 12
EMEA: 10 APAC: 16
Planned
(1) Estimated percentage of revenues attributable to direct and indirect sales.
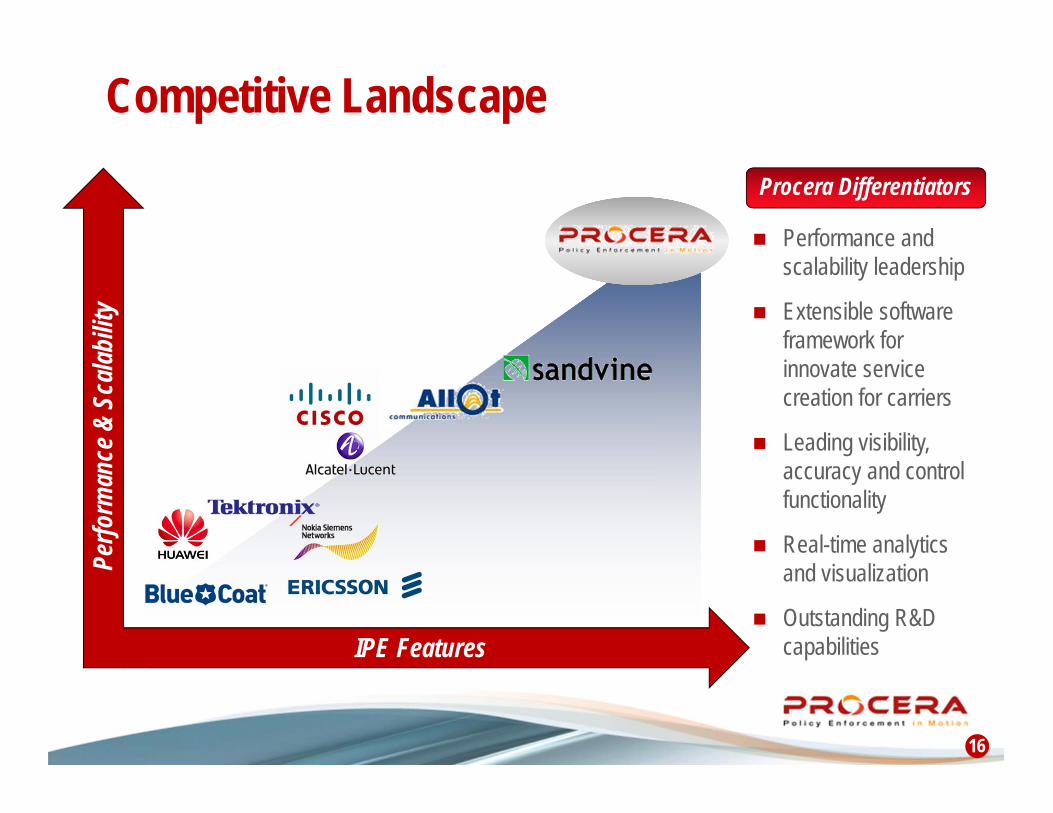
Competitive Landscape
IPE Features
Perfo
rman
ce &
Sca
labilit
y
Performance and scalability leadership
Extensible software framework for innovate service creation for carriers
Leading visibility, accuracy and control functionality
Real-time analytics and visualization
Outstanding R&D capabilities
Procera Differentiators
16
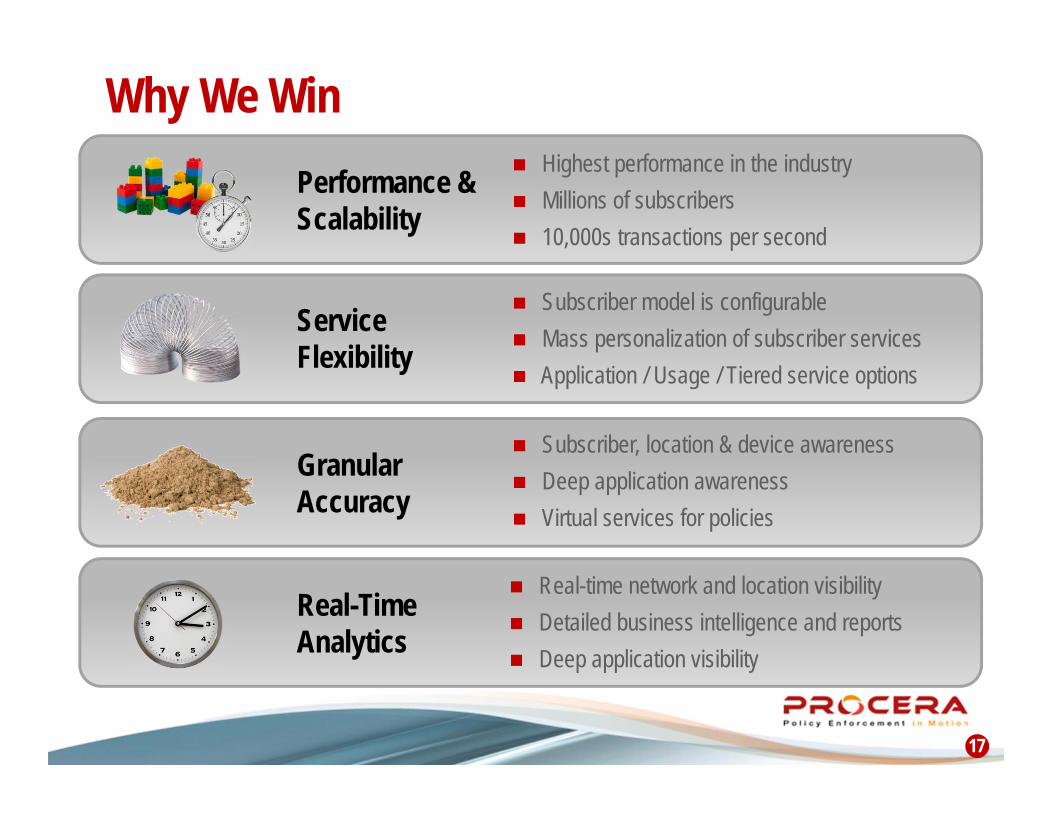
Why We Win
Service Flexibility
Granular Accuracy
Performance & Scalability
Real-Time Analytics
Subscriber model is configurable Mass personalization of subscriber services Application / Usage / Tiered service options
Subscriber, location & device awareness Deep application awareness Virtual services for policies
Highest performance in the industry Millions of subscribers 10,000s transactions per second
Real-time network and location visibility Detailed business intelligence and reports Deep application visibility
17

Growth Strategy
Increase our Tier-1 SP customer count
Continue to harvest our current customer opportunity
Pursue new technology partnerships to drive additional revenue
Extend our technology advantage
Leverage scale to drive margin improvement
18

James Brear President & CEO
Charles Constanti VP & CFO
Alexander Haväng CTO
Jon Lindén VP, Global Marketing
David Ahee VP, Sales – Americas
Michael Marken VP, Global Operations
Paul Gracie VP, Sales – EMEA
Ben Tah VP, Sales – APAC
Experienced Leadership
Swedish Military
IDA Systems
TheSchoolbook.com Swedish Trade Council
Name Position Prior Experience
19
Name Title Prior Experience

Financials

Solid Q2:11 Results
21
Revenue of $9.7 million, up 102% from Q2:10
Bookings of $9.7 million, up 45% from Q2:10
Added 20 new service provider customers
Won a record 57 new higher education product orders
15 direct Tier-1 trials ongoing or planned over the next 90 days
Gross margin improved to 62%, up from 61% in Q1:11 and 57% in Q2:10
Non-GAAP net income of $595,000, compared to a loss of $486,000 in Q2:10
Cash flow from operations was over $2 million
Completed successful public offering of common stock for net $26.5 million
Cash was $36.8 million at June 30, 2011
21

Attractive Long-Term Financial Model(1)
Gross Margin 46% 57% 62% 65% – 70%
Research & Development 13% 16% 13% 12%
Sales & Marketing 28% 32% 33% 30%
General & Administrative 18% 15% 14% 6%
Total Operating Expenses 59% 64% 59% 48%
Operating Income (13%) (7%) 3% 17% – 22%
Q2:11 6/30/11 Long‐Term 2010 2009
22
(1) Excluding stock-based compensation.
Investment Highlights
Leading Provider in the Large, High-Growth IPE Market
Leveraged to the Growth in Mobile and IP Data Consumption
Software-based Solution Leveraging Industry-Standard Hardware
Global Tier-1 Customer Footprint Across Mobile and Broadband
Accelerating Revenue Growth and Expanding Margins
Outstanding R&D Capabilities; Proven Leadership Team
23

Procera Networks August 2011
Thank You