Investor Perspective CDMA450 in Asia - cdg.org · Telkomsel EBITDA Margin Indonesia Penetration...
25
Investor Perspective Sundeep Bihani 852 2869 3393 Nov, 2004 CDMA450 in Asia
Transcript of Investor Perspective CDMA450 in Asia - cdg.org · Telkomsel EBITDA Margin Indonesia Penetration...

Investor Perspective
Sundeep Bihani852 2869 3393
Nov, 2004
CDMA450 in Asia
Table of Contents
uLehman Brothers Asian Telecom Coverage
uBetter Understanding Mobile Growth
uBetter Understanding Mobile Profitability
uHow CDMA450 Solves Growth Versus Profitability Dilemma
1

Lehman Brothers’ Asian Telecom CoverageSTOCKS COVERED
Ope
rato
rE
qpt
Inte
rnet
AsiaSat BhartiChina Mobile HK China Telecom HKChina Unicom HKChunghwa TelecomHutchisonIndosat Korea TelecomKT freetelLG TelecomM1PCCWPT TelkomS K TelecomSing TelSmartoneTelstra
AcctonD-linkTCL InternationalUTStarcomZyxelBYD*BDTel*ZTE*
NeteaseSinaSohu*Recent Coverage
2
Why the Eco-System?
uHistorically, investors examined telco services, telco equipmentquite discretely
uIn attempting to better interpolate data points such as growth capabilities of a network, profit potential, network limitations, investors are increasingly covering equipment to understand services, and vice-versa…
– Example – Chinese subscriber growth in 2003 was largely underestimated, as services investors failed to track the impact of falling handset prices
3

Better Understanding Mobile Growth
uGrowth
– 2003 Net Add Forecasts in Jan, 2003, Versus Actuals
– Likely Reasons for Variation
– Lehman’s Work to Better Predict Growth
4
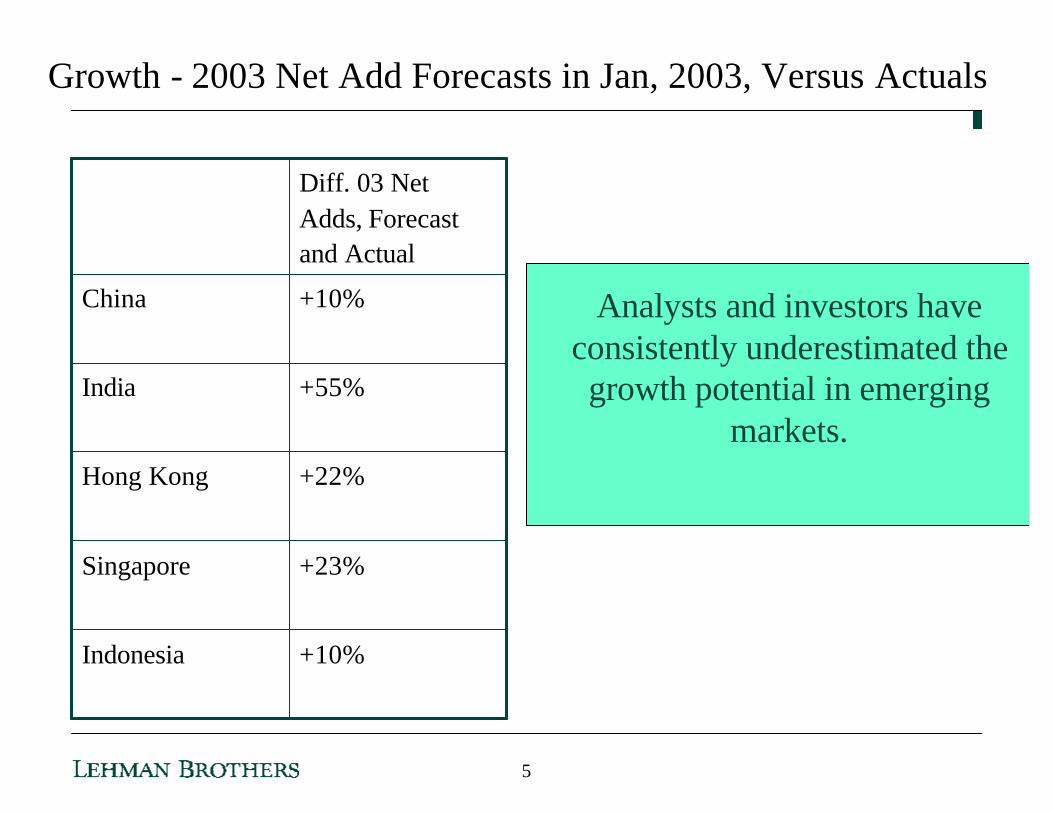
Growth - 2003 Net Add Forecasts in Jan, 2003, Versus Actuals
+10%Indonesia
+23%Singapore
+22%Hong Kong
+55%India
+10%China
Diff. 03 Net Adds, Forecast and Actual
Analysts and investors have consistently underestimated the growth potential in emerging
markets.
5
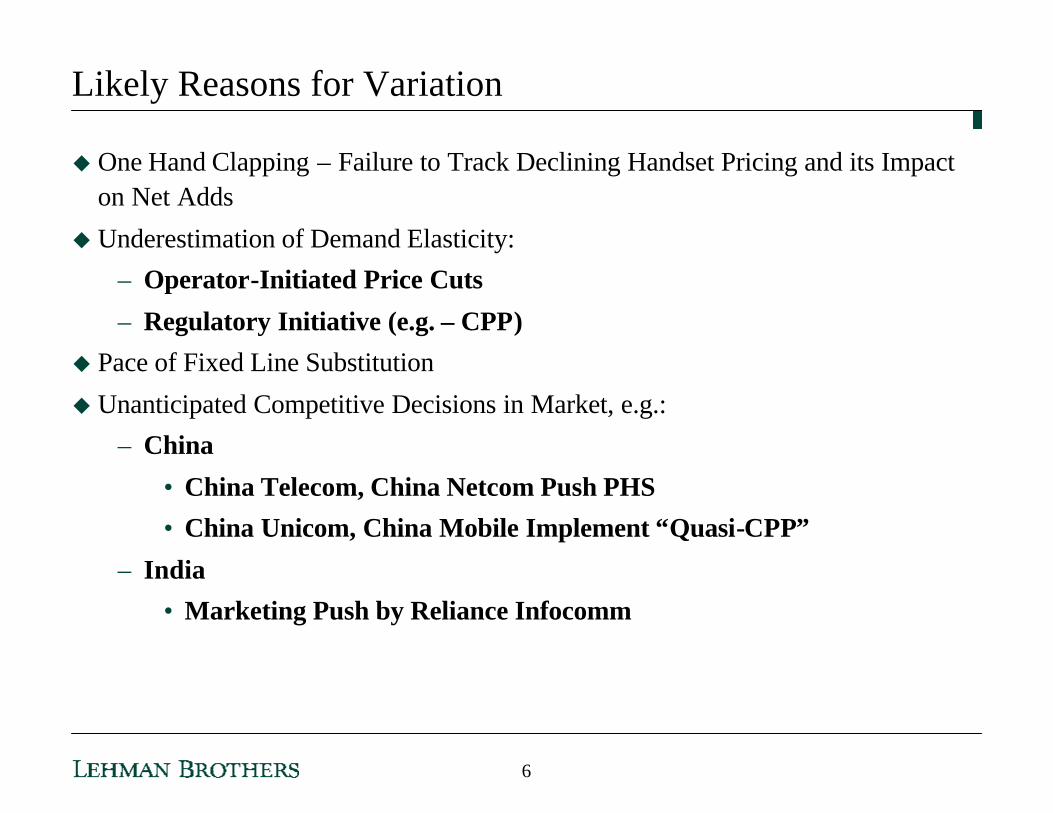
Likely Reasons for Variation
u One Hand Clapping – Failure to Track Declining Handset Pricing and its Impact on Net Adds
u Underestimation of Demand Elasticity:– Operator-Initiated Price Cuts
– Regulatory Initiative (e.g. – CPP)u Pace of Fixed Line Substitution
u Unanticipated Competitive Decisions in Market, e.g.:– China
• China Telecom, China Netcom Push PHS• China Unicom, China Mobile Implement “Quasi-CPP”
– India• Marketing Push by Reliance Infocomm
6
-
2,000
4,000
6,000
8,000
Cambo
dia
Vietna
m India
Indon
esia
Philip
pines Chin
a
Thaila
nd
Per
Cap
ita
GD
P (
US
$ P
PP
)
0.0%
10.0%
20.0%
30.0%
40.0%
Penetration
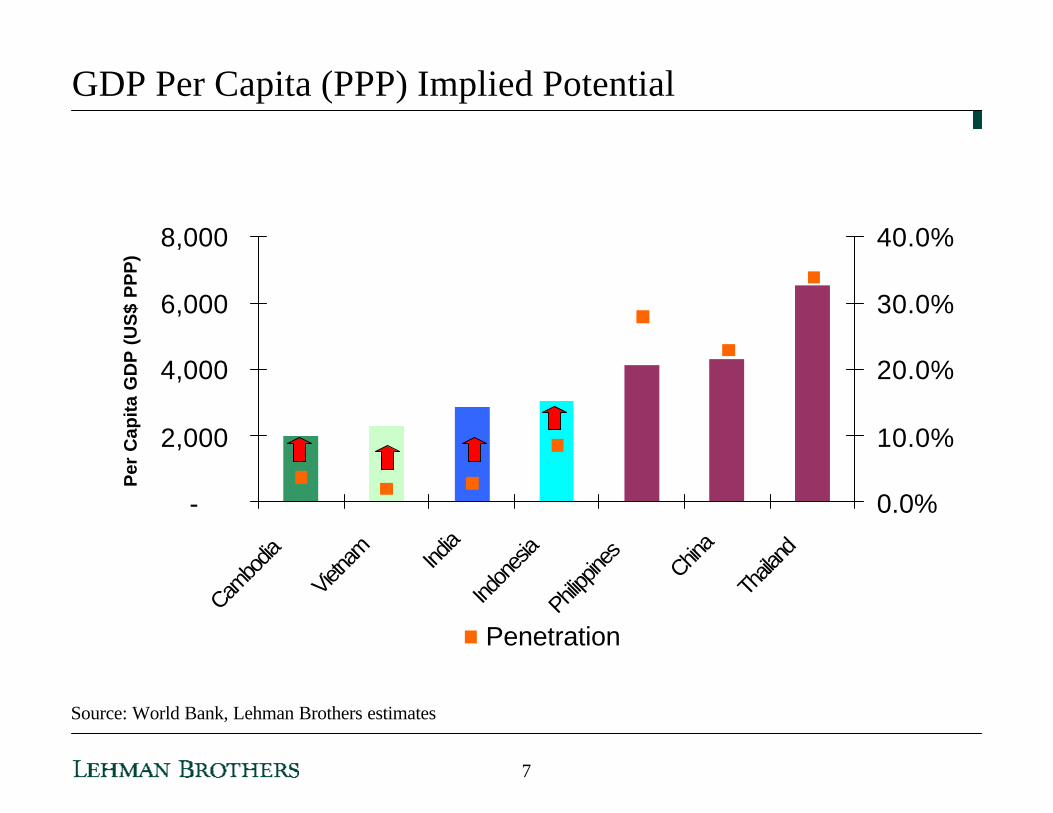
GDP Per Capita (PPP) Implied Potential
Source: World Bank, Lehman Brothers estimates
7

How Fast Can Mobile Subscribers Grow?
Ø Mobile Penetration added in every quarter is a good way to measure speed of a market’s growth
Source: Company data, Lehman Brothers estimates
0.0%
0.5%
1.0%
1.5%
2.0%
1Q02 2Q02 3Q02 4Q02 1Q03 2Q03 3Q03 4Q03
China(incl PAS) India Indonesia (incl Flexi)
8
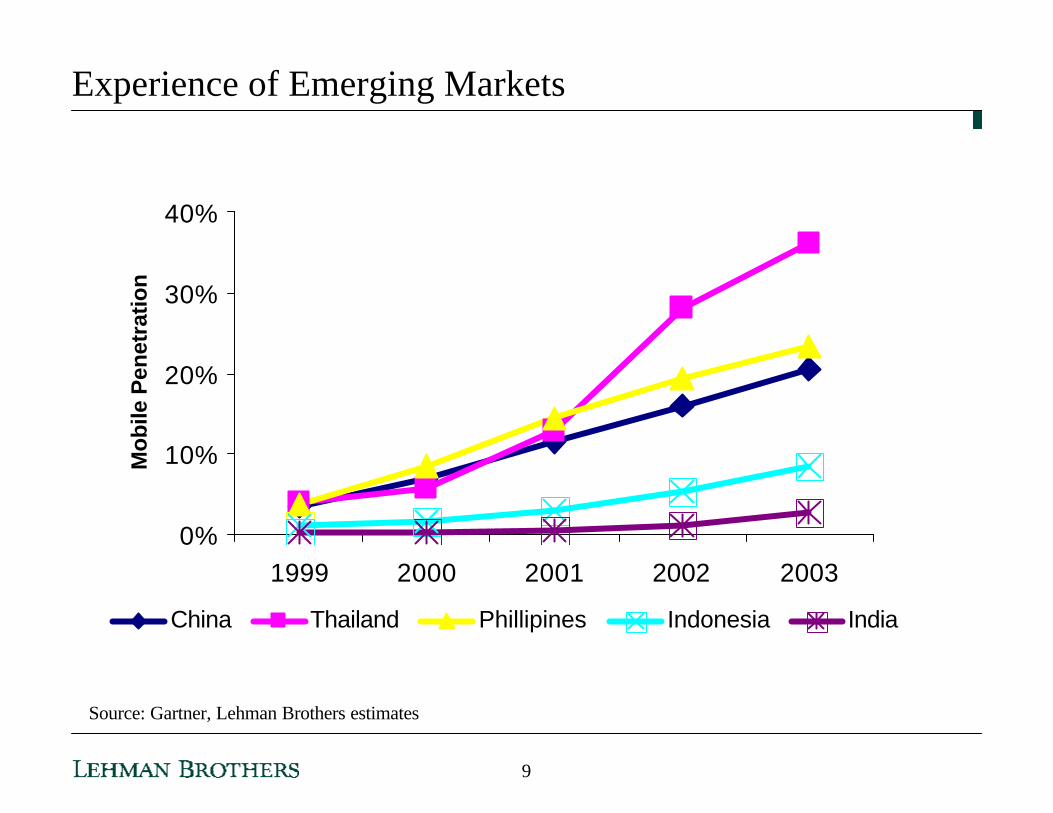
Experience of Emerging Markets
Source: Gartner, Lehman Brothers estimates
0%
10%
20%
30%
40%
1999 2000 2001 2002 2003
Mob
ile P
enet
ratio
n
China Thailand Phillipines Indonesia India
9
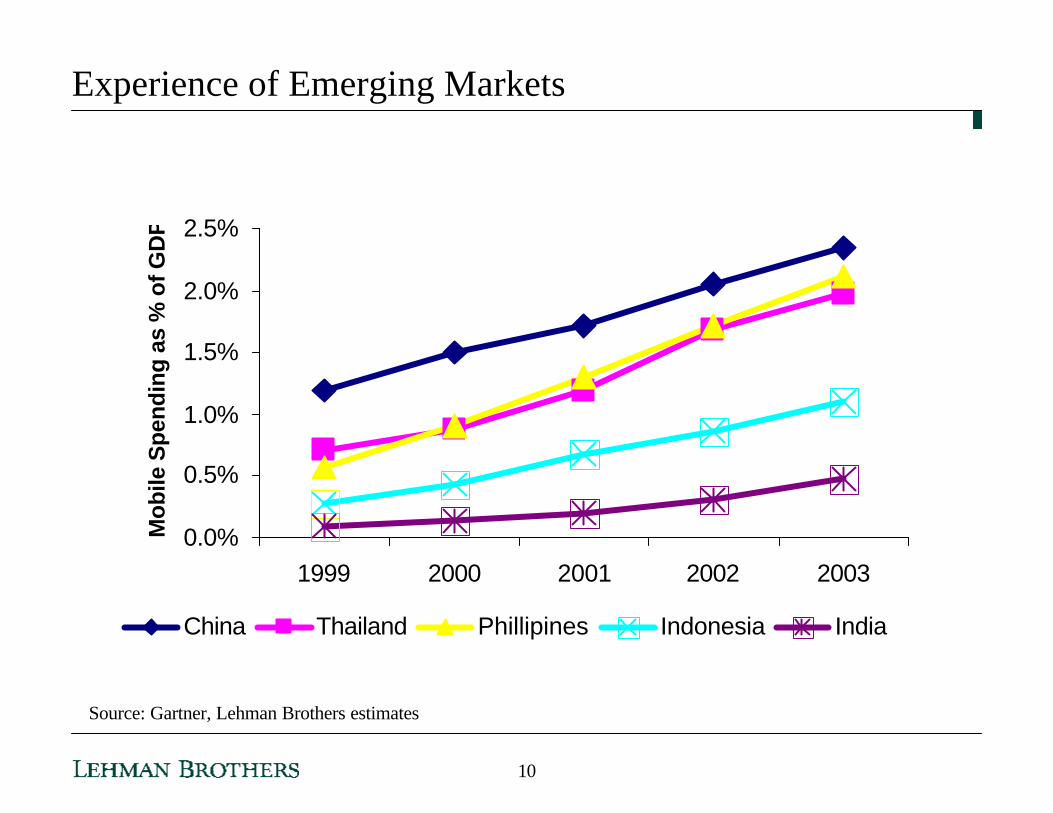
Experience of Emerging Markets
Source: Gartner, Lehman Brothers estimates
0.0%
0.5%
1.0%
1.5%
2.0%
2.5%
1999 2000 2001 2002 2003
Mob
ile S
pend
ing
as %
of G
DP
China Thailand Phillipines Indonesia India
10

India & Indonesia lag China, Thailand & Philippines
Source: Gartner, Lehman Brothers estimates
ØT defined as the time when mobile penetration is 3%-5%
0.0%
5.0%
10.0%
15.0%
20.0%
25.0%
30.0%
T T+1 T+2 T+3 T+40.0%
0.5%
1.0%
1.5%
2.0%
2.5%
Avg - Penetration (LHS) Avg- % of GDP Spent in Mobile Services (RHS)
Indonesia is here currently
India is here currently
11
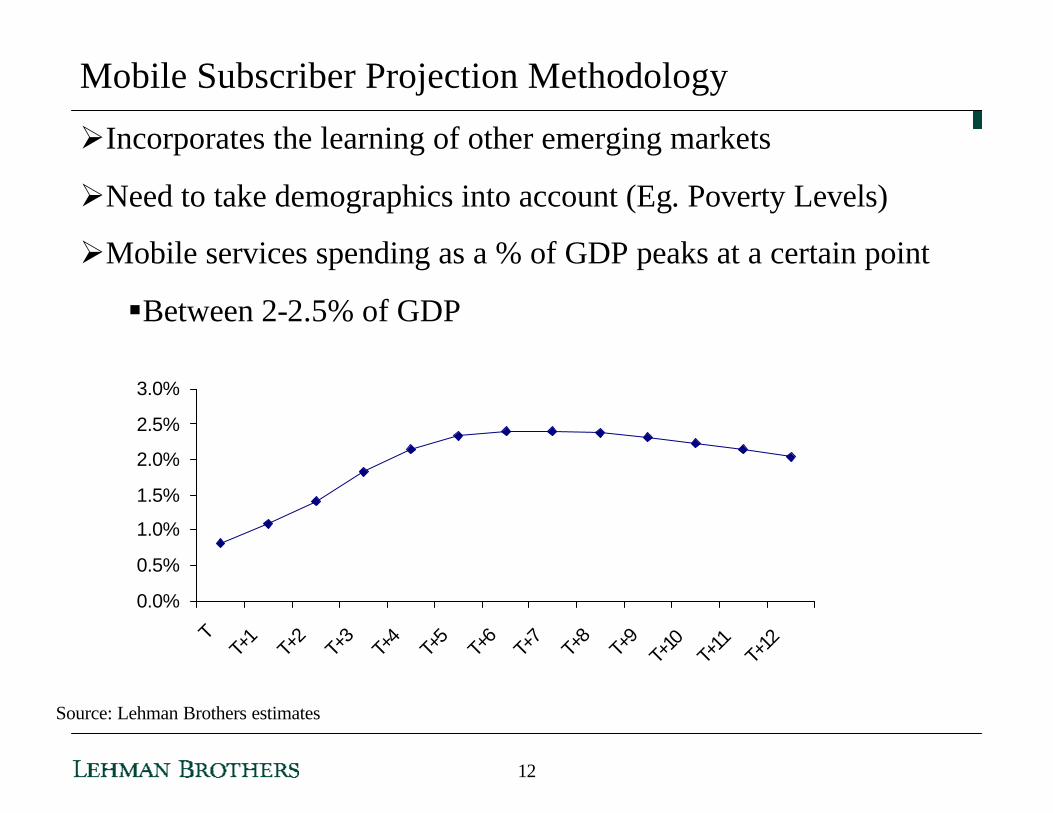
Mobile Subscriber Projection Methodology
Source: Lehman Brothers estimates
ØIncorporates the learning of other emerging markets
ØNeed to take demographics into account (Eg. Poverty Levels)
ØMobile services spending as a % of GDP peaks at a certain point
§Between 2-2.5% of GDP
0.0%
0.5%
1.0%
1.5%
2.0%
2.5%
3.0%
TT+
1T+
2T+
3T+
4T+
5T+
6T+
7T+
8T+
9T+
10T+
11T+
12
12

Better Understanding Mobile Profitability
EBITDA MarginMobile 2003E 2003A DifferenceChina Mobile 57.5% 56.6% -0.9%China Unicom 39.2% 36.8% -2.4%Indosat 52.1% 53.1% 1.0%KT Freetel 31.8% 38.8% 7.0%SK Telecom 46.2% 48.0% 1.8%LG Telecom 31.3% 32.2% 0.9%Smartone 22.2% 23.2% 1.0%Mobile One 38.2% 40.2% 2.0%Bharti 31.5% 33.5% 2.0%Peoples 28.9% 29.9% 1.0%
13
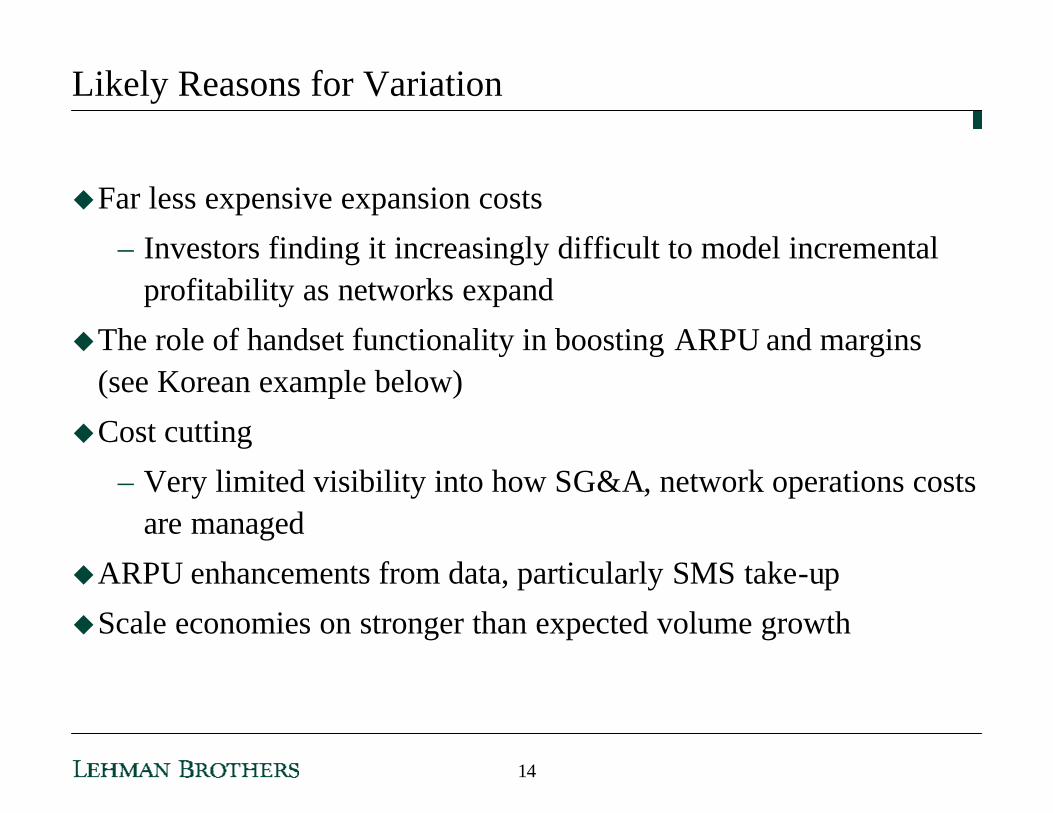
Likely Reasons for Variation
uFar less expensive expansion costs
– Investors finding it increasingly difficult to model incrementalprofitability as networks expand
uThe role of handset functionality in boosting ARPU and margins (see Korean example below)
uCost cutting
– Very limited visibility into how SG&A, network operations costs are managed
uARPU enhancements from data, particularly SMS take-up
uScale economies on stronger than expected volume growth
14

Falling ARPU Finally Brings Down EBTIDA Margins
90
95
100
105
110
115
120
125
2Q02A 3Q02A 4Q02A 1Q03A 2Q03A 3Q03A 4Q03A0.0%
10.0%
20.0%
30.0%
40.0%
50.0%
60.0%
70.0%
Quarterly GSM ARPU EBITDA Margin
RMB
China Mobile Experience
Source: China Mobile
15
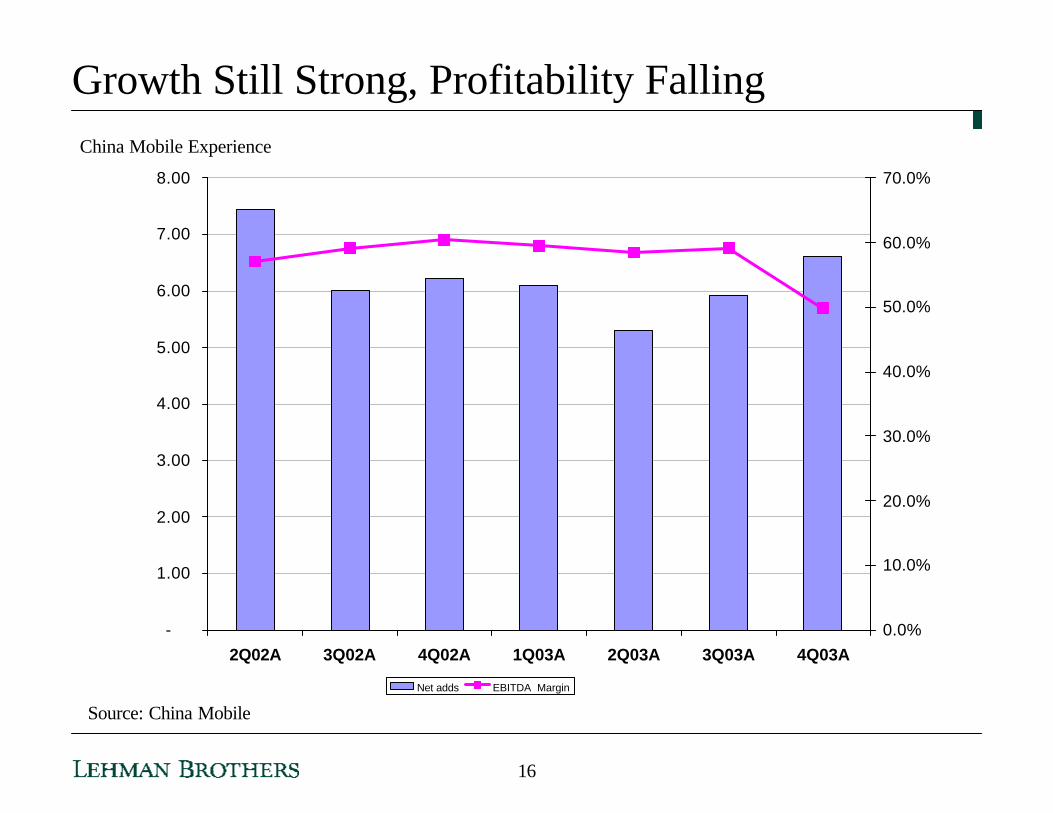
Growth Still Strong, Profitability Falling
-
1.00
2.00
3.00
4.00
5.00
6.00
7.00
8.00
2Q02A 3Q02A 4Q02A 1Q03A 2Q03A 3Q03A 4Q03A0.0%
10.0%
20.0%
30.0%
40.0%
50.0%
60.0%
70.0%
Net adds EBITDA Margin
Source: China Mobile
China Mobile Experience
16

Cities Have High Penetration – Rural Areas Next?
Source: Lehman Brothers research
GDP Per Capita (In RMB)As at 2003
Shanghai 160.1 73.3 45.8% 109.6 68.4% 43,898 Beijing 137.2 68.4 49.8% 110.3 80.3% 30,725 Tianjin 99.6 36.0 36.2% 38.1 38.2% 24,170 Zhejiang 457.7 165.7 36.2% 195.1 42.6% 18,185 Guangdong 772.2 256.7 33.2% 400.7 51.9% 16,232 Jiangsu 729.7 204.3 28.0% 191.8 26.3% 15,542 Fujian 341.3 112.3 32.9% 94.2 27.6% 14,577 Liaoning 416.1 127.9 30.7% 107.8 25.9% 14,025 Shandong 897.0 209.1 23.3% 150.6 16.8% 12,577 Heilongjiang 378.1 87.6 23.2% 84.9 22.4% 10,999 Hebei 664.6 134.1 20.2% 125.1 18.8% 9,844 Xinjiang 190.5 41.2 21.6% 41.7 21.9% 9,053 Jilin 266.9 59.6 22.3% 62.9 23.6% 9,001 Hubei 598.8 88.9 14.8% 86.8 14.5% 8,985 Hainan 80.3 16.3 20.3% 13.6 16.9% 8,427 Inner Mongolia 235.9 43.0 18.2% 47.2 20.0% 7,820 Hunan 662.9 98.4 14.8% 84.0 12.7% 7,090 Henan 947.9 136.1 14.4% 107.1 11.3% 6,951 Qinghai 52.9 7.6 14.4% 9.9 18.6% 6,940 Chongqing 307.2 53.3 17.4% 61.3 20.0% 6,855 Shanxi 324.6 67.6 20.8% 59.4 18.3% 6,638 Tibet 26.7 2.7 10.3% 3.2 12.0% 6,580 Jiangxi 415.2 63.0 15.2% 53.2 12.8% 6,295 Anhui 627.8 99.9 15.9% 69.7 11.1% 6,282 Ningxia 57.2 10.0 17.5% 12.1 21.2% 6,268 Sichuan 857.0 112.8 13.2% 119.0 13.9% 6,227 Shaanxi 367.4 67.2 18.3% 61.7 16.8% 5,965 Yunnan 433.3 48.2 11.1% 62.0 14.3% 5,593 Guangxi 475.0 63.9 13.4% 63.9 13.5% 5,507 Gansu 259.3 40.2 15.5% 27.4 10.6% 4,852 Guizhou 383.7 33.3 8.7% 33.0 8.6% 3,405 Average 407.2 84.8 21.9% 86.7 23.6% 11,145
Wireline Penetration Rate
Wireless Penetration Rate
Wireless Sub (In Mil)Provinces
Wireline Sub (In Mil)
Total Pop (In Mil)uWealthy markets (e.g
Beijing, Shanghai, Guangdong) have penetration of 50- 80%
u Rural provinces’penetration remains low e.g - Guizhou, Tibet, Henan
17

What Does This Mean About Future Growth in China and Other Developing Markets?
18

GDP in US$ PPP
-
2,000
4,000
6,000
8,000
Cambo
dia
Vietna
m India
Indon
esia
Philipp
ines
China
Thaila
nd
Per
Cap
ita
GD
P (
US
$ P
PP
)
Cambodia VietnamIndia Indonesia
Low Cost Solution Necessary For Profitability Growth
Source: World Bank, Lehman Brothers estimates
19

CDMA450 Bodes Well for Developing Areas
Source: Asia Development Bank, Lehman Brothers research
GDP Per Capita (US$) 1990 1995 1998 1999 2000 2001 2002 2003Developing AreasChina 197 585 760 789 853 909 960 1,037 India 146 292 405 443 472 506 547 590 Indonesia 136 270 549 625 710 805 884 937 Vietnam 42 212 319 348 379 408 448 471 Developed AreasTaiwan 3,909 6,455 9,970 12,424 12,818 13,242 12,939 13,182 Singapore 8,428 13,004 19,990 20,707 20,682 23,253 21,806 22,157 Hong Kong 6,412 13,206 22,831 25,075 24,182 24,782 24,383 24,011
•Where do the next 100m users reside? What is their wealth profile?
20

CDMA450 Bodes Well for Developing Areas
Source: Asia Development Bank, Lehman Brothers research
Proverty (% of Population below $1 a day)
Rural Population (% of Total Population)
China 16.10% 62.40%India 34.70% 71.90%Indonesia 7.20% 57.00%Vietnam 17.70% 75.10%Cambodia n.a 82.00%Pakistan 13.40% 66.20%
•Where do the next 100m users reside? What is their wealth profile?
21

Lower Cost Options Such as CDMA450 Promising...
…and Necessary !
The investor view:
22

The Promise of Growth Plus Profitability
58%
60%
62%
64%
66%
68%
70%
72%
74%
76%
78%
80%
1Q02A 2Q02A 3Q02A 4Q02A 1Q03A 2Q03A 3Q03A 4Q03A0.0%
1.0%
2.0%
3.0%
4.0%
5.0%
6.0%
7.0%
8.0%
9.0%
Telkomsel EBITDA Margin Indonesia Penetration
Source:Lehman Brothers research
23

DisclaimerKey to Investment Opinions: Stock Rating1 - Overweight - The stock is expected to outperform the unweighted expected total return of the relevant country index over a 12-month investment horizon. 2 - Equal weight - The stock is
expected to perform in line with the unweighted expected total return of the relevant country index over a 12-month investment horizon. 3 - Underweight - The stock is expected to underperform the unweighted expected total return of the relevant country index over a 12-month investment horizon. RS - Rating Suspended - The rating and target price have been suspended temporarily to comply with applicable regulations and/or firm policies in certain circumstances including when Lehman Brothers is acting in an advisory capacity in a merger or strategic transaction involving the company.
Sector View1 - Positive - sector fundamentals/valuations are improving.2 - Neutral - sector fundamentals/valuations are steady, neither improving nor deteriorating.3 - Negative - sector
fundamentals/valuations are deteriorating.Stock Ratings From February 2001 to August 5, 2002 (sector view did not exist):This is a guide to expected total return (price performance plus dividend) relative to the total return of the stock’s local market over the next 12 months.1=Strong Buy - expected to outperform the market by 15 or more percentage points. 2=Buy- expected to outperform the market by 5-15 percentage points.3=Market Perform - expected to perform in line with the market, plus or minus 5 percentage points. 4=Market Underperform - expected to underperform the market by 5-15 percentage points. 5=Sell - expected to underperform the market by 15 or more percentage points.
Stock Ratings Prior to February 2001 (sector view did not exist):1=Buy - expected to outperform the market by 15 or more percentage points.2=Outperform - expected to outperform the market by 5-15 percentage points.3=Neutral - expected to perform in line with the market, plus or minus 5 percentage points.4=Underperform - expected to underperform the market by 5-15 percentage points.5=Sell - expected to underperform the market by 15 or more percentage points.V=Venture - return over multiyear timeframe consistent with venture capital; should only be held in a well diversified portfolio.
Distribution of Ratings:Lehman Brothers Equity Research has 1543 companies under coverage.36% have been assigned a 1-Overweight rating which, for purposes of mandatory regulatory disclosures, is classified as a Buy rating, 38% of companies with this rating are investment
banking clients of the Firm.42% have been assigned a 2-Equal weight rating which, for purposes of mandatory regulatory disclosures, is classified as a Hold rating, 12% of companies with this rating are investment
banking clients of the Firm.22% have been assigned a 3-Underweight rating which, for purposes of mandatory regulatory disclosures, is classified as a Sell rating, 58% of companies with this rating are investment
banking clients of the Firm.This material has been prepared and/or issued by Lehman Brothers Inc., member SIPC, and/or one of its affiliates ("Lehman Brothers") and has been approved by Lehman Brothers
International (Europe), regulated by the Financial Services Authority, in connection with its distribution in the European Economic Area. This material is distributed in Japan by Lehman Brothers Japan Inc., and in Hong Kong by Lehman Brothers Asia Limited. This material is distributed in Australia by Lehman Brothers Australia Pty Limited, and in Singapore by Lehman Brothers Inc., Singapore Branch. This material is distributed in Korea by Lehman Brothers International (Europe) Seoul Branch. This document is for information purposes only and it should not be regarded as an offer to sell or as a solicitation of an offer to buy the securities or other instruments mentioned in it. No part of this document may be reproduced in any manner without the written permission of Lehman Brothers. We do not represent that this information, including any third party information, is accurate or complete and it should not be relied upon as such. It is provided with the understanding that Lehman Brothers is not acting in a fiduciary capacity. Op inions expressed herein reflect the opinion of Lehman Brothers and are subject to change without notice. The products mentioned in this document may not be eligible for sale in some states or countries, and they may not be suitable for all types of investors. If an investor has any doubts about product suitability, he should consult his Lehman Brothers representative. The value of and the income produced by products may fluctuate, so that an investor may get back less than he invested. Value and income may be adversely affected by exchange rates, interest rates, or other factors. Past performance is not necessarily indicative of future results. If a product is income producing, part of the capital invested may be used to pay that income. Lehman Brothers may, from time to time, perform investment banking or other services for, or solicit investment banking or other business from any company mentioned in this document. © 2003 Lehman Brothers. All rights reserved. Additional information is available on request. Please contact a Lehman Brothers’ entity in your home jurisdiction.
Complete disclosure information on companies covered by Lehman Brothers Equity Research is available at www.lehman.com/disclosures.