Investor News Markus Georgi - Fresenius
30
Investor News Page 1/30 Fresenius SE & Co. KGaA, Investor Relations & Sustainability, 61346 Bad Homburg February 23, 2021 Fresenius achieves 2020 targets and expects healthy business development in 2021 despite ongoing COVID-19 impact • Preliminary guidance for 2021 confirmed • Strategic roadmap for accelerated growth through 2023 and beyond • Group-wide initiatives to improve efficiency and profitability in preparation • Medium-term growth targets confirmed • 28 th consecutive dividend increase proposed If no timeframe is specified, information refers to Q4/2020 2020 and 2019 according to IFRS 16 Q4/20 Growth Growth in constant currency Sales €9.3 billion 0% 5% EBIT 1 €1,251 million -3% 2% Net income 1,2 €494 million -2% 2% FY/20 Growth Growth in constant currency Sales €36.3 billion 2% 5% EBIT 1 €4,612 million -2% 0% Net income 1,2 €1,796 million -4% -3% 1 Before special items 2 Net income attributable to shareholders of Fresenius SE & Co. KGaA For a detailed overview of special items please see the reconciliation tables on pages 20-22. Markus Georgi Senior Vice President Investor Relations & Sustainability Fresenius SE & Co. KGaA Else-Kröner-Straße 1 61352 Bad Homburg Germany T +49 6172 608-2485 F +49 6172 608-2488 [email protected] www.fresenius.com
Transcript of Investor News Markus Georgi - Fresenius

Investor News
Page 1/30 Fresenius SE & Co. KGaA, Investor Relations & Sustainability, 61346 Bad Homburg
February 23, 2021
Fresenius achieves 2020 targets and expects healthy business development in 2021 despite ongoing COVID-19 impact
• Preliminary guidance for 2021 confirmed
• Strategic roadmap for accelerated growth through 2023 and beyond
• Group-wide initiatives to improve efficiency and profitability in preparation
• Medium-term growth targets confirmed
• 28th consecutive dividend increase proposed
If no timeframe is specified, information refers to Q4/2020 2020 and 2019 according to IFRS 16
Q4/20 Growth
Growth
in constant currency
Sales €9.3 billion 0% 5%
EBIT1
€1,251 million -3% 2%
Net income1,2 €494 million -2% 2%
FY/20 Growth Growth
in constant currency
Sales €36.3 billion 2% 5%
EBIT1
€4,612 million -2% 0%
Net income1,2 €1,796 million -4% -3%
1 Before special items 2 Net income attributable to shareholders of Fresenius SE & Co. KGaA For a detailed overview of special items please see the reconciliation tables on pages 20-22.
Markus Georgi Senior Vice President Investor Relations & Sustainability Fresenius SE & Co. KGaA Else-Kröner-Straße 1 61352 Bad Homburg Germany T +49 6172 608-2485 F +49 6172 608-2488 [email protected] www.fresenius.com
Page 2/30 Fresenius SE & Co. KGaA, Investor Relations & Sustainability, 61346 Bad Homburg
Stephan Sturm, CEO of Fresenius, said:” The pandemic year 2020 showed emphatically the
importance of forward-thinking, effective and efficient healthcare. Fresenius is making a vital
contribution here, in many different areas of medicine. This year, the pandemic will again
present us with a number of challenges, making it even more important that we increase
efficiency in order to improve our cost base. Beyond our established businesses, we will also
expand in important growth areas including biosimilars, digital healthcare, home dialysis and
fertility medicine. By doing so, we are laying the foundations for more dynamic growth in the
coming years. Even though the pandemic and its consequences are keeping us busy right
now, we are already looking ahead and setting the course for the medicine of the future. In
this way, we are also securing our company’s sustainable economic success.”
FY/21 Group guidance
For FY/21, Fresenius projects sales growth1 in a low to mid-single-digit percentage range and
at least broadly stable net income2,3 year-over-year, both in constant currency. Implicitly,
net income2 for the Group excluding Fresenius Medical Care is expected to grow in a mid-to
high single digit percentage range in constant currency.
Fresenius projects net debt/EBITDA4 to be around the top-end of the self-imposed target
corridor of 3.0x to 3.5x by the end of FY/21.
COVID-19 assumptions for guidance FY/21
COVID-19 will continue to impact Fresenius’ operations in 2021. Current burdens and
constraints caused by COVID-19 are expected to recede only in H2/21. The expected
improvement in the Group’s relevant business environment from H2/21 is heavily dependent
on continuously increasing levels of vaccination coverage in Fresenius’ relevant markets.
These assumptions are subject to considerable uncertainty.
Fresenius closely monitors the development of COVID-19 case numbers, and the associated
various containment measures being enacted in many of the Company’s relevant markets. A
possible significant deterioration of the situation associated with further containment
measures that could have a significant and direct impact on the health care sector without
any appropriate compensation is not reflected in the Group’s FY/21 guidance.
1 FY/20 base: €36,277 million 2 Net income attributable to shareholders of Fresenius SE & Co. KGaA 3 FY/20 base: €1,796 million; before special items; FY/21: before special items 4 At LTM average exchange rates for both net debt and EBITDA; pro forma closed acquisitions/divestitures;
excluding further potential acquisitions; before special items For a detailed overview of special items please see the reconciliation tables on pages 20-22.
Page 3/30 Fresenius SE & Co. KGaA, Investor Relations & Sustainability, 61346 Bad Homburg
Efficiency and cost saving programs
COVID-19 has led and will lead to a shortfall relative to our original expectations in FY/20
and FY/21 as well as to ongoing incremental uncertainty. Fresenius is hence planning to
launch group-wide strategic efficiency initiatives to further safeguard the confirmed medium-
term targets and sustainably enhance profitability. These initiatives are expected to consist
of operational excellence and cost-saving measures, targeted strengthening of future growth
areas and portfolio optimizations. The operational excellence and cost-saving measures are
targeted to result in cost savings of at least €100 million p.a. after tax and minority interest
in 2023 with some further potential to increase thereafter. We anticipate that achieving these
sustainable efficiencies will require significant up-front expenses. On average for the years
2021 to 2023, those expenses are expected to be in the order of magnitude of €100 million
p.a. after tax and minority interest. They will be classified as special items. Further
information will be provided during our Q1 earnings call on May 6, 2021.
Growth targets for 2020 – 2023 confirmed
Fresenius continues to expect Group sales to grow organically with a compounded annual
growth rate (CAGR) of 4% to 7% during 2020 to 2023. Group net income1,2 is projected to
increase organically with a CAGR of 5% to 9% during 2020 to 2023. Fresenius expects its
sales growth and efficiency improvement initiatives as well as Fresenius Kabi’s biosimilars
business to drive an acceleration of Group earnings growth over that period. Small and
medium-sized acquisitions are expected to contribute an incremental CAGR of approx. 1%-
point to both sales and net income growth.
28th consecutive dividend increase proposed
The Management Board of Fresenius will propose to the Supervisory Board a dividend
increase of 5% to €0.88 per share for FY/20 (FY/19: €0.84). Provided the proposal is
approved by the Supervisory Board and the Annual General Meeting, this will be the 28th
consecutive dividend increase.
1 Net income attributable to shareholders of Fresenius SE & Co. KGaA 2 Before special items For a detailed overview of special items please see the reconciliation tables on pages 20-22.

Page 4/30 Fresenius SE & Co. KGaA, Investor Relations & Sustainability, 61346 Bad Homburg
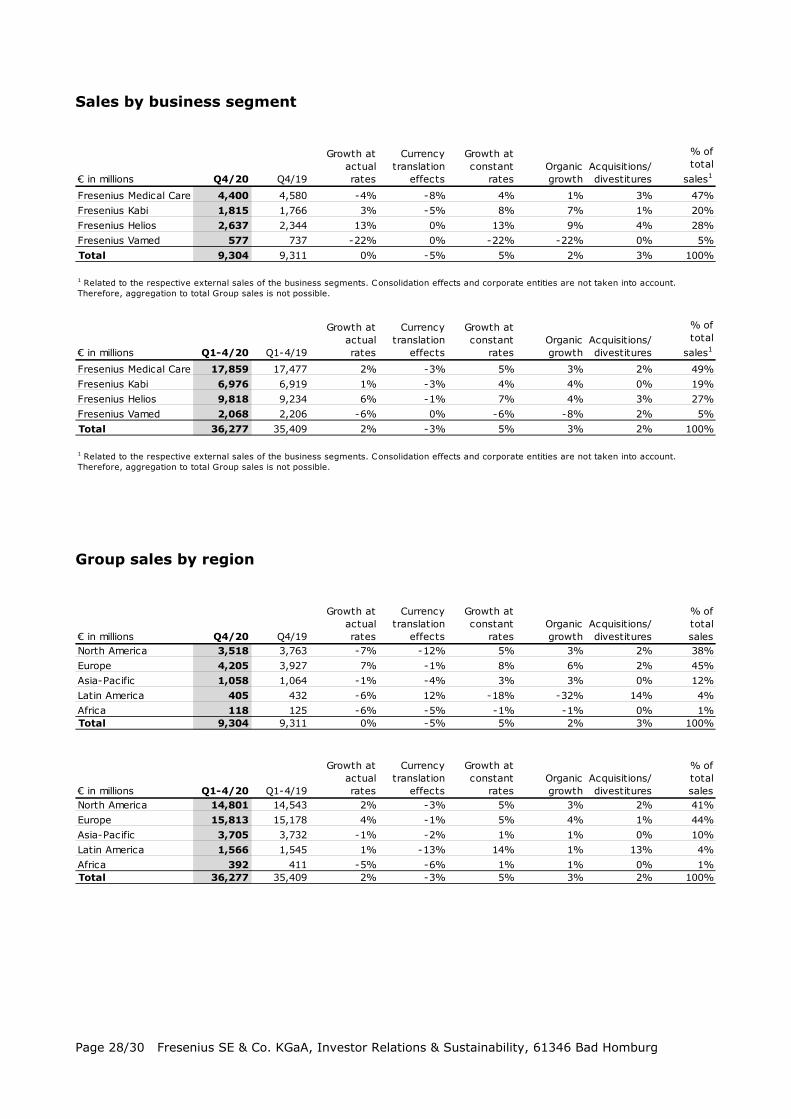
5% sales growth in constant currency
Group sales remained on prior year’s level (increased by 5% in constant currency) at
€9,304 million (Q4/19: €9,311 million). Organic growth was 2%. Acquisitions/ divestitures
contributed net 3% to growth. Currency translation reduced sales growth by 5%. Excluding
estimated COVID-19 effects1, Group sales growth would have been 7% to 8% in constant
currency.
In FY/20, Group sales increased by 2% (5% in constant currency) to €36,277 million
(FY/19: €35,409 million). Organic growth was 3%. Acquisitions/divestitures contributed net
2% to sales growth. Currency translation reduced sales growth by 3%. Excluding estimated
COVID-19 effects1, Group sales growth would have been 7% to 8% in constant currency.
2% net income2,3 growth in constant currency
Group EBITDA before special items decreased by 3% (increased by 3% in constant
currency) to €1,886 million (Q4/192: €1,937 million). Reported Group EBITDA was
€1,854 million (Q4/19: €1,937 million).
In FY/20, Group EBITDA before special items remained on prior year’s level (increased by
2% in constant currency) at €7,132 million (FY/192: €7,104 million). Reported Group EBITDA
was €7,100 million (FY/19: €7,083 million).
Group EBIT before special items decreased by 3% (increased by 2% in constant currency) to
€1,251 million (Q4/192: €1,287 million). The constant currency increase is due to the
positive development at Fresenius Medical Care and Fresenius Helios. Missing contributions
from elective procedures, volume headwinds leading to underutilized production capacities,
headwinds at Fresenius Kabi North America, COVID-19 related project delays at Fresenius
Vamed as well as Group-wide incremental COVID-19 related expenses weighed on EBIT. The
EBIT margin before special items was 13.4% (Q4/192: 13.8%). Reported Group EBIT was
€1,024 million (Q4/19: €1,269 million).
In FY/20, Group EBIT before special items decreased by 2% (0% in constant currency) to
€4,612 million (FY/192: €4,688 million). The EBIT margin before special items was 12.7%
(FY/192: 13.2%). Higher levels of investments in recent years triggered incremental
depreciation charges. Reported Group EBIT was €4,385 million (FY/19: €4,631 million).
Group net interest before special items improved to -€159 million (Q4/192: -€182 million)
mainly due to successful refinancing activities, lower interest rates as well as currency
translation effects. Reported Group net interest improved to -€156 million (Q4/19:
-€184 million).
1 For estimated COVID-19 effects in Q4/20 and FY/20 please see table on page 18. 2 Before special items 3 Net income attributable to shareholders of Fresenius SE & Co. KGaA For a detailed overview of special items please see the reconciliation tables on pages 20-22.

Page 5/30 Fresenius SE & Co. KGaA, Investor Relations & Sustainability, 61346 Bad Homburg
In FY/20, Group net interest before special items improved to -€654 million (FY/191:
- €714 million) while reported Group net interest improved to -€659 million
(FY/19: -€719 million).
The Group tax rate before special items was 24.1% (Q4/191: 23.8%) and the reported
Group tax rate was 29.4% (Q4/19: 23.0%). The increase is due to a not tax deductible €195
million impairment of goodwill and tradenames in the Latin America segment at Fresenius
Medical Care. In FY/20, the Group tax rate before special items was 23.1% (FY/191: 23.3%)
and the reported Group tax rate was 24.2% (FY/19: 22.6%).
Noncontrolling interests before special items were €335 million (Q4/191: €336 million) of
which 93% were attributable to the noncontrolling interests in Fresenius Medical Care.
Reported noncontrolling interests were €203 million (Q4/19 reported: €320 million).
In FY/20, noncontrolling interests before special items were €1,248 million (FY/191:
€1,170 million) of which 96% were attributable to the noncontrolling interests in Fresenius
Medical Care. Reported noncontrolling interests were €1,116 million (FY/19 reported: €1,146
million).
Group net income2 before special items decreased by 2% (increased by 2% in constant
currency) to €494 million (Q4/19: €506 million). Excluding estimated COVID-19 effects3,
Group net income2 before special items would have grown 3% to 7% in constant currency.
Reported Group net income2 decreased to €410 million (Q4/19: €515 million). The decrease
is mainly due to an impairment of goodwill and tradenames in the Latin America segment at
Fresenius Medical Care and the increased valuation of the biosimilars contingent purchase
price liabilities at Fresenius Kabi. In FY/20, Group net income2 before special items
decreased by 4% (-3% in constant currency) to €1,796 million (FY/191: €1,879 million).
Excluding estimated COVID-19 effects3, Group net income2 before special items would have
grown 2% to 6% in constant currency. Reported Group net income2 decreased to
€1,707 million (FY/19: €1,883 million).
Earnings per share2 before special items decreased by 2% (increased by 2% in constant
currency) to €0.88 (Q4/191: €0.90). Reported earnings per share2 were €0.73 (Q4/19:
€0.92). In FY/20, earnings per share2 before special items decreased by 4% (-3% in
constant currency) to €3.22 (FY/191: €3.37). Reported earnings per share2 were €3.06
(FY/191: €3.38).
1 Before special items 2 Net income attributable to shareholders of Fresenius SE & Co. KGaA 3 For estimated COVID-19 effects in Q4/20 and FY/20 please see table on page 18. For a detailed overview of special items please see the reconciliation tables on pages 20-22.

Page 6/30 Fresenius SE & Co. KGaA, Investor Relations & Sustainability, 61346 Bad Homburg
Continued investment in growth
Spending on property, plant and equipment was €856 million corresponding to 9% of
sales (Q4/19: €871 million; 9% of sales). These investments served primarily for the
modernization and expansion of dialysis clinics, production facilities as well as hospitals and
day clinics. Despite the COVID-19 pandemic, Fresenius has been largely able to continue its
investment programs.
In FY/20, spending on property, plant and equipment was €2,398 million corresponding to
7% of sales (FY/19: €2,463 million; 7% of sales).
Total acquisition spending was €251 million (Q4/19: €331 million).
In FY/20, total acquisition spending was €902 million, mainly for the purchase of hospitals by
Fresenius Helios in Germany and Colombia (FY/19: €2,623 million, mainly for the acquisition
of NxStage by Fresenius Medical Care).
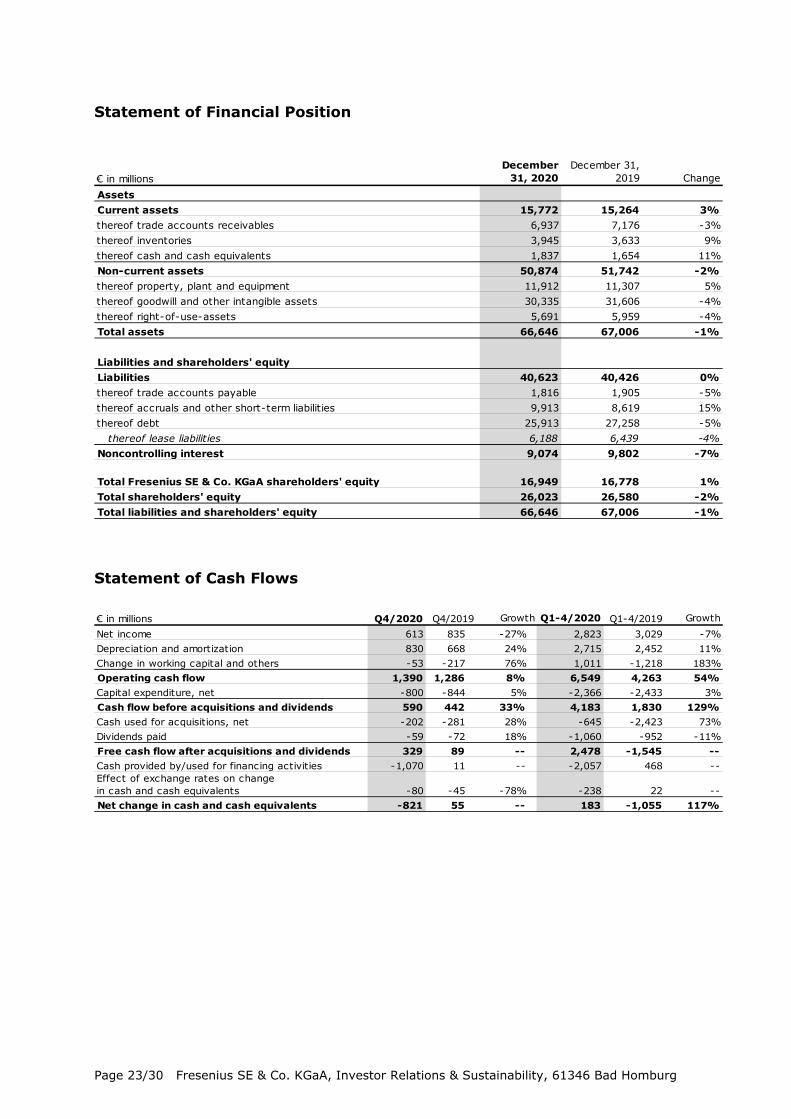
Good cash flow development
Group operating cash flow increased to €1,390 million (Q4/19: €1,286 million) with a
margin of 14.9% (Q4/19: 13.8%). Free cash flow before acquisitions and dividends increased
to €590 million (Q4/19: €442 million). Free cash flow after acquisitions and dividends
increased to €329 million (Q4/19: €89 million).
In FY/20, Group operating cash flow increased to €6,549 million (FY/19: €4,263 million)
with a margin of 18.1% (FY/19: 12.0%). The increase was largely driven by Fresenius
Medical Care due to the U.S. federal relief funding and advanced payments under the
Coronavirus Aid, Relief and Economic Security Act (CARES Act) as well as by the shorter
payment periods of the COVID-19 governmental compensation and reimbursement scheme
for Helios Germany. Also excluding these COVID-19 effects, Group operating cash flow would
have grown year-over-year. Free cash flow before acquisitions and dividends increased to
€4,183 million (FY/19: €1,830 million). Free cash flow after acquisitions and dividends
increased to €2,478 million (FY/19: -€1,545 million, driven by Fresenius Medical Care’s
acquisition of NxStage).
Solid balance sheet structure
Group total assets decreased by 1% (increased by 5% in constant currency) to €66,646
million (Dec. 31, 2019: €67,006 million). The decrease is mainly due to currency translation
effects outweighing the expansion of business activities. Current assets increased by 3%
(10% in constant currency) to €15,772 million (Dec. 31, 2019: €15,264 million), mainly
driven by the increase of cash and cash equivalents. Non-current assets decreased by 2%
(increased by 3% in constant currency) to €50,874 million (Dec. 31, 2019: €51,742 million).
Page 7/30 Fresenius SE & Co. KGaA, Investor Relations & Sustainability, 61346 Bad Homburg
Total shareholders’ equity decreased by 2% (increased by 6% in constant currency) to
€26,023 million (Dec. 31, 2019: €26,580 million). The equity ratio was 39.0% (Dec. 31,
2019: 39.7%).
Group debt decreased by 5% (-2% in constant currency) to €25,913 million (Dec. 31, 2019:
€ 27,258 million). Group net debt decreased by 6% (-4% in constant currency) to € 24,076
million (Dec. 31, 2019: € 25,604 million), driven by the exceptional cash flow development.
As of December 31, 2020, the net debt/EBITDA ratio improved to 3.44x1,2 (Dec. 31, 2019:
3.61x1,2) driven by the exceptional cash flow development, despite COVID-19 effects
weighing on EBITDA.
1 At LTM average exchange rates for both net debt and EBITDA; pro forma closed acquisitions/divestitures 2 Before special items For a detailed overview of special items please see the reconciliation tables on pages 20-22.

Page 8/30 Fresenius SE & Co. KGaA, Investor Relations & Sustainability, 61346 Bad Homburg
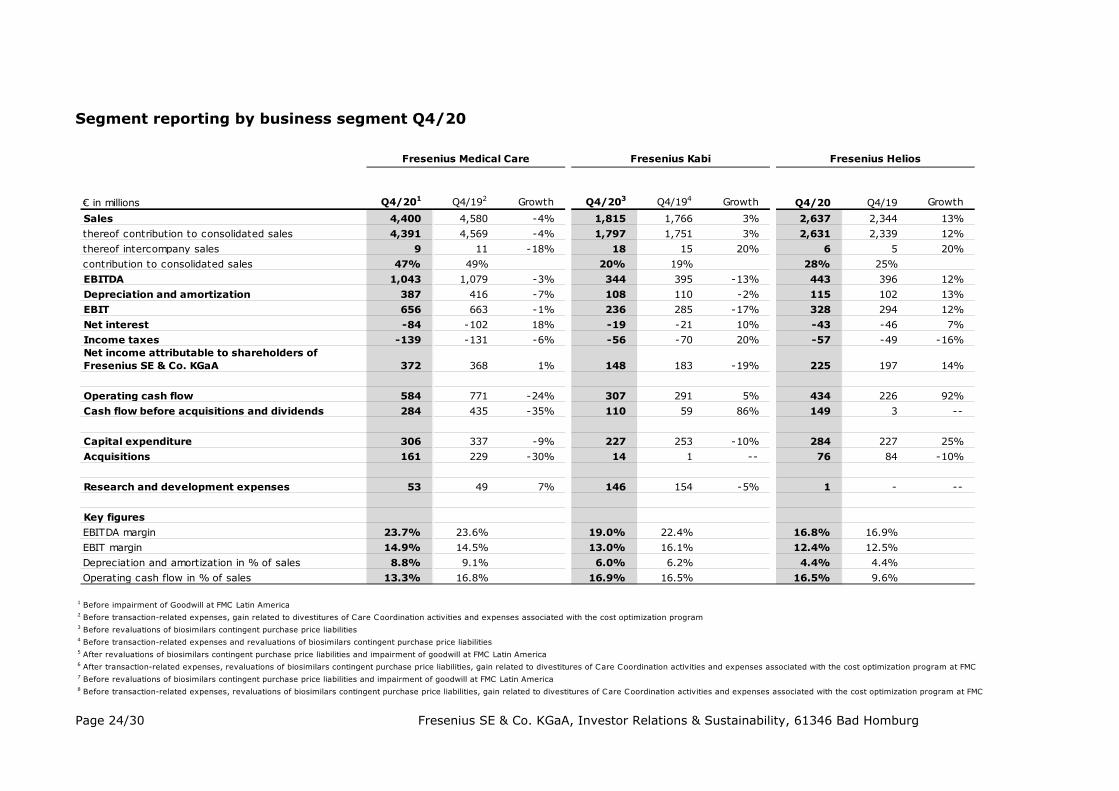
Business Segments
Fresenius Medical Care (Financial data according to Fresenius Medical Care press release) Fresenius Medical Care is the world's largest provider of products and services for individuals with renal diseases. As of December 31, 2020, Fresenius Medical Care was treating 346,553 patients in 4,092 dialysis clinics. Along with its core business, the Renal Care Continuum, the company focuses on expanding in complementary areas and in the field of critical care.12
• 2020 financial targets achieved: 5% revenue and 12% net income growth
• Reported earnings in Q4 negatively impacted by impairment in the Latin America region and accelerated excess mortality due to COVID-19
• Growth in home dialysis on track
Sales of Fresenius Medical Care decreased by 4% (increased by 4% in constant currency) to
€4,400 million (Q4/19: €4,580 million). Thus, currency translation had a negative effect of
8%. Organic growth was 1%. Acquisitions/divestitures contributed net 3% to growth.
In FY/20, Fresenius Medical Care increased sales by 2% (5% in constant currency) to
€17,859 million (FY/19: €17,477 million). Thus, currency translation had a negative effect of
3%. Organic growth was 3%. Acquisitions/divestitures contributed net 2% to growth.
Reported EBIT decreased by 25% (-18% in constant currency) to €462 million (Q4/19: €616
million). The decrease was mainly due to a macro-economic driven impairment of goodwill
and tradenames in the Latin America segment, unfavorable COVID-19 effects and a lower
reimbursement for calcimimetics. The reported EBIT margin was 10.5% (Q4/19: 13.5%).
EBIT on an adjusted basis decreased by 1% (increased by 5% in constant currency) to €657
million (Q4/19: €663 million). The EBIT margin on an adjusted basis was 14.9% (Q4/19:
14.5%).
In FY/20, reported EBIT increased by 2% (4% in constant currency) to €2,304 million
(FY/19: €2,270 million). The reported EBIT margin was 12.9% (FY/19: 13.0%). EBIT on an
1 Before special items 2 Net income attributable to shareholders of Fresenius Medical Care AG & Co. KGaA For a detailed overview of special items please see the reconciliation tables on pages 20-22.
€ in millions Q4/201 Q4/191 GrowthGrowth
(cc) Q1-4/201 Q1-4/191 GrowthGrowth
(cc)Sales 4,400 4,580 -4% 4% 17,859 17,477 2% 5%EBITDA 1,043 1,079 -3% 3% 4,090 3,913 5% 7%EBIT 657 663 -1% 5% 2,499 2,356 6% 8%Net income2 372 368 1% 6% 1,359 1,236 10% 12%Employees (Dec 31/Dec 31) 133,129 128,300 4%

Page 9/30 Fresenius SE & Co. KGaA, Investor Relations & Sustainability, 61346 Bad Homburg
adjusted basis increased by 6% (8% in constant currency) to €2,499 million (FY/19: €2,356
million). The EBIT margin on an adjusted basis was 14.0% (FY/19: 13.5%).
Reported net income1 decreased by 48% (-43% in constant currency) to €177 million (Q4/19:
€343 million) and increased on an adjusted basis by 1% (6% in constant currency) to €372
million (Q4/19: €368 million). In FY/20, reported net income1 decreased by 3% (-1% in
constant currency) to €1,164 million (FY/19: €1,200 million) and increased on an adjusted
basis by 10% (12% in constant currency) to €1,359 million (FY/19: €1,236 million).
Operating cash flow was €584 million (Q4/19: €771 million) with a margin of 13.3%
(Q4/19: 16.8%). In FY/20, operating cash flow was €4,233 million (FY/19: €2,567 million)
with a margin of 23.7% (FY/19: 14.7%). The increase was largely driven by the U.S. federal
relief funding and advanced payments under the CARES Act and other COVID-19 relief, as
well as working capital improvements driven by cash collections.
For FY/21, Fresenius Medical Care expects revenue2 to grow at a low- to mid-single digit
percentage range and net income1,3 to decline at a high-teens to mid-twenties percentage
range against the higher than expected 2020 base4.
For further information, also on the FME25 program, please see Fresenius Medical Care’s press release at www.freseniusmedicalcare.com.
1 Net income attributable to shareholders of Fresenius Medical Care AG & Co. KGaA 2 FY/20 base: €17,859 million 3 FY/20 base: €1,359 million, before special items; FY/21: before special items 4 These targets are based on the 2020 results excluding the impairment of goodwill and trade names in the Latin America Segment of €195 million. They are inclusive of anticipated COVID-19 effects, in constant currency and exclude special items. Special items include costs related to FME25 and other effects that are unusual in nature and have not been foreseeable or not foreseeable in size or impact at the time of giving guidance. For a detailed overview of special items please see the reconciliation tables on pages 20-22.

Page 10/30 Fresenius SE & Co. KGaA, Investor Relations & Sustainability, 61346 Bad Homburg
Fresenius Kabi Fresenius Kabi offers intravenously administered generic drugs, clinical nutrition and infusion therapies for seriously and chronically ill patients in the hospital and outpatient environments. The company is also a leading supplier of medical devices and transfusion technology products. In the biosimilars business, Fresenius Kabi develops products with a focus on oncology and autoimmune diseases..12
• In North America fewer elective treatments, competitive pressure and temporary manufacturing issues outweighed extra demand for COVID-19 related products
• Europe showed strong organic sales growth in Q4 primarily based on extra demand for COVID-19 related products; China with healthy organic growth
• Strong EBIT growth in Emerging Markets with positive development in China only partially compensates EBIT decrease in North America
Sales increased by 3% (8% in constant currency) to €1,815 million (Q4/19: €1,766 million).
Organic growth was 7%. Negative currency translation effects of 5% were mainly related to
weakness of the US dollar, the Brazilian real and the Argentinian peso. Estimated COVID-19
effects made a slight positive contribution to sales growth.
In FY/20, sales increased by 1% (4% in constant currency) to €6,976 million (FY/19: €6,919
million). Organic growth was 4%. Negative currency translation effects of 3% were mainly
related to the weakness of the US dollar, the Brazilian real and the Argentinian peso.
Estimated COVID-19 effects slightly reduced sales growth.
Sales in North America decreased by 10% (organic growth: -3%) to €549 million (Q4/19:
€609 million). The decrease was driven by fewer elective treatments, supply constraints for
certain products due to temporary manufacturing issues and competitive pressure, which
outweighed extra demand for COVID-19 related products. In FY/20, sales in North America
decreased by 2% (organic growth: 0%) to €2,376 million (FY/19: €2,424 million).
Sales in Europe increased by 13% (organic growth: 9%) to €680 million (Q4/19: €604
million) mainly due to increased demand for COVID-19 related products. In FY/20, sales in
Europe increased by 6% (organic growth: 6%) to €2,458 million (FY/19: €2,313 million).
Sales in Asia-Pacific increased by 11% (organic growth: 14%) to €428 million (Q4/19:
1 Before special items 2 Net income attributable to shareholders of Fresenius SE & Co. KGaA For a detailed overview of special items please see the reconciliation tables on pages 20-22.
€ in millions Q4/20 Q4/19 GrowthGrowth
(cc) Q1-4/20 Q1-4/19 GrowthGrowth
(cc)Sales 1,815 1,766 3% 8% 6,976 6,919 1% 4%EBITDA1 344 395 -13% -6% 1,490 1,573 -5% -2%EBIT1 236 285 -17% -10% 1,095 1,205 -9% -6%Net income1,2 148 183 -19% -11% 730 797 -8% -5%Employees (Dec 31/Dec 31) 40,519 39,627 2%

Page 11/30 Fresenius SE & Co. KGaA, Investor Relations & Sustainability, 61346 Bad Homburg
€385 million). While China saw a solid recovery based on increasing elective procedures,
other Asian markets were lagging behind. In FY/20, sales in Asia-Pacific decreased by 1%
(organic growth: 1%) to €1,497 million (FY/19: €1,506 million).
Sales in Latin America/Africa decreased by 6% (organic growth: 16%) to €158 million
(Q4/19: €168 million). In FY/20, sales in Latin America/Africa decreased by 5% (organic
growth: 17%) to €645 million (FY/19: €676 million).
EBIT before special items decreased by 17% (-10% in constant currency) to €236 million
(Q4/191: €285 million) with an EBIT margin before special items of 13.0% (Q4/191:16.1%).
The decline is driven by headwinds leading to some underutilized production capacities in the
US, coupled with selective supply constraints due to temporary manufacturing issues,
incremental COVID-19 related expenses, competitive pressure, a negative effect due to the
bankruptcy of a customer as well as planned SG&A spending ahead of the launch of the
company’s first US biosimilar. Lower corporate costs due to travel restrictions and phasing of
projects partially offset the decline. Estimated COVID-19 effects had a moderate negative
impact on EBIT growth in Q4/20.
In FY/20, EBIT before special items decreased by 9% (-6% in constant currency) to
€1,095 million (FY/191: €1,205 million) with an EBIT margin before special items of 15.7%
(FY/191: 17.4%). Estimated COVID-19 effects had an insignificant impact on EBIT growth in
FY/20.
Net income1,2 decreased by 19% (-11% in constant currency) to €148 million (Q4/191:
€183 million). In FY/20, net income1,2 decreased by 8% (-5% in constant currency) to
€730 million (FY/191: €797 million).
Operating cash flow increased to €307 million (Q4/19: €291 million) with a margin of
16.9% (Q4/19: 16.5%). In FY/20, operating cash flow increased by 11% to €1,143 million
(FY/19: €1,028 million) with a margin of 16.4% (FY/19: 14.9%) due to the favorable
working capital development.
For FY/21, Fresenius Kabi expects organic sales3 growth in a low to mid-single digit
percentage range. Constant currency EBIT4 is expected to show a stable development up to
low single digit percentage growth. Both sales and EBIT outlook include expected COVID-19
effects.
1 Before special items 2 Net income attributable to shareholders of Fresenius SE & Co. KGaA 3 FY/20 base: €6,976 million 4 FY/20 base: €1,095 million, before special items, FY/21: before special items For a detailed overview of special items please see the reconciliation tables on pages 20-22.

Page 12/30 Fresenius SE & Co. KGaA, Investor Relations & Sustainability, 61346 Bad Homburg
Fresenius Helios Fresenius Helios is Europe's leading private hospital operator. The company comprises Helios Germany and Helios Spain (Quirónsalud). Helios Germany operates 89 hospitals, ~130 outpatient centers and 6 prevention centers. Quirónsalud operates 46 hospitals, 70 outpatient centers and around 300 occupational risk prevention centers. In addition, the company is active in Latin America with 6 hospitals and as a provider of medical diagnostics. 1
• Recovery of elective procedures in Spain in Q4
• Continued financial support provided by German government throughout Q4
• Helios Spain with strong organic sales and EBIT growth based on catch-up effects additionally fueled by contributions from acquisitions in Latin America
Sales increased by 13% (13% in constant currency) to €2,637 million (Q4/19:
€2,344 million). Organic growth was 9%. Acquisitions contributed 4% to sales growth.
COVID-19 effects had an insignificant effect on organic growth.
In FY/20, sales increased by 6% (7% in constant currency) to €9,818 million (FY/19: €9,234
million). Organic growth was 4%. Acquisitions contributed 3% to sales growth. COVID-19
effects had a slight negative impact on organic growth.
Sales of Helios Germany increased by 11% (organic growth: 8%) to €1,637 million (Q4/19:
€1,475 million).
In FY/20, sales of Helios Germany increased by 7% (organic growth: 6%) to €6,340 million
(FY/19: €5,940 million). COVID-19 effects were mitigated by government financial support
and hence had only a slight negative impact on organic growth in both Q4/20 and FY/20.
Sales of Helios Spain increased by 15% (17% in constant currency) to €999 million (Q4/19:
€867 million). Organic growth of 11% was driven by a strong recovery of elective procedures
and a consistently high level of outpatient treatments. Thus, COVID-19 effects had a
moderate positive impact on organic growth in Q4. The hospital acquisitions in Colombia
contributed 6% to sales growth.
In FY/20, sales of Helios Spain increased by 6% (7% in constant currency) to €3,475 million
(FY/19: €3,292 million). Organic growth was 2%. Acquisitions contributed 5% to sales
growth. COVID-19 effects had a significant negative impact on organic sales growth.
1 Net income attributable to shareholders of Fresenius SE & Co. KGaA
€ in millions Q4/20 Q4/19 GrowthGrowth
(cc) Q1-4/20 Q1-4/19 GrowthGrowth
(cc)Sales 2,637 2,344 13% 13% 9,818 9,234 6% 7%EBITDA 443 396 12% 13% 1,470 1,439 2% 2%EBIT 328 294 12% 13% 1,025 1,025 0% 0%Net income1 225 197 14% 15% 666 664 0% 0%Employees (Dec 31/Dec 31) 116,952 106,377 10%

Page 13/30 Fresenius SE & Co. KGaA, Investor Relations & Sustainability, 61346 Bad Homburg
EBIT of Fresenius Helios increased by 12% (13% in constant currency) to €328 million
(Q4/19: €294 million) with an EBIT margin of 12.4% (Q4/19: 12.5%). COVID-19 effects, in
particular due to the strong recovery of elective procedures in Spain, had a significant
positive effect on EBIT growth in Q4.
In FY/20, EBIT of Fresenius Helios remained on prior year’s level (0% in constant currency)
at €1,025 million (FY/19: €1,025 million) with an EBIT margin of 10.4% (FY/19: 11.1%).
COVID-19 effects had a moderate negative impact on EBIT growth.
EBIT of Helios Germany increased by 10% to €157 million (Q4/19: €143 million) with an
EBIT margin of 9.6% (Q4/19: 9.7%). Financial support provided by the German government
under revised regulations focusing on regions with high COVID incidences broadly offset
additional headwinds as Helios Germany continued to play a crucial role in treating COVID-19
patients.
In FY/20, EBIT of Helios Germany increased by 4% to €602 million (FY/19: €577 million)
with an EBIT margin of 9.5% (FY/19: 9.7%). Due to the comprehensive financial support
provided by the German government, COVID-19 effects had an overall insignificant impact
on the EBIT development.
EBIT of Helios Spain increased by 17% (19% in constant currency) to €159 million (Q4/19:
€136 million) with an EBIT margin of 15.9% (Q4/19: 15.7%). The growth is driven by a
recovery of elective procedures following the government-ordered postponement of planned
surgical procedures in Q2, where medically justifiable. Thus, COVID-19 effects had a
significant positive effect on EBIT growth in Q4.
In FY/20, EBIT of Helios Spain decreased by 5% (-5% in constant currency) to €420 million
(FY/19: €443 million) with an EBIT margin of 12.1% (FY/19: 13.5%). COVID-19 effects had
a very significant negative impact on EBIT growth with missing or delayed elective
procedures and higher expenses amid the comprehensive efforts to combat the pandemic.
Net income1 increased by 14% to €225 million (Q4/19: €197 million).
In FY/20, net income1 remained on prior year’s level at €666 million (FY/19: €664 million).
Operating cash flow increased to €434 million (Q4/19: €226 million) with a margin of
16.5% (Q4/19: 9.6%), driven by phasing of payments under the German law to ease the
financial burden on hospitals.
In FY/20, operating cash flow increased to €1,149 million (FY/19: €733 million) with a
margin of 11.7% (FY/19: 7.9%).
1 Net income attributable to shareholders of Fresenius SE & Co. KGaA

Page 14/30 Fresenius SE & Co. KGaA, Investor Relations & Sustainability, 61346 Bad Homburg
For FY/21, Fresenius Helios expects organic sales1 growth in a low to mid-single digit
percentage range and constant currency EBIT2 growth in a mid to high single digit
percentage range. Both sales and EBIT outlook include expected COVID-19 effects.
1 FY/20 base: €9,818 million 2 FY/20 base: €1,025 million; FY/21 before special items

Page 15/30 Fresenius SE & Co. KGaA, Investor Relations & Sustainability, 61346 Bad Homburg
Fresenius Vamed
Fresenius Vamed manages projects and provides services for hospitals and other health care facilities worldwide and is a leading post-acute care provider in Central Europe. The portfolio ranges along the entire value chain: from project development, planning, and turnkey construction, via maintenance and technical management to total operational management.1
• Significant COVID-19 impact in the project business related to delays, cancellations and global supply chain restraints continued
• Good order intake in Q4 indicates first signs of recovery in project business
• Rehabilitation business continued to be impacted by less demand for rehabilitation treatments and postponements of elective surgeries; technical service business remained robust
Sales decreased by 22% (-22% in constant currency) to €577 million (Q4/19: €737 million).
Organic growth was -22%. Acquisitions did not contribute to growth. Estimated COVID-19
effects had a very significant negative impact on growth.
In FY/20, sales decreased by 6% (-6% in constant currency) to €2,068 million (FY/19:
€2,206 million). Organic growth was -8%. Acquisitions contributed 2% to growth. Estimated
COVID-19 effects had a very significant negative impact on growth.
Sales in the service business decreased by 1% to €372 million (Q4/19: €374 million).
Sales in the project business decreased by 44% to €205 million (Q4/19: €363 million),
driven by postponements and cancellations of projects.
In FY/20, sales in the service business grew by 3% to €1,435 million (FY/19: €1,399 million).
Sales in the project business decreased by 22% to €633 million (FY/19: €807 million).
1 Net income attributable to shareholders of VAMED AG
€ in millions Q4/20 Q4/19 GrowthGrowth
(cc) Q1-4/20 Q1-4/19 GrowthGrowth
(cc)Sales 577 737 -22% -22% 2,068 2,206 -6% -6%EBITDA 62 86 -28% -27% 113 205 -45% -45%EBIT 39 67 -42% -43% 29 134 -78% -79%Net income1 25 44 -43% -43% 2 83 -98% -98%Employees (Dec 31/Dec 31) 19,414 18,592 4%
Page 16/30 Fresenius SE & Co. KGaA, Investor Relations & Sustainability, 61346 Bad Homburg
EBIT decreased by 42% (-42% in constant currency) to €39 million (Q4/19: €67 million)
with an EBIT margin of 6.8% (Q4/19: 9.1%). Estimated COVID-19 effects had a very
significant negative impact on EBIT. Capacities in the post-acute care clinics were left
partially empty given a generally lower intake of elective surgery patients from acute-care
hospitals. Authority-instigated restrictions or even closures of individual facilities also had a
negative effect. In the project business, project delays and global supply chain restraints
triggered incremental expenses.
In FY/20, EBIT decreased by 78% (-79% in constant currency) to €29 million (FY/19:
€134 million) with an EBIT margin of 1.4% (FY/19: 6.1%). Estimated COVID-19 effects had
a very significant negative impact on EBIT.
Net income1 decreased to €25 million (Q4/19: €44 million).
In FY/20, net income1 decreased to €2 million (FY/19: €83 million).
Order intake was €648 million in Q4/20 (Q4/19: €576 million) and €1,010 million in FY/20
(FY/19: €1,314 million). As of December 31, 2020, order backlog was at €3,055 million
(December 31, 2019: €2,865 million). Order intake and order backlog were marked by
COVID-19 related cancellations and project delays.
Operating cash flow increased to €74 million (Q4/19: €0 million) with a margin of
12.8% (Q4/19: 0%), driven by a favorable working capital development mainly related to
pre-payments.
In FY/20, operating cash flow increased to €78 million (FY/19: -€17 million) with a margin of
3.8% (FY/19: -0.8%).
For FY/21, Fresenius Vamed expects organic sales2 growth in a mid to high single digit
percentage range and EBIT3 to grow to a high double-digit euro million amount. Both sales
and EBIT outlook include expected negative COVID-19 effects.
1 Net income attributable to shareholders of VAMED AG 2 FY/20 base: €2,068 million 3 FY/20 base: €29 million; FY/21 before special items
Page 17/30 Fresenius SE & Co. KGaA, Investor Relations & Sustainability, 61346 Bad Homburg
Conference Call
As part of the publication of the results for FY 2020, a conference call will be held on
February 23, 2021 at 1:30 p.m. CET (7:30 a.m. EST). All investors are cordially invited to
follow the conference call in a live broadcast over the Internet at
www.fresenius.com/investors. Following the call, a replay will be available on our website.
# # #
For additional information on the performance indicators used please refer to our website
https://www.fresenius.com/alternative-performance-measures.
# # #
Fresenius is a global health care group, providing products and services for dialysis, hospital and outpatient medical care. In 2020, Group sales were €36.3 billion. On December 31, 2020, the Fresenius Group had 311,269 employees worldwide. For more information visit the Company’s website at www.fresenius.com. Follow us on Twitter: www.twitter.com/fresenius_ir Follow us on LinkedIn: www.linkedin.com/company/fresenius-investor-relations This release contains forward-looking statements that are subject to various risks and uncertainties. Future results could differ materially from those described in these forward-looking statements due to certain factors, e.g. changes in business, economic and competitive conditions, regulatory reforms, results of clinical trials, foreign exchange rate fluctuations, uncertainties in litigation or investigative proceedings, and the availability of financing. Fresenius does not undertake any responsibility to update the forward-looking statements in this release. Fresenius SE & Co. KGaA Registered Office: Bad Homburg, Germany Commercial Register: Amtsgericht Bad Homburg, HRB 11852 Chairman of the Supervisory Board: Dr. Gerd Krick General Partner: Fresenius Management SE Registered Office: Bad Homburg, Germany Commercial Register: Amtsgericht Bad Homburg, HRB 11673 Management Board: Stephan Sturm (Chairman), Dr. Sebastian Biedenkopf, Dr. Francesco De Meo, Rachel Empey, Mats Henriksson, Rice Powell, Dr. Ernst Wastler Chairman of the Supervisory Board: Dr. Gerd Krick

Page 18/30 Fresenius SE & Co. KGaA, Investor Relations & Sustainability, 61346 Bad Homburg
Fresenius Group Figures and Targets
Basis FY/20 for Guidance FY/21
Group and Segments
Estimated COVID-19 effects Q4/20 and FY/20
€ in millionsFresenius
GroupFresenius
Medical CareFresenius
Kabi
Sales reported (base Fresenius Group, FMC, Fresenius Kabi) 36,277 17,859 6,976
Revaluations of biosimilars contingent purchase price liabilities 32
EBIT (before special items = base Fresenius Kabi guidance) 1,095
Net income (as reported) 1,707 1,164
Revaluations of biosimilars contingent purchase price liabilities 26
Impairment of Goodwill at Fresenius Medical Care Lateinamerika 63 195
Net income (before special items = base FMC guidance) 1,359
Net income (before special items = base Fresenius Group guidance) 1,796
€m Q4/20 FY/20 Q4/20 FY/20Sales 5% 5% -2% to -3% -2% to -3%Net income before special items1 2% -3% -1% to -5% -5% to -9%
1 Net income attributable to shareholders of Fresenius SE & Co. KGaA
Growth cc
as reported incl. COVID-19
Estimated
COVID impact cc
Page 19/30 Fresenius SE & Co. KGaA, Investor Relations & Sustainability, 61346 Bad Homburg
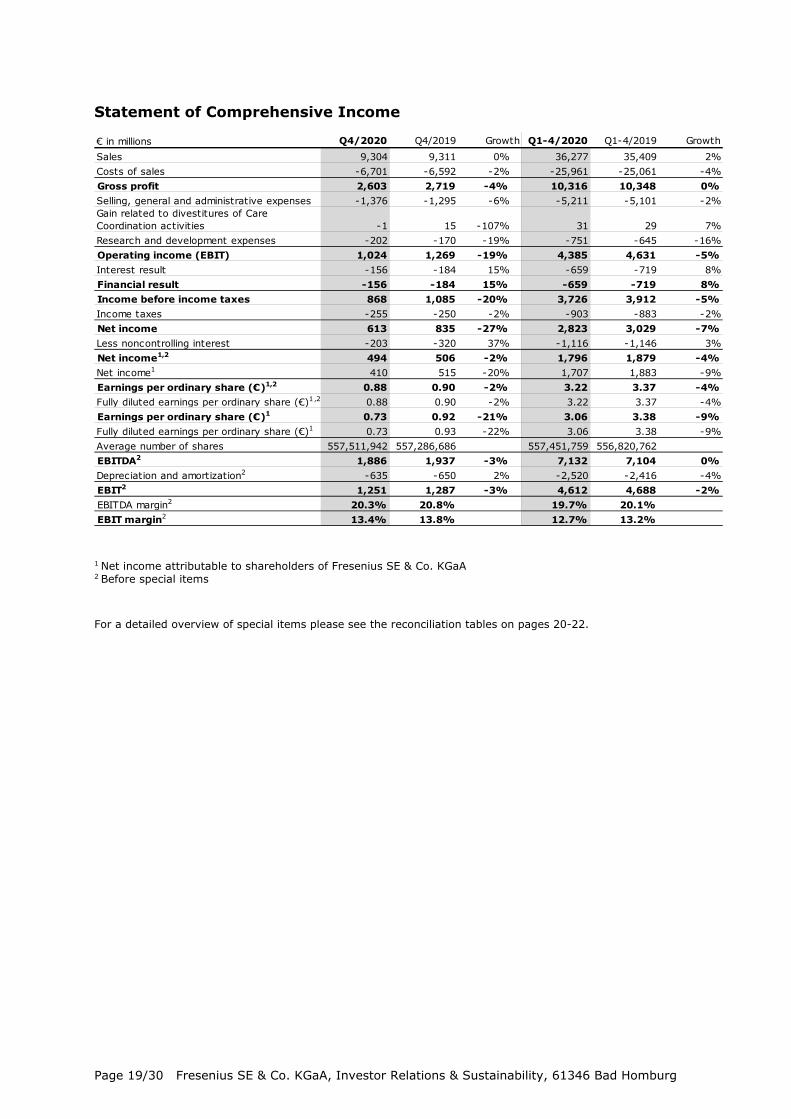
Statement of Comprehensive Income
1 Net income attributable to shareholders of Fresenius SE & Co. KGaA 2 Before special items For a detailed overview of special items please see the reconciliation tables on pages 20-22.
€ in millions Q4/2020 Q4/2019 Growth Q1-4/2020 Q1-4/2019 GrowthSales 9,304 9,311 0% 36,277 35,409 2%Costs of sales -6,701 -6,592 -2% -25,961 -25,061 -4%Gross profit 2,603 2,719 -4% 10,316 10,348 0%Selling, general and administrative expenses -1,376 -1,295 -6% -5,211 -5,101 -2%Gain related to divestitures of Care Coordination activities -1 15 -107% 31 29 7%Research and development expenses -202 -170 -19% -751 -645 -16%Operating income (EBIT) 1,024 1,269 -19% 4,385 4,631 -5%Interest result -156 -184 15% -659 -719 8%Financial result -156 -184 15% -659 -719 8%Income before income taxes 868 1,085 -20% 3,726 3,912 -5%Income taxes -255 -250 -2% -903 -883 -2%Net income 613 835 -27% 2,823 3,029 -7%Less noncontrolling interest -203 -320 37% -1,116 -1,146 3%Net income1,2 494 506 -2% 1,796 1,879 -4%Net income1 410 515 -20% 1,707 1,883 -9%Earnings per ordinary share (€)1,2 0.88 0.90 -2% 3.22 3.37 -4%Fully diluted earnings per ordinary share (€)1,2 0.88 0.90 -2% 3.22 3.37 -4%Earnings per ordinary share (€)1 0.73 0.92 -21% 3.06 3.38 -9%Fully diluted earnings per ordinary share (€)1 0.73 0.93 -22% 3.06 3.38 -9%Average number of shares 557,511,942 557,286,686 557,451,759 556,820,762EBITDA2 1,886 1,937 -3% 7,132 7,104 0%Depreciation and amortization2 -635 -650 2% -2,520 -2,416 -4%EBIT2 1,251 1,287 -3% 4,612 4,688 -2%EBITDA margin2 20.3% 20.8% 19.7% 20.1%EBIT margin2 13.4% 13.8% 12.7% 13.2%

Page 20/30 Fresenius SE & Co. KGaA, Investor Relations & Sustainability, 61346 Bad Homburg
Reconciliation
Consolidated results for Q4/2020 and FY/2020 as well as for Q4/2019 and FY/2019 include special items. The special items shown within the reconciliation tables are reported in the Group Corporate / Other segment. Fresenius Group Q4/20
1 Net income attributable to shareholders of Fresenius SE & Co. KGaA
€ in millions Q4/20 Q4/19Growth
rateGrowth rate
(cc)Sales reported 9,304 9,311 0% 5%
EBIT reported (after special items) 1,024 1,269 -19% -14%Transaction costs Akorn - 0Revaluations of biosimilars contingent purchase price liabilities 32 -28Gain related to divestitures of Care Coordination activities - -15Transaction costs NxStage - 2Expenses associated with the cost optimization program at FMC - 59Impairment of Goodwill at FMC Latin America 195 -EBIT (before special items) 1,251 1,287 -3% 2%
Net interest reported (after special items) -156 -184 15% 11%Revaluations of biosimilars contingent purchase price liabilities -3 2Net interest (before special items) -159 -182 13% 9%
Income taxes reported (after special items) -255 -250 -2% -10%Transaction costs Akorn - 0Revaluations of biosimilars contingent purchase price liabilities -8 8Gain related to divestitures of Care Coordination activities - -5Transaction costs NxStage - 0Expenses associated with the cost optimization program at FMC - -16Income taxes (before special items) -263 -263 0% -8%
Noncontrolling interests reported (after special items) -203 -320 37% 31%Gain related to divestitures of Care Coordination activities - 14Transaction costs NxStage - -1Expenses associated with the cost optimization program at FMC - -29Impairment of Goodwill at FMC Latin America -132 -Noncontrolling interests (before special items) -335 -336 0% -5%
Net income reported (after special items)1 410 515 -20% -17%Transaction costs Akorn - 0Revaluations of biosimilars contingent purchase price liabilities 21 -18Gain related to divestitures of Care Coordination activities - -6Transaction costs NxStage - 1Expenses associated with the cost optimization program at FMC - 14Impairment of Goodwill at FMC Latin America 63 -Net income (before special items)1 494 506 -2% 2%
Page 21/30 Fresenius SE & Co. KGaA, Investor Relations & Sustainability, 61346 Bad Homburg
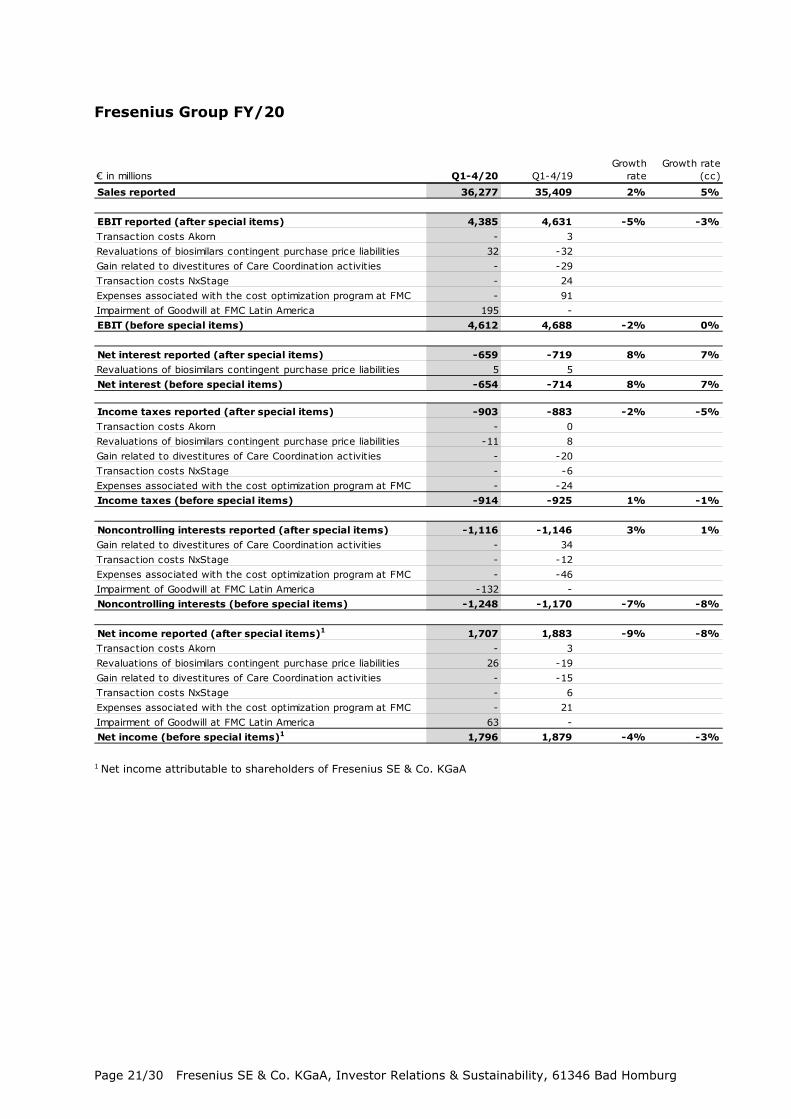
Fresenius Group FY/20
1 Net income attributable to shareholders of Fresenius SE & Co. KGaA
€ in millions Q1-4/20 Q1-4/19Growth
rateGrowth rate
(cc)Sales reported 36,277 35,409 2% 5%
EBIT reported (after special items) 4,385 4,631 -5% -3%Transaction costs Akorn - 3Revaluations of biosimilars contingent purchase price liabilities 32 -32Gain related to divestitures of Care Coordination activities - -29Transaction costs NxStage - 24Expenses associated with the cost optimization program at FMC - 91Impairment of Goodwill at FMC Latin America 195 -EBIT (before special items) 4,612 4,688 -2% 0%
Net interest reported (after special items) -659 -719 8% 7%Revaluations of biosimilars contingent purchase price liabilities 5 5Net interest (before special items) -654 -714 8% 7%
Income taxes reported (after special items) -903 -883 -2% -5%Transaction costs Akorn - 0Revaluations of biosimilars contingent purchase price liabilities -11 8Gain related to divestitures of Care Coordination activities - -20Transaction costs NxStage - -6Expenses associated with the cost optimization program at FMC - -24Income taxes (before special items) -914 -925 1% -1%
Noncontrolling interests reported (after special items) -1,116 -1,146 3% 1%Gain related to divestitures of Care Coordination activities - 34Transaction costs NxStage - -12Expenses associated with the cost optimization program at FMC - -46Impairment of Goodwill at FMC Latin America -132 -Noncontrolling interests (before special items) -1,248 -1,170 -7% -8%
Net income reported (after special items)1 1,707 1,883 -9% -8%Transaction costs Akorn - 3Revaluations of biosimilars contingent purchase price liabilities 26 -19Gain related to divestitures of Care Coordination activities - -15Transaction costs NxStage - 6Expenses associated with the cost optimization program at FMC - 21Impairment of Goodwill at FMC Latin America 63 -Net income (before special items)1 1,796 1,879 -4% -3%

Page 22/30 Fresenius SE & Co. KGaA, Investor Relations & Sustainability, 61346 Bad Homburg
Reconciliation Fresenius Medical Care (according to Fresenius Medical Care)
1 Net income attributable to shareholders of Fresenius Medical Care AG & Co. KGaA
1 Net income attributable to shareholders of Fresenius Medical Care AG & Co. KGaA
Reconciliation Kabi
in € millions Q4/20 Q4/19Growth
rateGrowth
rate (cc)Sales reported 4,400 4,580 -4% 4%
EBIT reported (after special items) 462 616 -25% -18%Gain related to divestitures of Care Coordination activities - -15Transaction costs NxStage - 2Expenses associated with the cost optimization program - 60Impairment of Goodwill at FMC Latin America 195 -EBIT (before special items) 657 663 -1% 5%
Net income reported (after special items)1 177 343 -48% -43%Gain related to divestitures of Care Coordination activities - -20Transaction costs NxStage - 1Expenses associated with the cost optimization program - 44Impairment of Goodwill at FMC Latin America 195 -Net income (before special items)1 372 368 1% 6%
in € millions Q1-4/20 Q1-4/19 Growth rateGrowth
rate (cc)Sales reported 17,859 17,477 2% 5%
EBIT reported (after special items) 2,304 2,270 2% 4%Gain related to divestitures of Care Coordination activities - -29Transaction costs NxStage - 24Expenses associated with the cost optimization program - 91Impairment of Goodwill at FMC Latin America 195 -EBIT (before special items) 2,499 2,356 6% 8%
Net income reported (after special items)1 1,164 1,200 -3% -1%Gain related to divestitures of Care Coordination activities - -49Transaction costs NxStage - 18Expenses associated with the cost optimization program - 67Impairment of Goodwill at FMC Latin America 195 -Net income (before special items)1 1,359 1,236 10% 12%
€ in millions Q4/20 Q4/19Growth
rateGrowth
rate (cc)Sales reported 1,815 1,766 3% 8%
Transaction costs Akorn - 0Revaluations of biosimilars contingent purchase price liabilities 32 -28EBIT (before special items) 236 285 -17% -10%
€ in millions Q1-4/20 Q1-4/19Growth
rateGrowth
rate (cc)Sales reported 6,976 6,919 1% 4%
Transaction costs Akorn - 3Revaluations of biosimilars contingent purchase price liabilities 32 -32EBIT (before special items) 1,095 1,205 -9% -6%
Page 23/30 Fresenius SE & Co. KGaA, Investor Relations & Sustainability, 61346 Bad Homburg
Statement of Financial Position
Statement of Cash Flows
€ in millionsDecember
31, 2020December 31,
2019 ChangeAssetsCurrent assets 15,772 15,264 3%thereof trade accounts receivables 6,937 7,176 -3%thereof inventories 3,945 3,633 9%thereof cash and cash equivalents 1,837 1,654 11%Non-current assets 50,874 51,742 -2%thereof property, plant and equipment 11,912 11,307 5%thereof goodwill and other intangible assets 30,335 31,606 -4%thereof right-of-use-assets 5,691 5,959 -4%Total assets 66,646 67,006 -1%
Liabilities and shareholders' equityLiabilities 40,623 40,426 0%thereof trade accounts payable 1,816 1,905 -5%thereof accruals and other short-term liabilities 9,913 8,619 15%thereof debt 25,913 27,258 -5% thereof lease liabilities 6,188 6,439 -4%Noncontrolling interest 9,074 9,802 -7%
Total Fresenius SE & Co. KGaA shareholders' equity 16,949 16,778 1%Total shareholders' equity 26,023 26,580 -2%Total liabilities and shareholders' equity 66,646 67,006 -1%
€ in millions Q4/2020 Q4/2019 Growth Q1-4/2020 Q1-4/2019 GrowthNet income 613 835 -27% 2,823 3,029 -7%Depreciation and amortization 830 668 24% 2,715 2,452 11%Change in working capital and others -53 -217 76% 1,011 -1,218 183%Operating cash flow 1,390 1,286 8% 6,549 4,263 54%Capital expenditure, net -800 -844 5% -2,366 -2,433 3%Cash flow before acquisitions and dividends 590 442 33% 4,183 1,830 129%Cash used for acquisitions, net -202 -281 28% -645 -2,423 73%Dividends paid -59 -72 18% -1,060 -952 -11%Free cash flow after acquisitions and dividends 329 89 -- 2,478 -1,545 --Cash provided by/used for financing activities -1,070 11 -- -2,057 468 --Effect of exchange rates on change in cash and cash equivalents -80 -45 -78% -238 22 --Net change in cash and cash equivalents -821 55 -- 183 -1,055 117%
Page 24/30 Fresenius SE & Co. KGaA, Investor Relations & Sustainability, 61346 Bad Homburg
Segment reporting by business segment Q4/20
€ in millions Q4/201 Q4/192 Growth Q4/203 Q4/194 Growth Q4/20 Q4/19 GrowthSales 4,400 4,580 -4% 1,815 1,766 3% 2,637 2,344 13%thereof contribution to consolidated sales 4,391 4,569 -4% 1,797 1,751 3% 2,631 2,339 12%thereof intercompany sales 9 11 -18% 18 15 20% 6 5 20%contribution to consolidated sales 47% 49% 20% 19% 28% 25%EBITDA 1,043 1,079 -3% 344 395 -13% 443 396 12%Depreciation and amortization 387 416 -7% 108 110 -2% 115 102 13%EBIT 656 663 -1% 236 285 -17% 328 294 12%Net interest -84 -102 18% -19 -21 10% -43 -46 7%Income taxes -139 -131 -6% -56 -70 20% -57 -49 -16%Net income attributable to shareholders of Fresenius SE & Co. KGaA 372 368 1% 148 183 -19% 225 197 14%
Operating cash flow 584 771 -24% 307 291 5% 434 226 92%Cash flow before acquisitions and dividends 284 435 -35% 110 59 86% 149 3 --
Capital expenditure 306 337 -9% 227 253 -10% 284 227 25%Acquisitions 161 229 -30% 14 1 -- 76 84 -10%
Research and development expenses 53 49 7% 146 154 -5% 1 - --
Key figuresEBITDA margin 23.7% 23.6% 19.0% 22.4% 16.8% 16.9%EBIT margin 14.9% 14.5% 13.0% 16.1% 12.4% 12.5%Depreciation and amortization in % of sales 8.8% 9.1% 6.0% 6.2% 4.4% 4.4%Operating cash flow in % of sales 13.3% 16.8% 16.9% 16.5% 16.5% 9.6%
Fresenius Medical Care Fresenius Kabi Fresenius Helios
1 Before impairment of Goodwill at FMC Latin America2 Before transaction-related expenses, gain related to divestitures of Care Coordination activities and expenses associated with the cost optimization program3 Before revaluations of biosimilars contingent purchase price liabilities4 Before transaction-related expenses and revaluations of biosimilars contingent purchase price liabilities5 After revaluations of biosimilars contingent purchase price liabilities and impairment of goodwill at FMC Latin America6 After transaction-related expenses, revaluations of biosimilars contingent purchase price liabilities, gain related to divestitures of Care Coordination activities and expenses associated with the cost optimization program at FMC7 Before revaluations of biosimilars contingent purchase price liabilities and impairment of goodwill at FMC Latin America8 Before transaction-related expenses, revaluations of biosimilars contingent purchase price liabilities, gain related to divestitures of Care Coordination activities and expenses associated with the cost optimization program at FMC

Page 25/30 Fresenius SE & Co. KGaA, Investor Relations & Sustainability, 61346 Bad Homburg
€ in millions Q4/20 Q4/19 Growth Q4/205 Q4/196 Growth Q4/20 Q4/19 GrowthSales 577 737 -22% -125 -116 -8% 9,304 9,311 0%thereof contribution to consolidated sales 484 651 -26% 1 1 0% 9,304 9,311 0%thereof intercompany sales 93 86 8% -126 -117 -8% 0 0contribution to consolidated sales 5% 7% 0% 0% 100% 100%EBITDA 62 86 -28% -38 -19 -100% 1,854 1,937 -4%Depreciation and amortization 23 19 21% 197 21 -- 830 668 24%EBIT 39 67 -42% -235 -40 -- 1,024 1,269 -19%Net interest -6 -8 25% -4 -7 43% -156 -184 15%Income taxes -7 -14 50% 4 14 -71% -255 -250 -2%Net income attributable to shareholders of Fresenius SE & Co. KGaA 25 44 -43% -360 -277 -30% 410 515 -20%
Operating cash flow 74 0 -9 -2 -- 1,390 1,286 8%Cash flow before acquisitions and dividends 61 -31 -- -14 -24 42% 590 442 33%
Capital expenditure 31 33 -6% 8 21 -62% 856 871 -2%Acquisitions 0 17 -100% 0 0 251 331 -24%
Research and development expenses 0 0 2 -33 106% 202 170 19%
Key figuresEBITDA margin 10.7% 11.7% 20.3% 3 20.8% 8
EBIT margin 6.8% 9.1% 13.4% 7 13.8% 8
Depreciation and amortization in % of sales 4.0% 2.6% 8.9% 7.2%Operating cash flow in % of sales 12.8% 0.0% 14.9% 13.8%
Fresenius GroupFresenius Vamed Corporate/Others
1 Before impairment of Goodwill at FMC Latin America2 Before transaction-related expenses, gain related to divestitures of Care Coordination activities and expenses associated with the cost optimization program3 Before revaluations of biosimilars contingent purchase price liabilities4 Before transaction-related expenses and revaluations of biosimilars contingent purchase price liabilities5 After revaluations of biosimilars contingent purchase price liabilities and impairment of goodwill at FMC Latin America6 After transaction-related expenses, revaluations of biosimilars contingent purchase price liabilities, gain related to divestitures of Care Coordination activities and expenses associated with the cost optimization program at FMC7 Before revaluations of biosimilars contingent purchase price liabilities and impairment of goodwill at FMC Latin America8 Before transaction-related expenses, revaluations of biosimilars contingent purchase price liabilities, gain related to divestitures of Care Coordination activities and expenses associated with the cost optimization program at FMC

Page 26/30 Fresenius SE & Co. KGaA, Investor Relations & Sustainability, 61346 Bad Homburg
Segment reporting by business segment FY/20
€ in millions Q1-4/201 Q1-4/192 Growth Q1-4/203 Q1-4/194 Growth Q1-4/20 Q1-4/19 GrowthSales 17,859 17,477 2% 6,976 6,919 1% 9,818 9,234 6%thereof contribution to consolidated sales 17,819 17,434 2% 6,916 6,865 1% 9,798 9,217 6%thereof intercompany sales 40 43 -7% 60 54 11% 20 17 18%contribution to consolidated sales 49% 49% 19% 20% 27% 26%EBITDA 4,090 3,913 5% 1,490 1,573 -5% 1,470 1,439 2%Depreciation and amortization 1,591 1,557 2% 395 368 7% 445 414 7%EBIT 2,499 2,356 6% 1,095 1,205 -9% 1,025 1,025 0%Net interest -368 -429 14% -82 -83 1% -180 -176 -2%Income taxes -501 -452 -11% -239 -276 13% -171 -173 1%Net income attributable to shareholders of Fresenius SE & Co. KGaA 1,359 1,236 10% 730 797 -8% 666 664 0%
Operating cash flow 4,233 2,567 65% 1,143 1,028 11% 1,149 733 57%Cash flow before acquisitions and dividends 3,197 1,454 120% 450 312 44% 609 256 138%
Total assets 31,689 32,935 -4% 13,591 13,797 -1% 19,241 18,164 6%Debt 12,380 13,782 -10% 4,181 4,375 -4% 7,472 7,457 0%Other operating liabilities 6,192 5,185 19% 3,225 3,207 1% 2,585 2,084 24%Capital expenditure 1,052 1,125 -6% 687 726 -5% 541 482 12%Acquisitions 407 2,297 -82% 31 86 -64% 459 211 118%
Research and development expenses 194 168 15% 553 507 9% 2 2 0%Employees (per capita on balance sheet date) 133,129 128,300 4% 40,519 39,627 2% 116,952 106,377 10%
Key figuresEBITDA margin 22.9% 22.4% 21.4% 22.7% 15.0% 15.6%EBIT margin 14.0% 13.5% 15.7% 17.4% 10.4% 11.1%Depreciation and amortization in % of sales 8.9% 8.9% 5.7% 5.3% 4.5% 4.5%Operating cash flow in % of sales 23.7% 14.7% 16.4% 14.9% 11.7% 7.9%ROOA 8.2% 7.6% 9.2% 10.5% 5.7% 6.1%
Fresenius Medical Care Fresenius Kabi Fresenius Helios
1 Before impairment of Goodwill at FMC Latin America2 Before transaction-related expenses, gain related to divestitures of Care Coordination activities and expenses associated with the cost optimization program3 Before revaluations of biosimilars contingent purchase price liabilities4 Before transaction-related expenses and revaluations of biosimilars contingent purchase price liabilities5 After revaluations of biosimilars contingent purchase price liabilities and impairment of Goodwill at FMC Latin America6 After transaction-related expenses, revaluations of biosimilars contingent purchase price liabilities, gain related to divestitures of Care Coordination activities and expenses associated with the cost optimization program at FMC7 Before revaluations of biosimilars contingent purchase price liabilities and impairment of Goodwill at FMC Latin America8 Before transaction-related expenses, revaluations of biosimilars contingent purchase price liabilities, gain related to divestitures of Care Coordination activities and expenses associated with the cost optimization program at FMC9 The underlying pro forma EBIT does not include revaluations of biosimilars contingent purchase price liabilities and impairment of Goodwill at FMC Latin America.10 The underlying pro forma EBIT does not include transaction-related expenses, revaluations of biosimilars contingent purchase price liabilities, gain related to divestitures of Care Coordination activities and expenses associated with the cost optimization program at FMC.

Page 27/30 Fresenius SE & Co. KGaA, Investor Relations & Sustainability, 61346 Bad Homburg
€ in millions Q1-4/20 Q1-4/19 Growth Q1-4/205 Q1-4/196 Growth Q1-4/20 Q1-4/19 GrowthSales 2,068 2,206 -6% -444 -427 -4% 36,277 35,409 2%thereof contribution to consolidated sales 1,742 1,892 -8% 2 1 100% 36,277 35,409 2%thereof intercompany sales 326 314 4% -446 -428 -4% 0 0contribution to consolidated sales 5% 5% 0% 0% 100% 100%EBITDA 113 205 -45% -63 -47 -34% 7,100 7,083 0%Depreciation and amortization 84 71 18% 200 42 -- 2,715 2,452 11%EBIT 29 134 -78% -263 -89 -196% 4,385 4,631 -5%Net interest -20 -21 5% -9 -10 10% -659 -719 8%Income taxes -4 -28 86% 12 46 -74% -903 -883 -2%Net income attributable to shareholders of Fresenius SE & Co. KGaA 2 83 -98% -1,050 -897 -17% 1,707 1,883 -9%
Operating cash flow 78 -17 -- -54 -48 -13% 6,549 4,263 54%Cash flow before acquisitions and dividends 2 -69 103% -75 -123 39% 4,183 1,830 129%
Total assets 2,716 2,721 0% -591 -611 3% 66,646 67,006 -1%Debt 686 908 -24% 1,194 736 62% 25,913 27,258 -5%Other operating liabilities 933 1,034 -10% 385 240 60% 13,320 11,750 13%Capital expenditure 95 56 70% 23 74 -69% 2,398 2,463 -3%Acquisitions 6 29 -79% -1 0 902 2,623 -66%
Research and development expenses 0 0 2 -32 106% 751 645 16%Employees (per capita on balance sheet date) 19,414 18,592 4% 1,255 1,238 1% 311,269 294,134 6%
Key figuresEBITDA margin 5.5% 9.3% 19.7% 3 20.1% 8
EBIT margin 1.4% 6.1% 12.7% 7 13.2% 8
Depreciation and amortization in % of sales 4.1% 3.2% 7.5% 6.9%Operating cash flow in % of sales 3.8% -0.8% 18.1% 12.0%ROOA 1.3% 7.0% 7.3% 9 7.6% 10
Fresenius GroupFresenius Vamed Corporate/Others
1 Before impairment of Goodwill at FMC Latin America2 Before transaction-related expenses, gain related to divestitures of Care Coordination activities and expenses associated with the cost optimization program3 Before revaluations of biosimilars contingent purchase price liabilities4 Before transaction-related expenses and revaluations of biosimilars contingent purchase price liabilities5 After revaluations of biosimilars contingent purchase price liabilities and impairment of Goodwill at FMC Latin America6 After transaction-related expenses, revaluations of biosimilars contingent purchase price liabilities, gain related to divestitures of Care Coordination activities and expenses associated with the cost optimization program at FMC7 Before revaluations of biosimilars contingent purchase price liabilities and impairment of Goodwill at FMC Latin America8 Before transaction-related expenses, revaluations of biosimilars contingent purchase price liabilities, gain related to divestitures of Care Coordination activities and expenses associated with the cost optimization program at FMC9 The underlying pro forma EBIT does not include revaluations of biosimilars contingent purchase price liabilities and impairment of Goodwill at FMC Latin America.10 The underlying pro forma EBIT does not include transaction-related expenses, revaluations of biosimilars contingent purchase price liabilities, gain related to divestitures of Care Coordination activities and expenses associated with the cost optimization program at FMC.
Page 28/30 Fresenius SE & Co. KGaA, Investor Relations & Sustainability, 61346 Bad Homburg
Sales by business segment
Group sales by region
€ in millions Q4/20 Q4/19
Growth at actual rates
Currency translation
effects
Growth at constant
ratesOrganic growth
Acquisitions/divestitures
% of total sales1
Fresenius Medical Care 4,400 4,580 -4% -8% 4% 1% 3% 47%Fresenius Kabi 1,815 1,766 3% -5% 8% 7% 1% 20%Fresenius Helios 2,637 2,344 13% 0% 13% 9% 4% 28%Fresenius Vamed 577 737 -22% 0% -22% -22% 0% 5%Total 9,304 9,311 0% -5% 5% 2% 3% 100%
€ in millions Q1-4/20 Q1-4/19
Growth at actual rates
Currency translation
effects
Growth at constant
ratesOrganic growth
Acquisitions/divestitures
% of total sales1
Fresenius Medical Care 17,859 17,477 2% -3% 5% 3% 2% 49%Fresenius Kabi 6,976 6,919 1% -3% 4% 4% 0% 19%Fresenius Helios 9,818 9,234 6% -1% 7% 4% 3% 27%Fresenius Vamed 2,068 2,206 -6% 0% -6% -8% 2% 5%Total 36,277 35,409 2% -3% 5% 3% 2% 100%
1 Related to the respective external sales of the business segments. Consolidation effects and corporate entities are not taken into account. Therefore, aggregation to total Group sales is not possible.
1 Related to the respective external sales of the business segments. Consolidation effects and corporate entities are not taken into account. Therefore, aggregation to total Group sales is not possible.
€ in millions Q4/20 Q4/19
Growth atactual rates
Currency translation
effects
Growth at constant
ratesOrganic growth
Acquisitions/divestitures
% of total sales
North America 3,518 3,763 -7% -12% 5% 3% 2% 38%Europe 4,205 3,927 7% -1% 8% 6% 2% 45%Asia-Pacific 1,058 1,064 -1% -4% 3% 3% 0% 12%Latin America 405 432 -6% 12% -18% -32% 14% 4%Africa 118 125 -6% -5% -1% -1% 0% 1%Total 9,304 9,311 0% -5% 5% 2% 3% 100%
€ in millions Q1-4/20 Q1-4/19
Growth atactual rates
Currency translation
effects
Growth at constant
ratesOrganic growth
Acquisitions/divestitures
% of total sales
North America 14,801 14,543 2% -3% 5% 3% 2% 41%Europe 15,813 15,178 4% -1% 5% 4% 1% 44%Asia-Pacific 3,705 3,732 -1% -2% 1% 1% 0% 10%Latin America 1,566 1,545 1% -13% 14% 1% 13% 4%Africa 392 411 -5% -6% 1% 1% 0% 1%Total 36,277 35,409 2% -3% 5% 3% 2% 100%

Page 29/30 Fresenius SE & Co. KGaA, Investor Relations & Sustainability, 61346 Bad Homburg
Statement of Financial Position Business Segments
Fresenius Medical Care
€ in millionsDecember
31, 2020December 31,
2019 ChangeAssetsTrade accounts receivables 3,153 3,421 -8%Inventories 1,895 1,663 14%Property, plant and equipment 4,057 4,190 -3%Goodwill and other intangible assets 14,340 15,444 -7%Right-of-use-assets 4,130 4,325 -5%Other assets 4,114 3,892 6%Total assets 31,689 32,935 -4%
LiabilitiesDebt 12,363 13,760 -10%thereof lease liabilities 4,492 4,705 -5%Other liabilities 6,995 5,948 18%Total shareholder's equity 12,331 13,227 -7%Total liabilities and shareholder's equity 31,689 32,935 -4%
Fresenius Kabi
€ in millionsDecember
31, 2020December 31,
2019 ChangeAssetsTrade accounts receivables 876 945 -7%Inventories 1,722 1,700 1%Property, plant and equipment 2,660 2,442 9%Goodwill and other intangible assets 6,221 6,648 -6%Right-of-use-assets 342 412 -17%Other assets 1,770 1,650 7%Total assets 13,591 13,797 -1%
LiabilitiesDebt 489 561 -13%thereof lease liabilities 366 431 -15%Other liabilities 7,080 7,188 -2%Total shareholder's equity 6,022 6,048 0%Total liabilities and shareholder's equity 13,591 13,797 -1%
Fresenius Helios
€ in millionsDecember
31, 2020December 31,
2019 ChangeAssetsTrade accounts receivables 2,507 2,411 4%Inventories 225 172 31%Property, plant and equipment 4,534 4,052 12%Goodwill and other intangible assets 9,421 9,159 3%Right-of-use-assets 909 966 -6%Other assets 1,645 1,404 17%Total assets 19,241 18,164 6%
LiabilitiesDebt 1,089 1,110 -2%thereof lease liabilities 1,008 1,041 -3%Other liabilities 9,448 8,907 6%Total shareholder's equity 8,704 8,147 7%Total liabilities and shareholder's equity 19,241 18,164 6%
Fresenius Vamed
€ in millionsDecember
31, 2020December 31,
2019 ChangeAssetsTrade accounts receivables 401 398 1%Inventories 80 84 -5%Property, plant and equipment 461 425 8%Goodwill and other intangible assets 322 322 0%Right-of-use-assets 442 368 20%Other assets 1,010 1,124 -10%Total assets 2,716 2,721 0%
LiabilitiesDebt 500 434 15%thereof lease liabilities 453 370 22%Other liabilities 1,162 1,558 -25%Total shareholder's equity 1,054 729 45%Total liabilities and shareholder's equity 2,716 2,721 0%

Page 30/30 Fresenius SE & Co. KGaA, Investor Relations & Sustainability, 61346 Bad Homburg
Statement of Cash Flows Business Segments
Fresenius Medical Care
€ in millions FY/20 FY/19 GrowthNet income 1,435 1,439 0%Depreciation and amortization 1,786 1,593 12%Change in working capital and others 1,012 -465 --Operating cash flow 4,233 2,567 65%in % of sales 23.7% 14.7%Capital expenditure, net -1,036 -1,113 7%Cash flow before acquisitions and dividends 3,197 1,454 120%Cash used for acquisitions, net -299 -2,173 86%Free cash flow after acquisitions and before dividends 2,898 -719 --
Fresenius Kabi
€ in millions FY/20 FY/19 GrowthNet income 748 862 -13%Depreciation and amortization 395 368 7%Change in working capital and others 0 -202 100%Operating cash flow 1,143 1,028 11%in % of sales 16.4% 14.9%Capital expenditure, net -693 -716 3%Cash flow before acquisitions and dividends 450 312 44%Cash used for acquisitions, net -13 -86 85%Free cash flow after acquisitions and before dividends 437 226 93%
Fresenius Helios
€ in millions FY/20 FY/19 GrowthNet income 674 676 0%Depreciation and amortization 445 414 7%Change in working capital and others 30 -357 108%Operating cash flow 1,149 733 57%in % of sales 11.7% 7.9%Capital expenditure, net -540 -477 -13%Cash flow before acquisitions and dividends 609 256 138%Cash used for acquisitions, net -328 -144 -128%Free cash flow after acquisitions and before dividends 281 112 151%
Fresenius Vamed
€ in millions FY/20 FY/19 GrowthNet income 5 85 -94%Depreciation and amortization 85 71 20%Change in working capital and others -12 -173 93%Operating cash flow 78 -17 --in % of sales 3.8% -0.8%Capital expenditure, net -76 -52 -46%Cash flow before acquisitions and dividends 2 -69 103%Cash used for acquisitions, net -6 -20 70%Free cash flow after acquisitions and before dividends -4 -89 96%