Investor Merrill Lynch Presentation Banking & Financial...
24
Confidential and proprietary ©2007 Discover Financial Services Investor Presentation ©2007 Discover Financial Services Merrill Lynch Banking & Financial Services Investor Conference November 13, 2007
Transcript of Investor Merrill Lynch Presentation Banking & Financial...
Confidential and proprietary
©2007 Discover Financial Services
Investor Presentation
©2007 Discover Financial Services
Merrill Lynch Banking & Financial Services Investor ConferenceNovember 13, 2007
2©2007 Discover Financial Services
Notice
The following slides are part of a presentation by Discover Financial Services (the "Company") and are intended to be viewed as part of that presentation. No representation is made that the information in these slides is complete. The presentation has been prepared solely for informational purposes, is neither an offer to sell nor the solicitation of an offer to buy any security or instrument.
The information provided herein may include certain non-GAAP financial measures. The reconciliations of such measures to the comparable GAAP figures are included in the Company’s Registration Statement on Form 10, as amended and the Company’s Form 10-Q for the 3rd Quarter 2007, each of which is on file with the SEC.
The presentation contains forward-looking statements. You are cautioned not to place undue reliance on forward-looking statements, which speak only as of the date on which they are made, which reflect management’s estimates, projections, expectations or beliefs at that time and which are subject to risks and uncertainties that may cause actual results to differ materially. For a discussion of certain risks and uncertainties that may affect the future results of the Company, please see "Special Note Regarding Forward-Looking Statements," "Risk Factors," "Business - Competition," "Business – Regulatory Matters" and "Management’s Discussion and Analysis of Financial Condition and Results of Operations" in the Company’s Information Statement that is included as part of its Registration Statement on Form 10, as amended, and the Company’s Form 10-Q for the 3rd Quarter 2007, each of which is on file with the SEC.
The historical financial information prior to the Company’s spin-off from Morgan Stanley included in the presentation has been derived from Morgan Stanley’s consolidated financial statements and does not necessarily reflect what our financial condition, results of operations or cash flows would have been had we operated as a separate, stand-alone company during such periods presented.
3©2007 Discover Financial Services
David W. NelmsCHIEF EXECUTIVE OFFICER
Today’s Agenda
• Business Overview and Results
• Segment Review
• Capital Management
• Conclusion
4©2007 Discover Financial Services
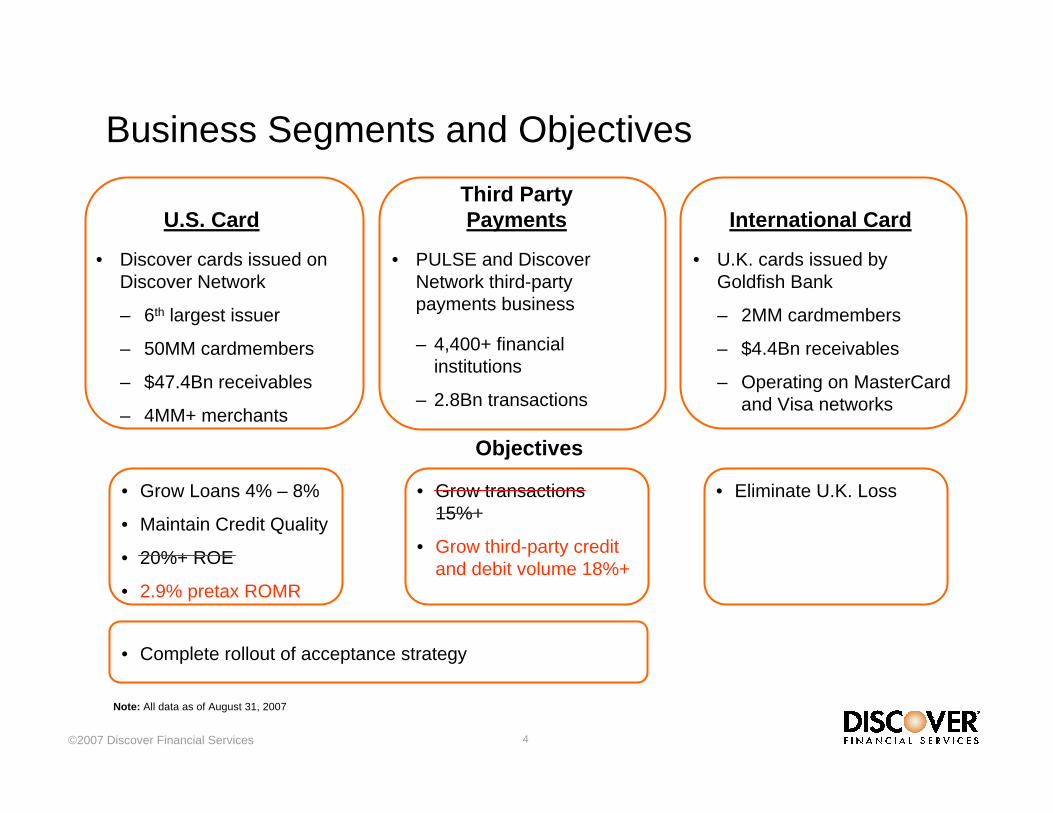
• U.K. cards issued by Goldfish Bank
– 2MM cardmembers
– $4.4Bn receivables
– Operating on MasterCard and Visa networks
• PULSE and Discover Network third-party payments business
– 4,400+ financial institutions
– 2.8Bn transactions
• Discover cards issued on Discover Network
– 6th largest issuer
– 50MM cardmembers
– $47.4Bn receivables
– 4MM+ merchants
International CardThird PartyPaymentsU.S. Card
Business Segments and Objectives
• Grow transactions 15%+
• Grow third-party credit and debit volume 18%+
• Eliminate U.K. Loss• Grow Loans 4% – 8%
• Maintain Credit Quality
• 20%+ ROE
• 2.9% pretax ROMR
Objectives
• Complete rollout of acceptance strategy
Note: All data as of August 31, 2007
5©2007 Discover Financial Services
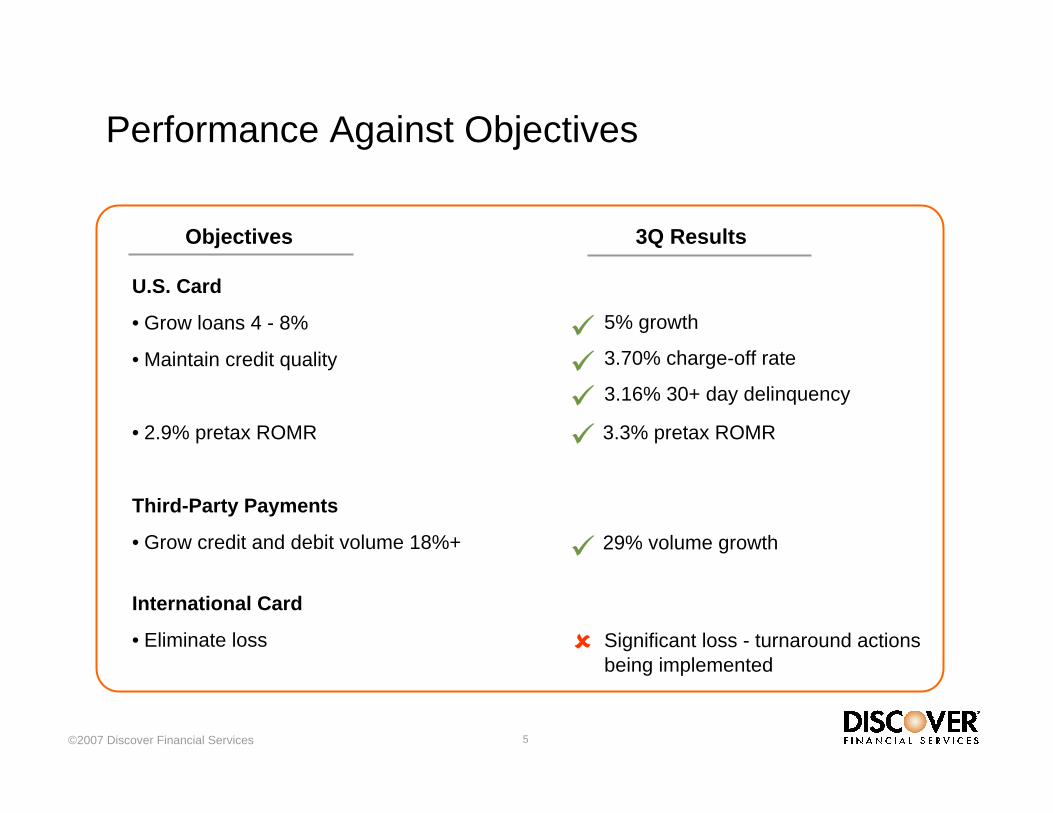
Performance Against Objectives
Objectives
U.S. Card
• Grow loans 4 - 8%
• Maintain credit quality
• 2.9% pretax ROMR
Third-Party Payments
• Grow credit and debit volume 18%+
International Card
• Eliminate loss
5% growth
3.70% charge-off rate
3.16% 30+ day delinquency
3Q Results
29% volume growth
3.3% pretax ROMR
Significant loss - turnaround actions being implemented
6©2007 Discover Financial Services
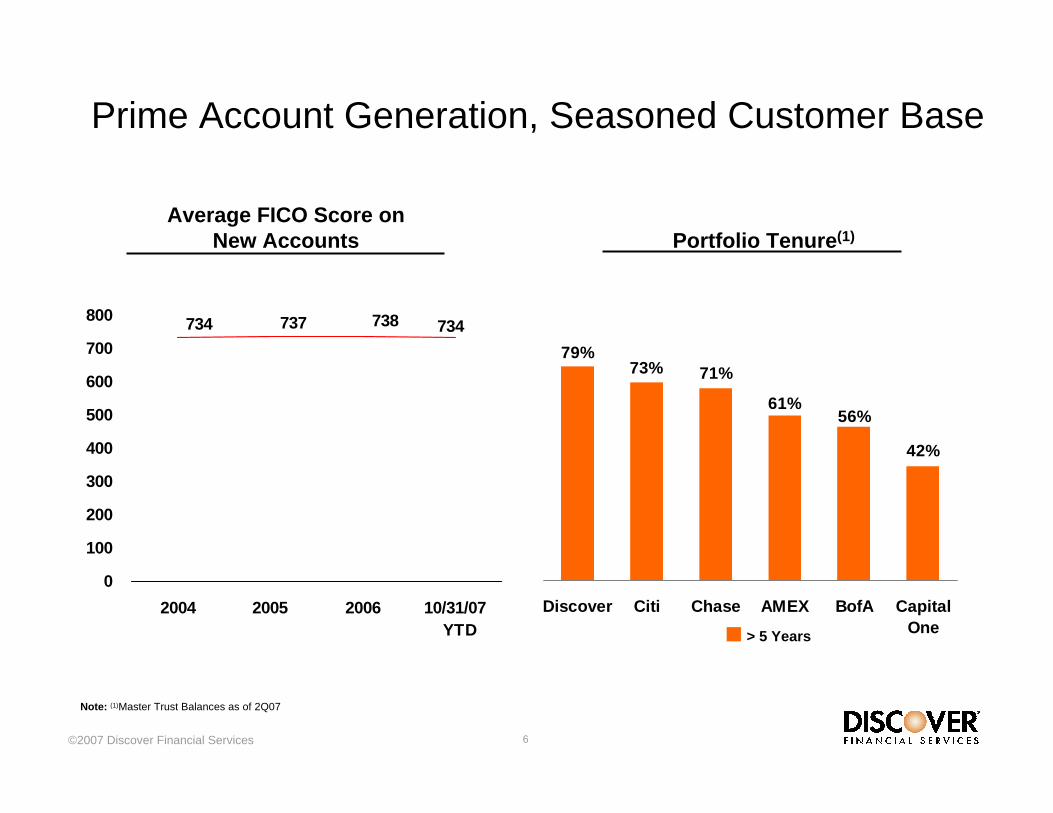
Prime Account Generation, Seasoned Customer Base
79%73% 71%
61%56%
42%
Discover Citi Chase AMEX BofA CapitalOne
Note: (1)Master Trust Balances as of 2Q07
> 5 Years
Average FICO Score on New Accounts Portfolio Tenure(1)
734738737734
0
100
200
300
400
500
600
700
800
2004 2005 2006 10/31/07 YTD
7©2007 Discover Financial Services
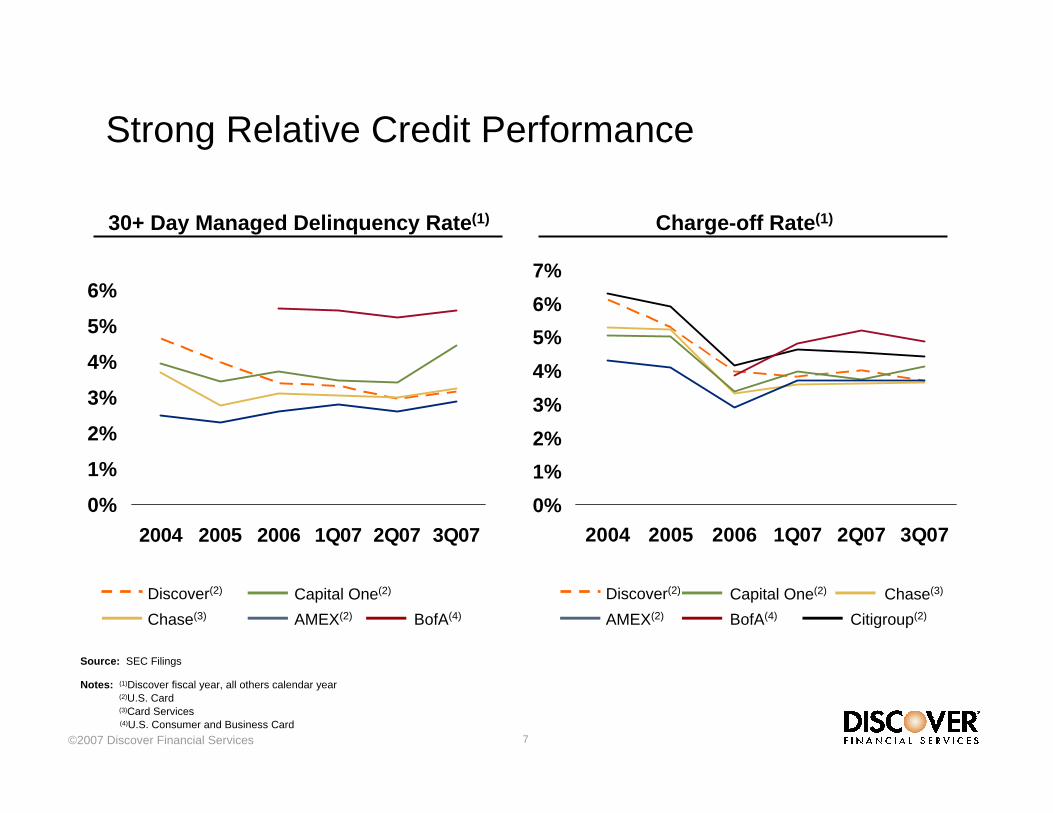
30+ Day Managed Delinquency Rate(1)
0%
1%
2%
3%
4%
5%
6%
2004 2005 2006 1Q07 2Q07 3Q07
Strong Relative Credit Performance
Charge-off Rate(1)
0%1%2%3%4%5%6%7%
2004 2005 2006 1Q07 2Q07 3Q07
Discover(2) Chase(3)Capital One(2)
AMEX(2) BofA(4) Citigroup(2)
Discover(2)
Chase(3)
Capital One(2)
AMEX(2) BofA(4)
Notes: (1)Discover fiscal year, all others calendar year(2)U.S. Card(3)Card Services(4)U.S. Consumer and Business Card
Source: SEC Filings

8©2007 Discover Financial Services
• Rising unemployment
• Regional weakness in housing
• Slower retail sales growth
• Higher energy prices
U.S. Credit Outlook
Fiscal 2008 Outlook
• Higher fee income
• Higher yield
• Lower funding costs
• Lower expense ratio
Offsets
• Estimated full year Discover Card charge-off rate of 4.25% – 4.75%
9©2007 Discover Financial Services
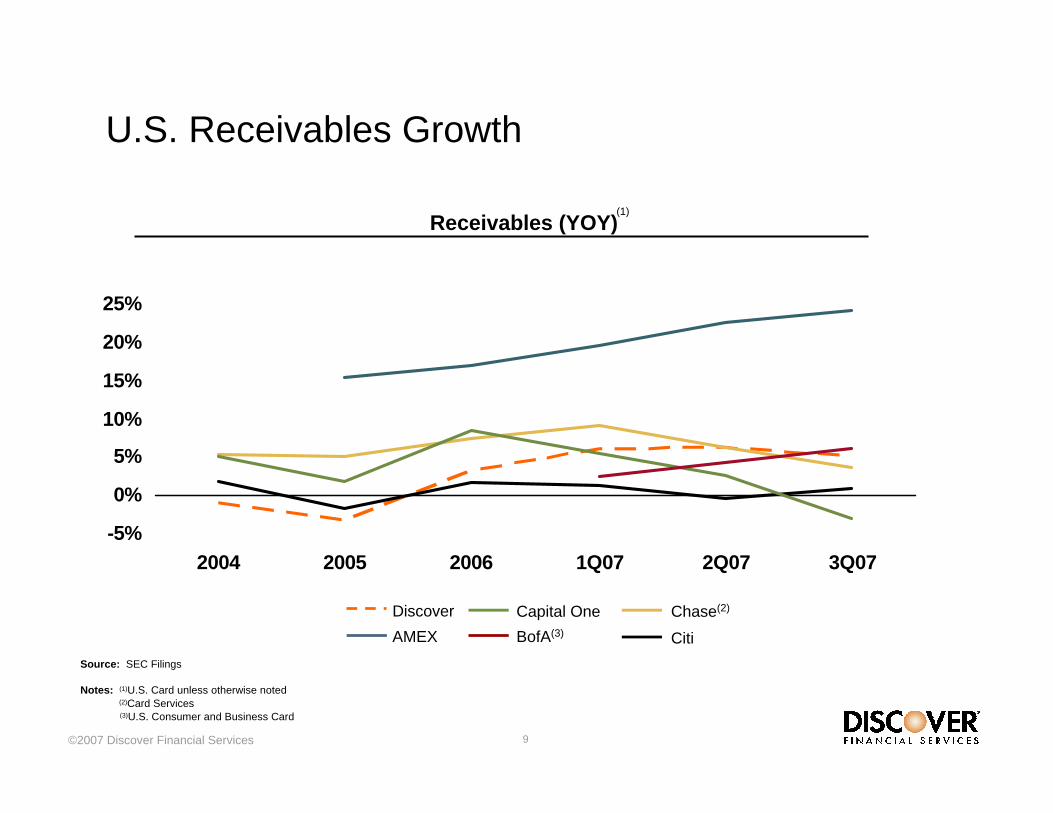
U.S. Receivables Growth
-5%
0%
5%
10%
15%
20%
25%
2004 2005 2006 1Q07 2Q07 3Q07
Discover Chase(2)Capital OneAMEX BofA(3) Citi
Notes: (1)U.S. Card unless otherwise noted(2)Card Services(3)U.S. Consumer and Business Card
Receivables (YOY)(1)
Source: SEC Filings
10©2007 Discover Financial Services
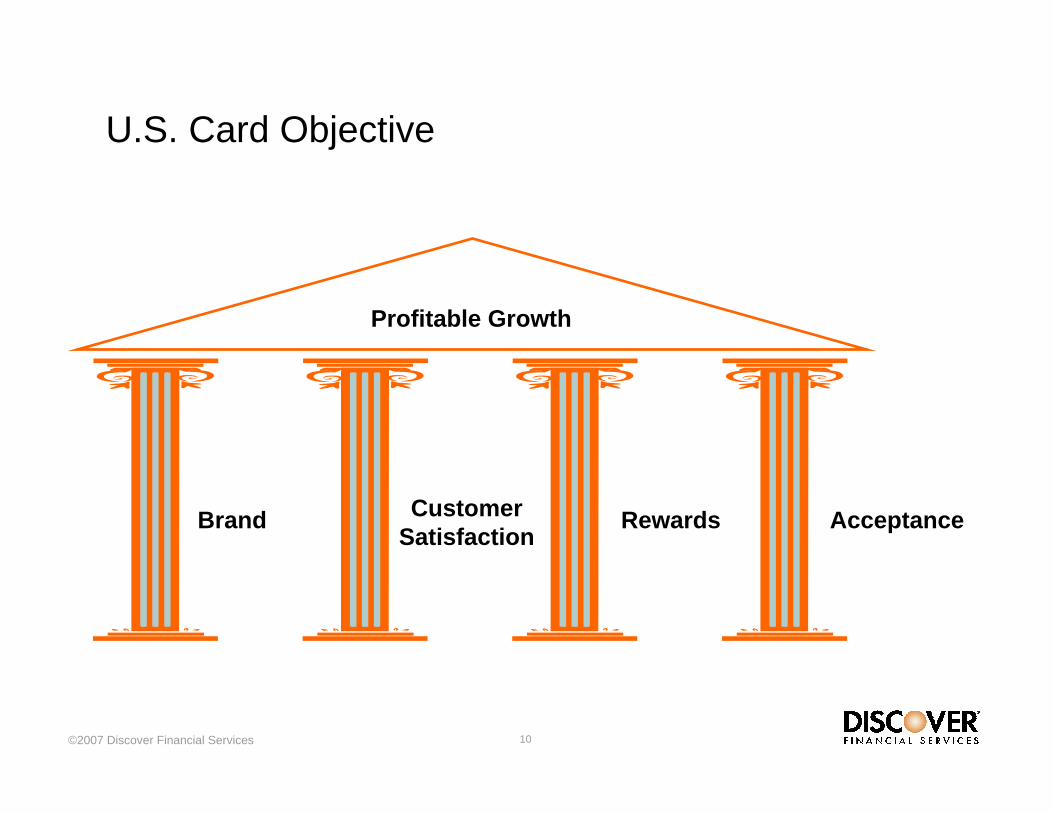
U.S. Card Objective
Brand Customer Satisfaction
Rewards Acceptance
Profitable Growth
11©2007 Discover Financial Services
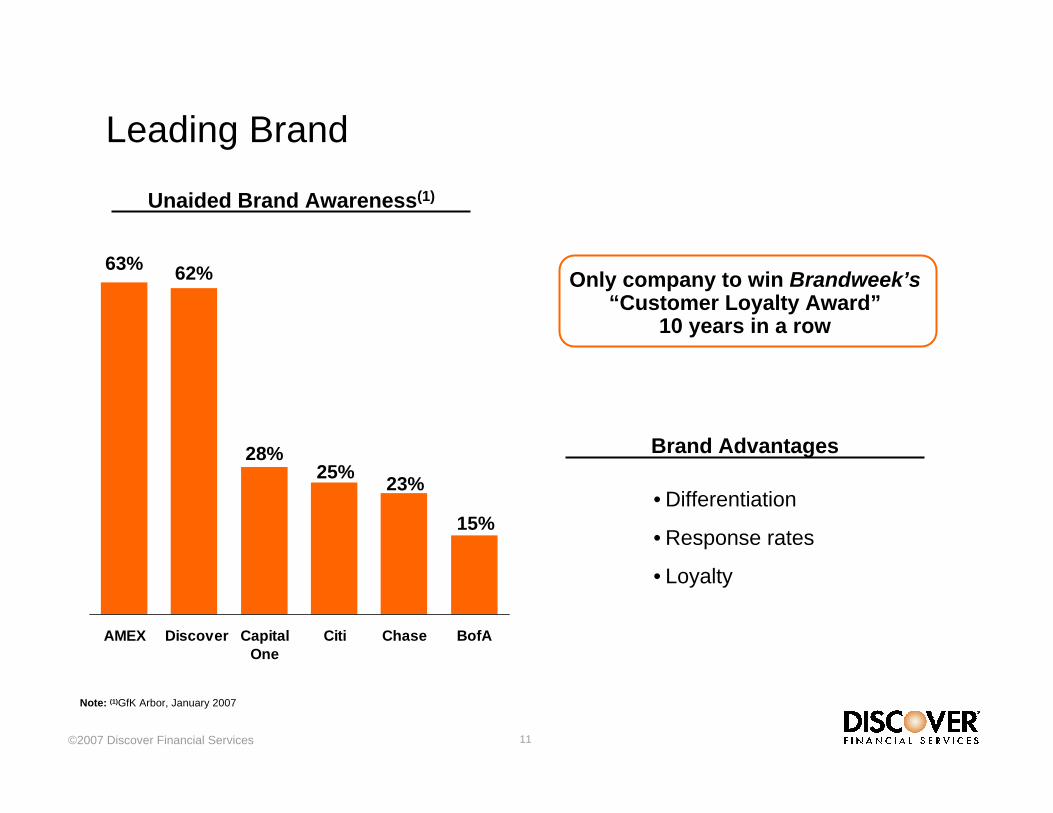
Unaided Brand Awareness(1)
Leading Brand
15%
23%
63% 62%
25%28%
AMEX Discover CapitalOne
Citi Chase BofA
Note: (1)GfK Arbor, January 2007
Brand Advantages
• Differentiation
• Response rates
• Loyalty
Only company to win Brandweek’s“Customer Loyalty Award”
10 years in a row
12©2007 Discover Financial Services
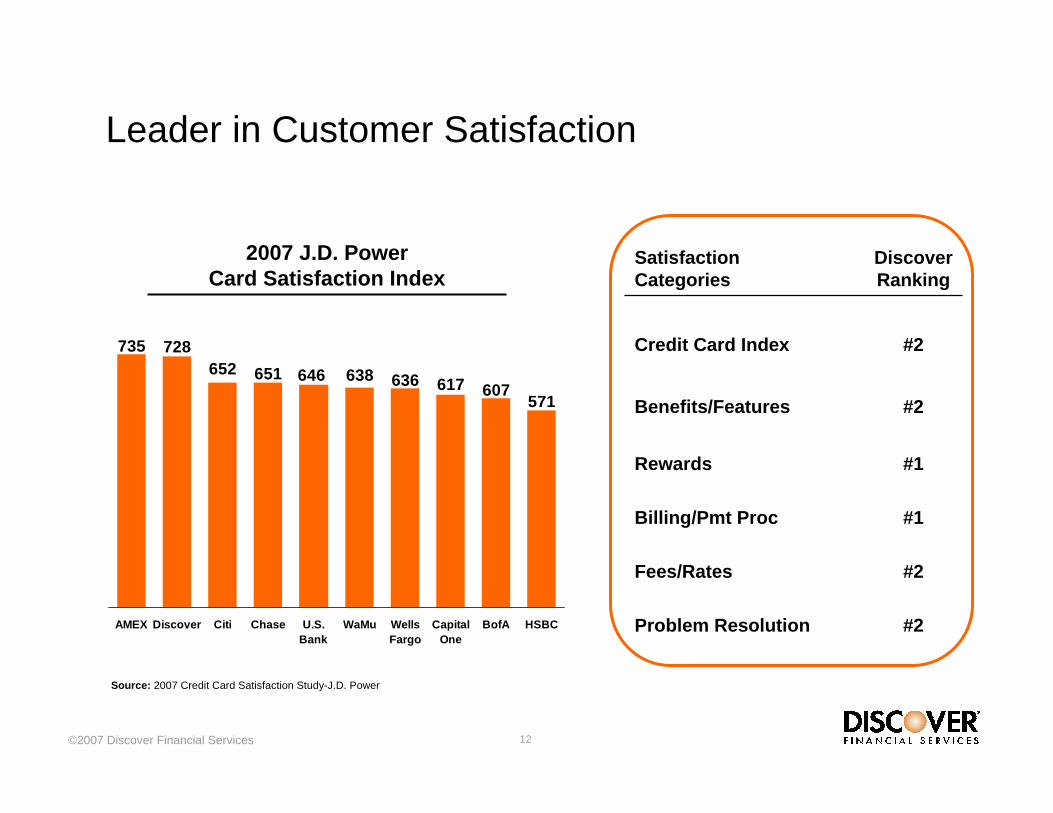
2007 J.D. Power Card Satisfaction Index
Leader in Customer Satisfaction
571607617636638646651652
728735
AMEX Discover Citi Chase U.S.Bank
WaMu WellsFargo
CapitalOne
BofA HSBC
DiscoverRanking
SatisfactionCategories
#2Problem Resolution
#2Fees/Rates
#1Billing/Pmt Proc
#1Rewards
#2Benefits/Features
#2Credit Card Index
Source: 2007 Credit Card Satisfaction Study-J.D. Power
13©2007 Discover Financial Services
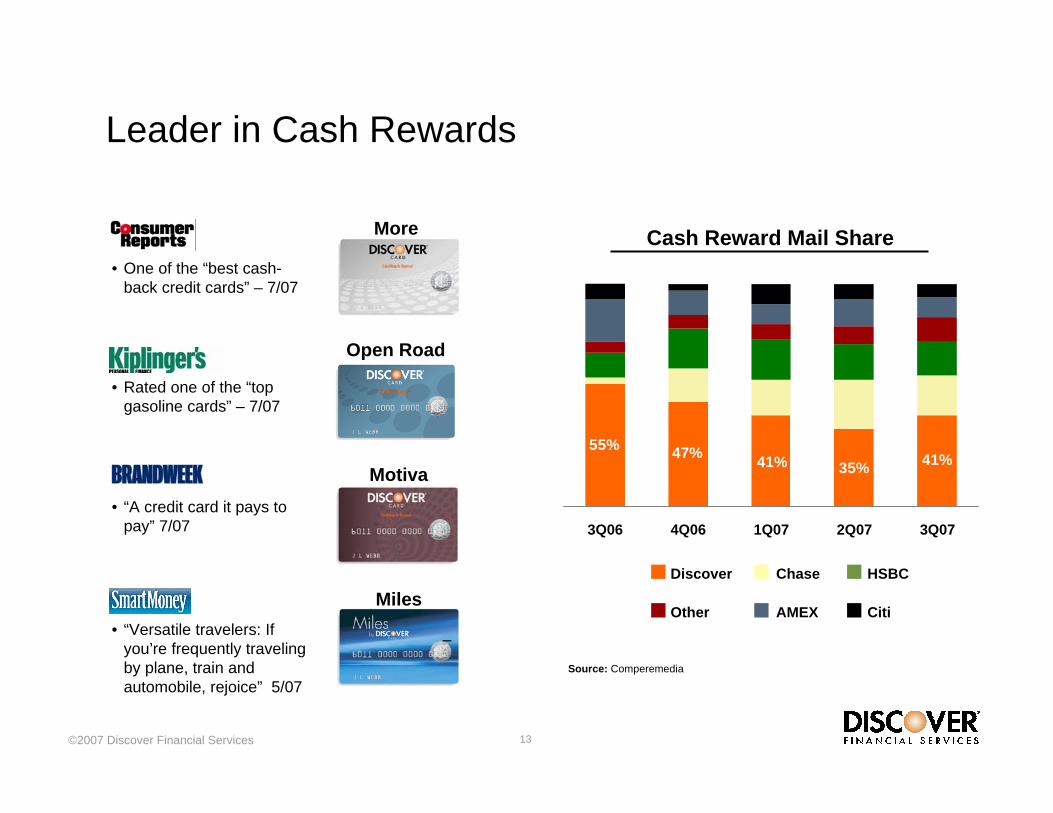
Leader in Cash Rewards
• One of the “best cash-back credit cards” – 7/07
• Rated one of the “top gasoline cards” – 7/07
• “A credit card it pays to pay” 7/07
• “Versatile travelers: If you’re frequently traveling by plane, train and automobile, rejoice” 5/07
More
Open Road
Motiva
Miles
35% 41%55% 47% 41%
3Q06 4Q06 1Q07 2Q07 3Q07
Source: Comperemedia
Cash Reward Mail Share
AMEX
HSBCChaseDiscover
CitiOther
–
14©2007 Discover Financial Services
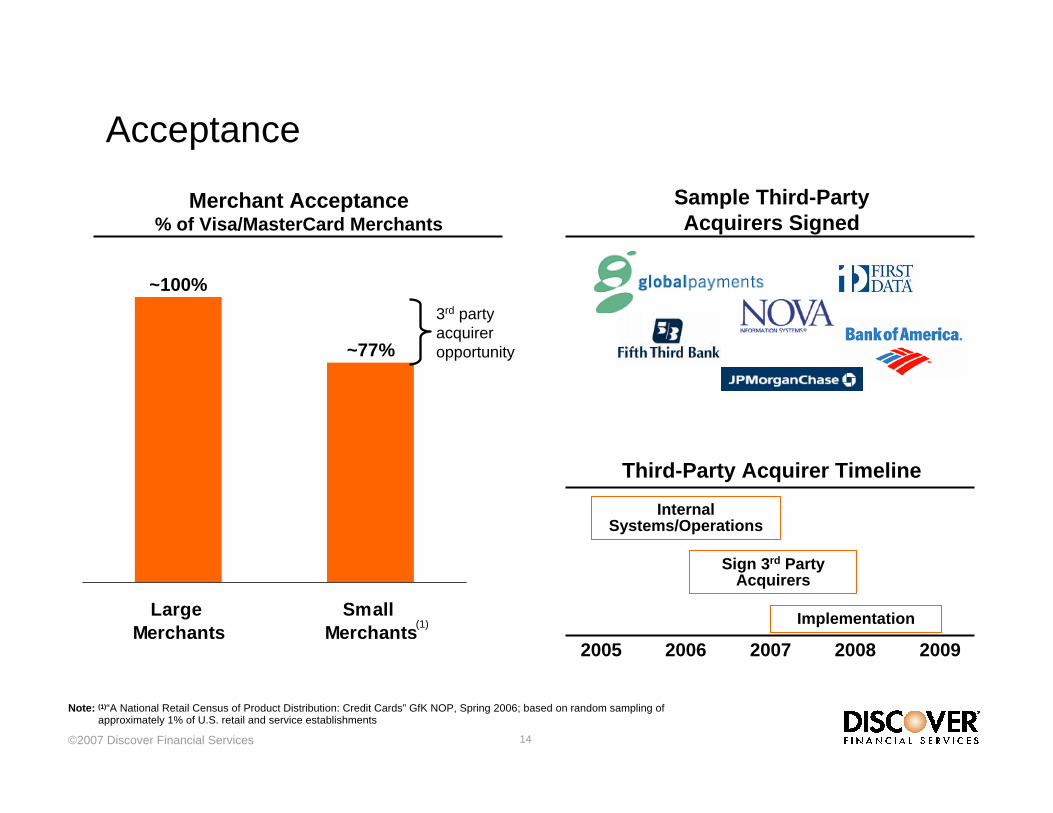
~100%
Large Merchants
Small Merchants
Merchant Acceptance % of Visa/MasterCard Merchants
Acceptance
Note: (1)“A National Retail Census of Product Distribution: Credit Cards” GfK NOP, Spring 2006; based on random sampling ofapproximately 1% of U.S. retail and service establishments
(1)
~77%
3rd party acquirer opportunity
Sample Third-Party Acquirers Signed
Third-Party Acquirer Timeline
2005 2009
Internal Systems/Operations
Sign 3rd Party Acquirers
2006 2007 2008
Implementation
15©2007 Discover Financial Services
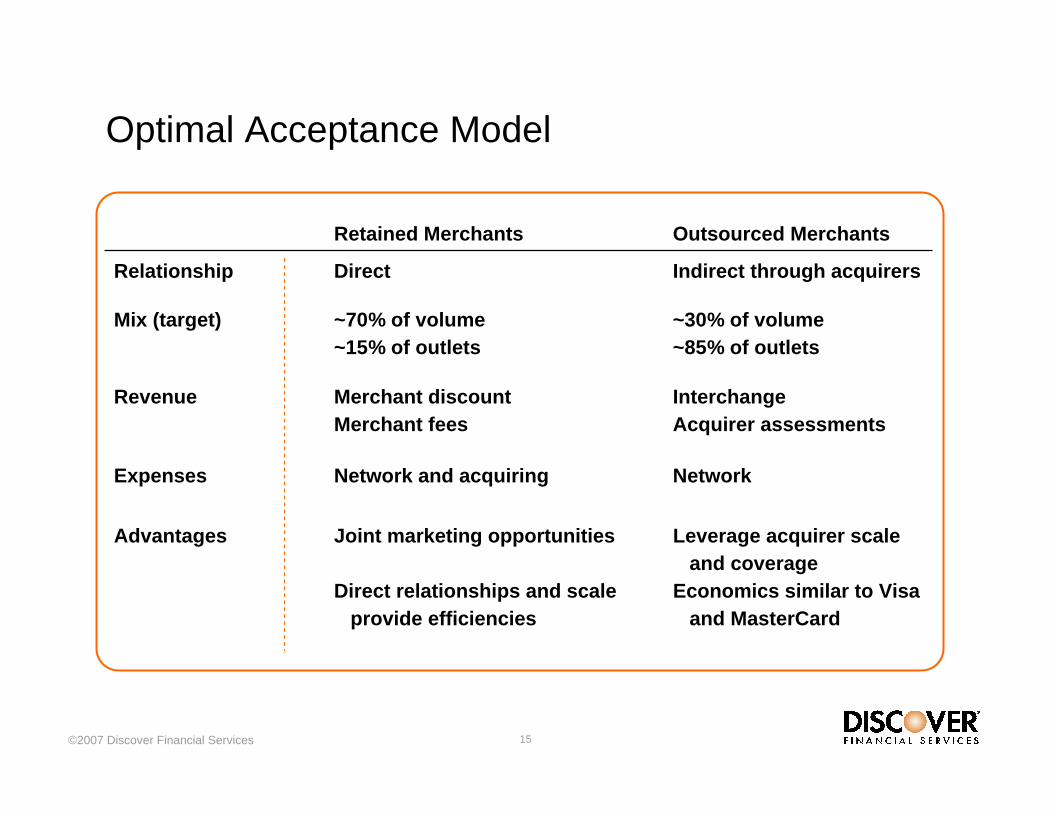
Optimal Acceptance Model
Leverage acquirer scaleand coverage
Economics similar to Visa and MasterCard
Network
Interchange Acquirer assessments
~30% of volume~85% of outlets
Indirect through acquirers
Outsourced MerchantsRetained Merchants
Joint marketing opportunities
Direct relationships and scale provide efficiencies
Advantages
Network and acquiringExpenses
Merchant discount Merchant fees
Revenue
~70% of volume~15% of outlets
Mix (target)
DirectRelationship
16©2007 Discover Financial Services
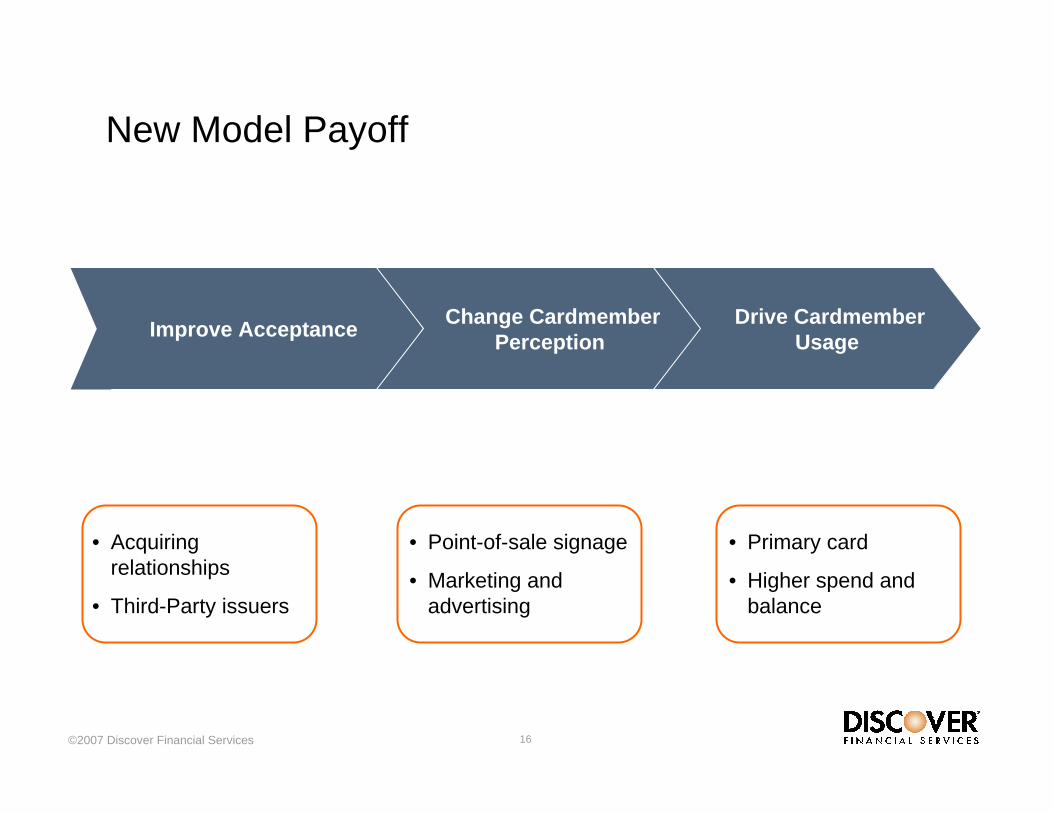
New Model Payoff
Improve Acceptance Change Cardmember Perception
Drive CardmemberUsage
• Point-of-sale signage
• Marketing and advertising
• Primary card
• Higher spend and balance
• Acquiring relationships
• Third-Party issuers
17©2007 Discover Financial Services
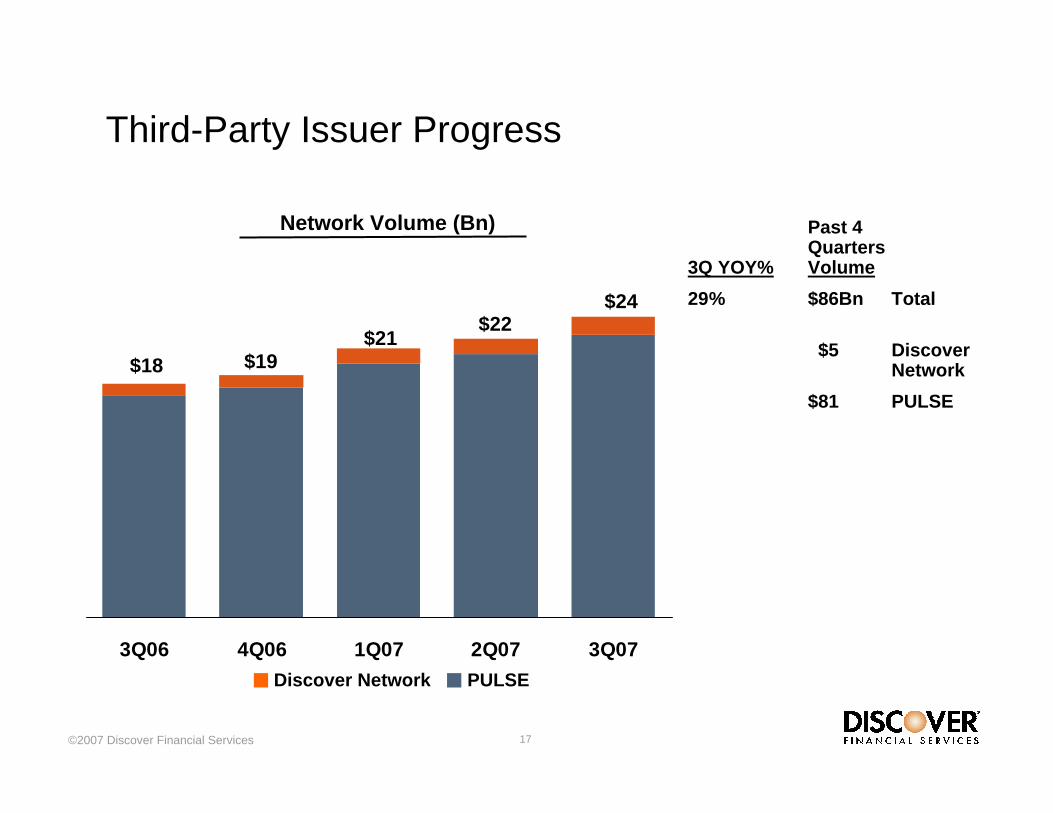
3Q06 4Q06 1Q07 2Q07 3Q07
Third-Party Issuer Progress
Discover Network PULSE
Network Volume (Bn)
$24$22
$19$21
$18
Past 4 Quarters
3Q YOY% Volume 29% $86Bn Total
$5 DiscoverNetwork
$81 PULSE
18©2007 Discover Financial Services
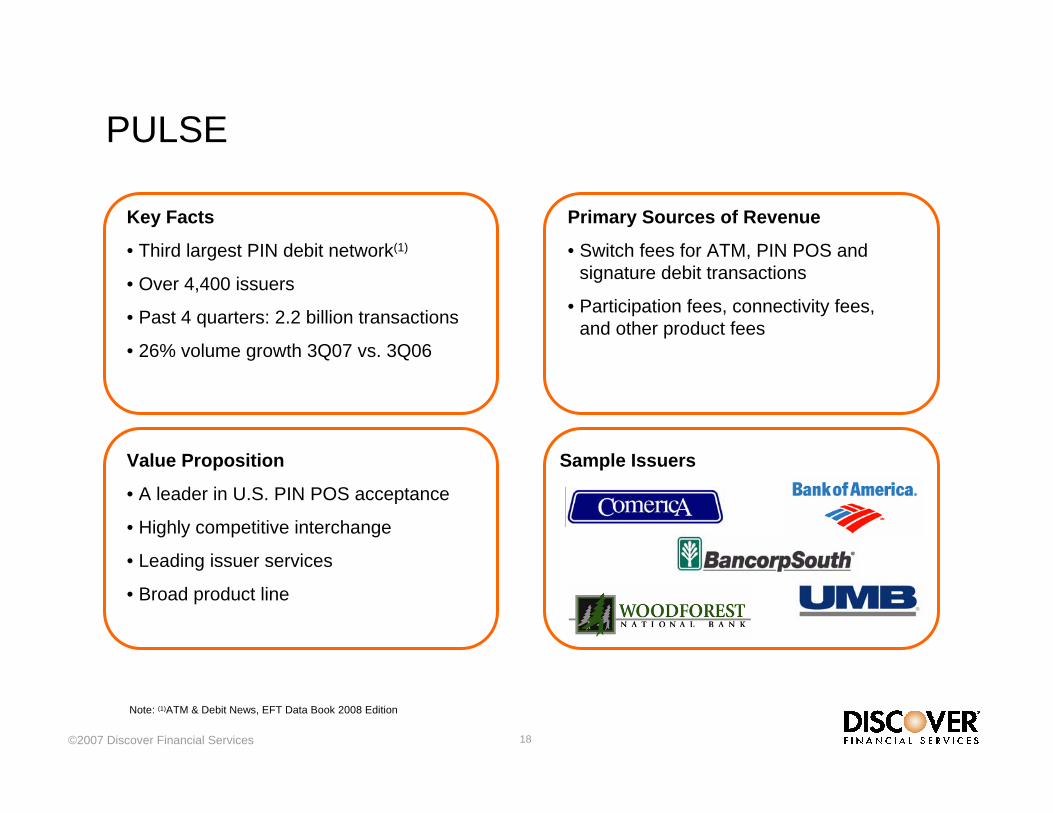
PULSE
Primary Sources of Revenue
• Switch fees for ATM, PIN POS and signature debit transactions
• Participation fees, connectivity fees, and other product fees
Sample Issuers
Key Facts
• Third largest PIN debit network(1)
• Over 4,400 issuers
• Past 4 quarters: 2.2 billion transactions
• 26% volume growth 3Q07 vs. 3Q06
Value Proposition
• A leader in U.S. PIN POS acceptance
• Highly competitive interchange
• Leading issuer services
• Broad product line
Note: (1)ATM & Debit News, EFT Data Book 2008 Edition
19©2007 Discover Financial Services
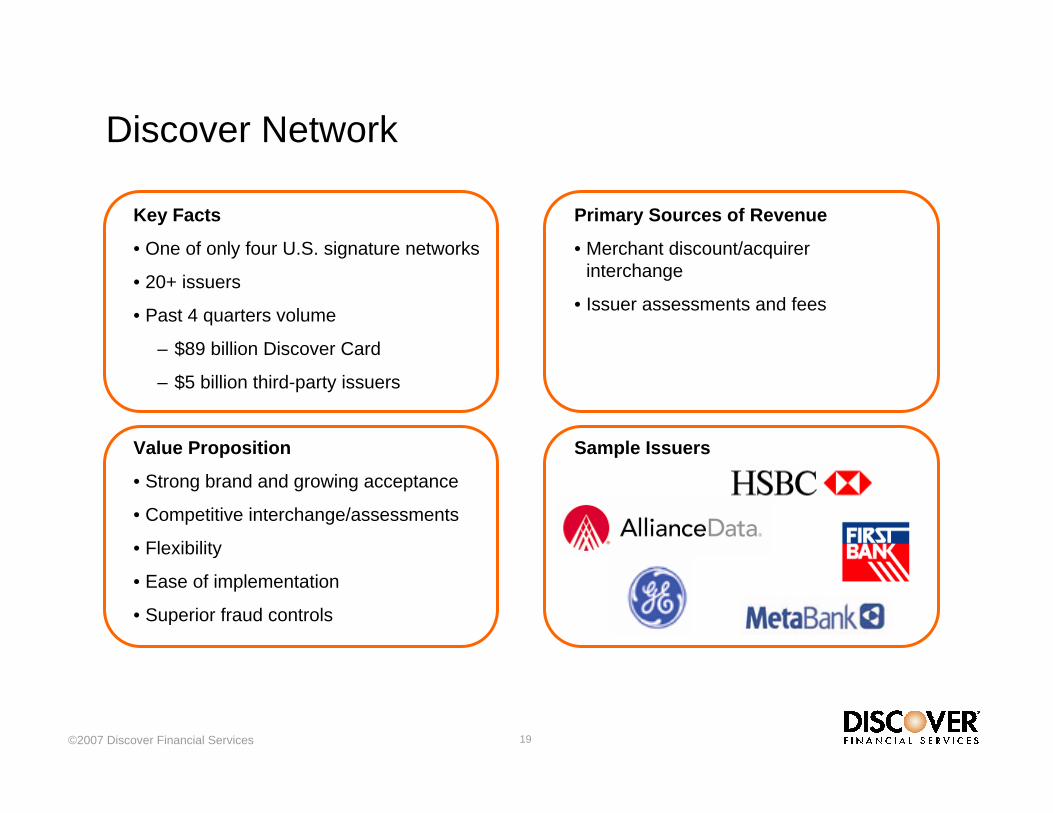
Discover Network
Primary Sources of Revenue
• Merchant discount/acquirer interchange
• Issuer assessments and fees
Sample Issuers
Key Facts
• One of only four U.S. signature networks
• 20+ issuers
• Past 4 quarters volume
– $89 billion Discover Card
– $5 billion third-party issuers
Value Proposition
• Strong brand and growing acceptance
• Competitive interchange/assessments
• Flexibility
• Ease of implementation
• Superior fraud controls
20©2007 Discover Financial Services
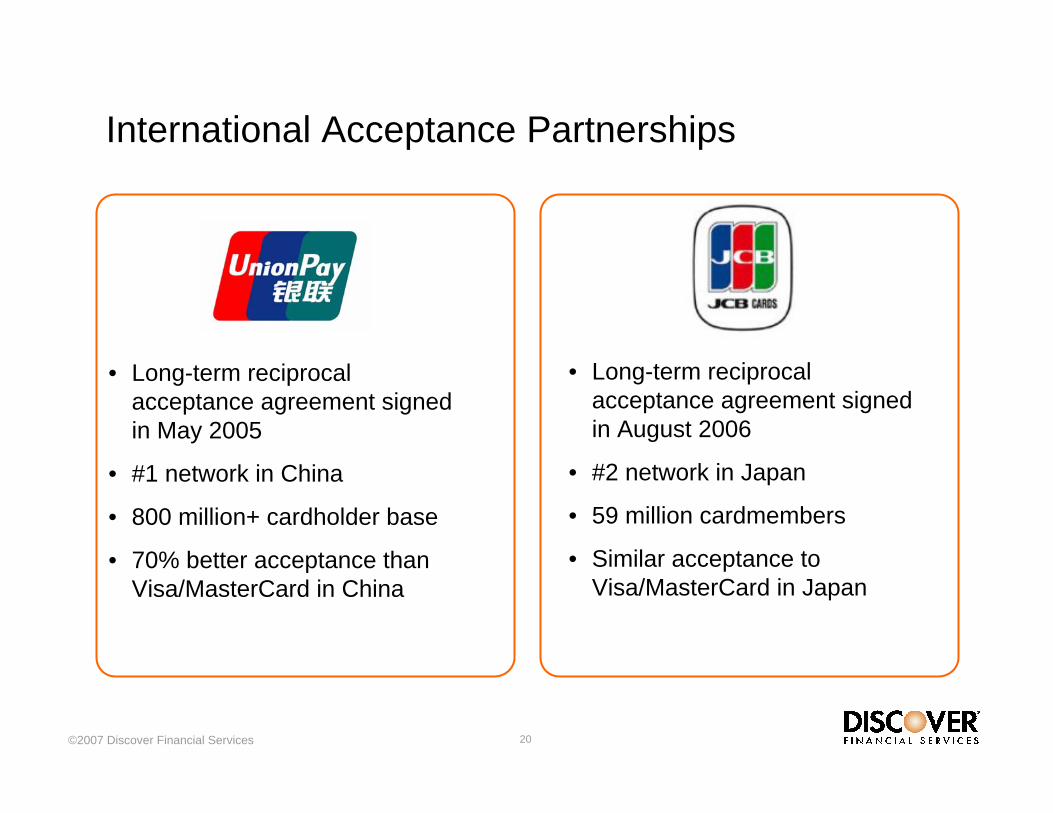
International Acceptance Partnerships
• Long-term reciprocal acceptance agreement signed in May 2005
• #1 network in China
• 800 million+ cardholder base
• 70% better acceptance than Visa/MasterCard in China
• Long-term reciprocal acceptance agreement signed in August 2006
• #2 network in Japan
• 59 million cardmembers
• Similar acceptance to Visa/MasterCard in Japan
21©2007 Discover Financial Services
2008 UK Outlook
Expect significantly lower loss in 2008
• Removal of one-time charges
• Stabilizing risk environment
• Fee and interest income opportunities
• Expense and rewards savings opportunities
• Business mix shift / shrinking portfolio
22©2007 Discover Financial Services
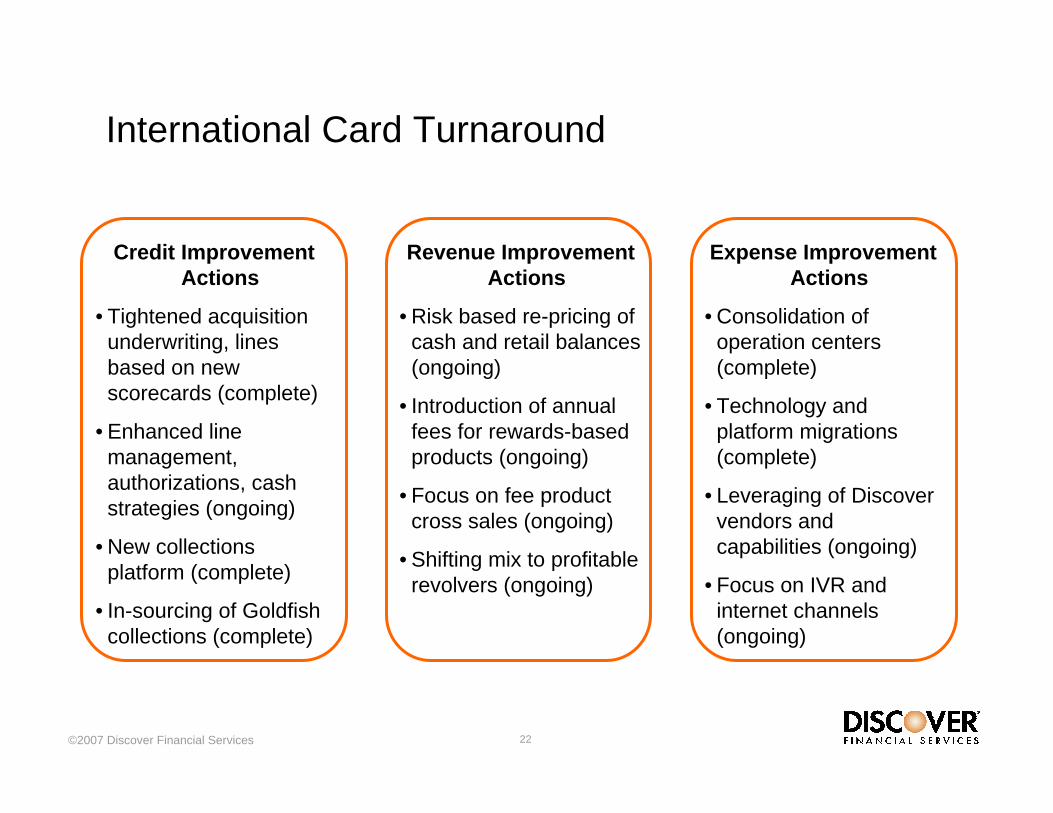
International Card Turnaround
Credit Improvement Actions
• Tightened acquisition underwriting, lines based on new scorecards (complete)
• Enhanced line management, authorizations, cash strategies (ongoing)
• New collections platform (complete)
• In-sourcing of Goldfish collections (complete)
Revenue Improvement Actions
• Risk based re-pricing of cash and retail balances (ongoing)
• Introduction of annual fees for rewards-based products (ongoing)
• Focus on fee product cross sales (ongoing)
• Shifting mix to profitable revolvers (ongoing)
Expense Improvement Actions
• Consolidation of operation centers (complete)
• Technology and platform migrations (complete)
• Leveraging of Discover vendors and capabilities (ongoing)
• Focus on IVR and internet channels (ongoing)
23©2007 Discover Financial Services
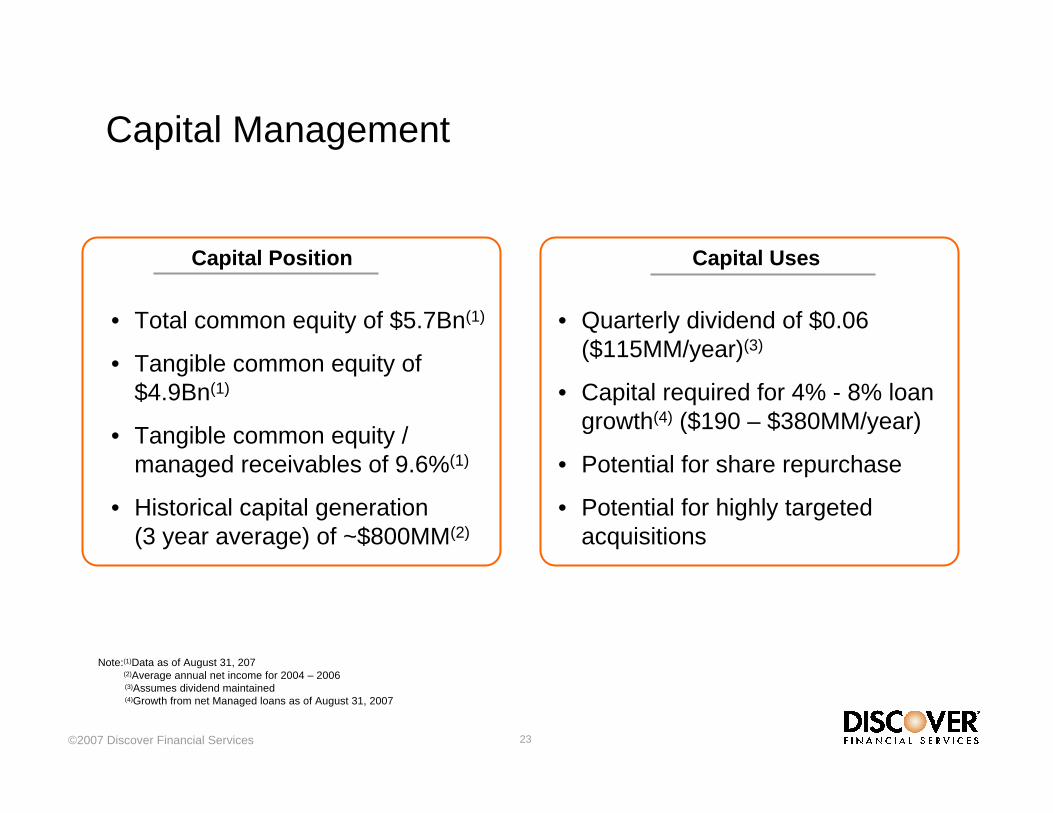
Capital Management
• Quarterly dividend of $0.06 ($115MM/year)(3)
• Capital required for 4% - 8% loan growth(4) ($190 – $380MM/year)
• Potential for share repurchase
• Potential for highly targeted acquisitions
• Total common equity of $5.7Bn(1)
• Tangible common equity of $4.9Bn(1)
• Tangible common equity /managed receivables of 9.6%(1)
• Historical capital generation (3 year average) of ~$800MM(2)
Capital Position Capital Uses
Note:(1)Data as of August 31, 207(2)Average annual net income for 2004 – 2006(3)Assumes dividend maintained(4)Growth from net Managed loans as of August 31, 2007
24©2007 Discover Financial Services
Conclusion – Opportunity to Create Value
• U.S. Card – Strong profits and well-positioned for continued controlled growth
• Payments – Unique assets, rapidly growing
• International Card – Significant upside from turnaround
• Strong capital generation