Investor Meeting Presentation · Asia Pacific Property Awards 2016 • Principal Garden BCA...
32
Investor Meeting Presentation August/September 2016
Transcript of Investor Meeting Presentation · Asia Pacific Property Awards 2016 • Principal Garden BCA...

Investor Meeting PresentationAugust/September 2016
2
• COMPANY OVERVIEW
• 1H2016 RESULTS OVERVIEW
• OPERATION HIGHLIGHTS
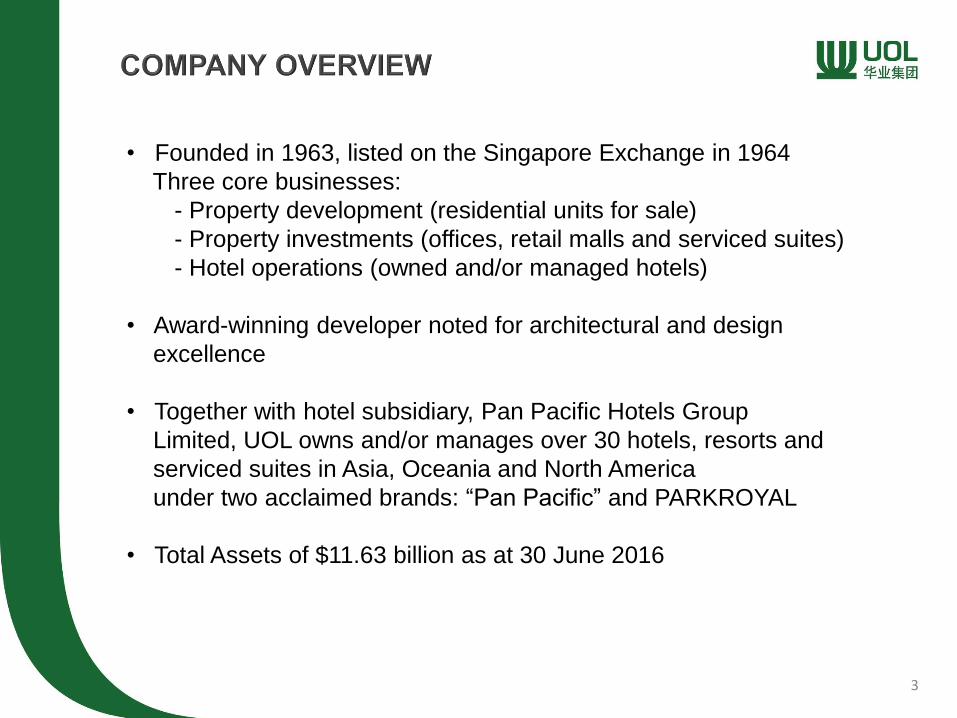
• Founded in 1963, listed on the Singapore Exchange in 1964
Three core businesses:
- Property development (residential units for sale)
- Property investments (offices, retail malls and serviced suites)
- Hotel operations (owned and/or managed hotels)
• Award-winning developer noted for architectural and design
excellence
• Together with hotel subsidiary, Pan Pacific Hotels Group
Limited, UOL owns and/or manages over 30 hotels, resorts and
serviced suites in Asia, Oceania and North America
under two acclaimed brands: “Pan Pacific” and PARKROYAL
• Total Assets of $11.63 billion as at 30 June 2016
3

Stable Management
Team
Nimble & Focused on Strategic Fit
Proven Track Record
Design & Quality
Excellence
Well Diversified Portfolio
Strong Capital
Position
4

5
UOL GROUP
LIMITED
Property
Development
Property
Investments
Hotel
Operations
Investments
Management
Services
*Listed company
Wholly-owned projects
Joint-venture projects
*UNITED INDUSTRIAL CORPORATION LIMITED (44%)
MARINA CENTRE HOLDINGS PTE LTD (23%)
Residential Developments
Wholly-owned properties
Joint-venture property
Commercial Properties/Serviced Suites
Joint-venture hotels
AQUAMARINA HOTEL PRIVATE LIMITED (25%)
Wholly-owned hotels
Hotel Investments
Investments in Securities
Facilities Management
Project Management
Hotel and Other Management

Singapore, Malaysia, Thailand, Indonesia, Philippines, Vietnam,
Myanmar, Australia, China, Bangladesh, UK, USA & Canada
Operates in 13 countries around the world
6
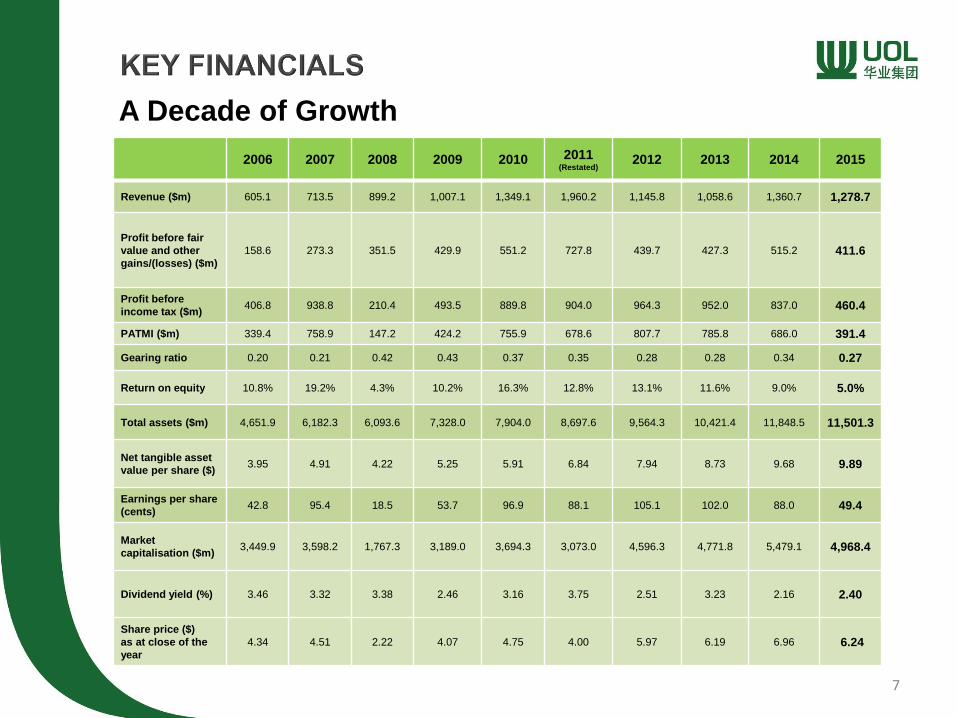
A Decade of Growth
2006 2007 2008 2009 2010 2011(Restated)
2012 2013 2014 2015
Revenue ($m) 605.1 713.5 899.2 1,007.1 1,349.1 1,960.2 1,145.8 1,058.6 1,360.7 1,278.7
Profit before fair
value and other
gains/(losses) ($m)
158.6 273.3 351.5 429.9 551.2 727.8 439.7 427.3 515.2 411.6
Profit before
income tax ($m)406.8 938.8 210.4 493.5 889.8 904.0 964.3 952.0 837.0 460.4
PATMI ($m) 339.4 758.9 147.2 424.2 755.9 678.6 807.7 785.8 686.0 391.4
Gearing ratio 0.20 0.21 0.42 0.43 0.37 0.35 0.28 0.28 0.34 0.27
Return on equity 10.8% 19.2% 4.3% 10.2% 16.3% 12.8% 13.1% 11.6% 9.0% 5.0%
Total assets ($m) 4,651.9 6,182.3 6,093.6 7,328.0 7,904.0 8,697.6 9,564.3 10,421.4 11,848.5 11,501.3
Net tangible asset
value per share ($)3.95 4.91 4.22 5.25 5.91 6.84 7.94 8.73 9.68 9.89
Earnings per share
(cents)42.8 95.4 18.5 53.7 96.9 88.1 105.1 102.0 88.0 49.4
Market
capitalisation ($m)3,449.9 3,598.2 1,767.3 3,189.0 3,694.3 3,073.0 4,596.3 4,771.8 5,479.1 4,968.4
Dividend yield (%) 3.46 3.32 3.38 2.46 3.16 3.75 2.51 3.23 2.16 2.40
Share price ($)
as at close of the
year
4.34 4.51 2.22 4.07 4.75 4.00 5.97 6.19 6.96 6.24
7

20.6
59.1
11.6
8.4 0.3
Total Assets** (%)
Property development Property investments Hotel operations Investments Others
17.2
62.7
12.7
7.00.4
Total Assets** (%)(as at 31 Dec 2015)
15.6
51.7
21.9
7.92.9
Adjusted EBITDA* (%)(FY2015)
Contribution by Business Segments
*Excludes unallocated costs, other gains/losses and
fair value gains on investment properties**Excludes unallocated assets
8
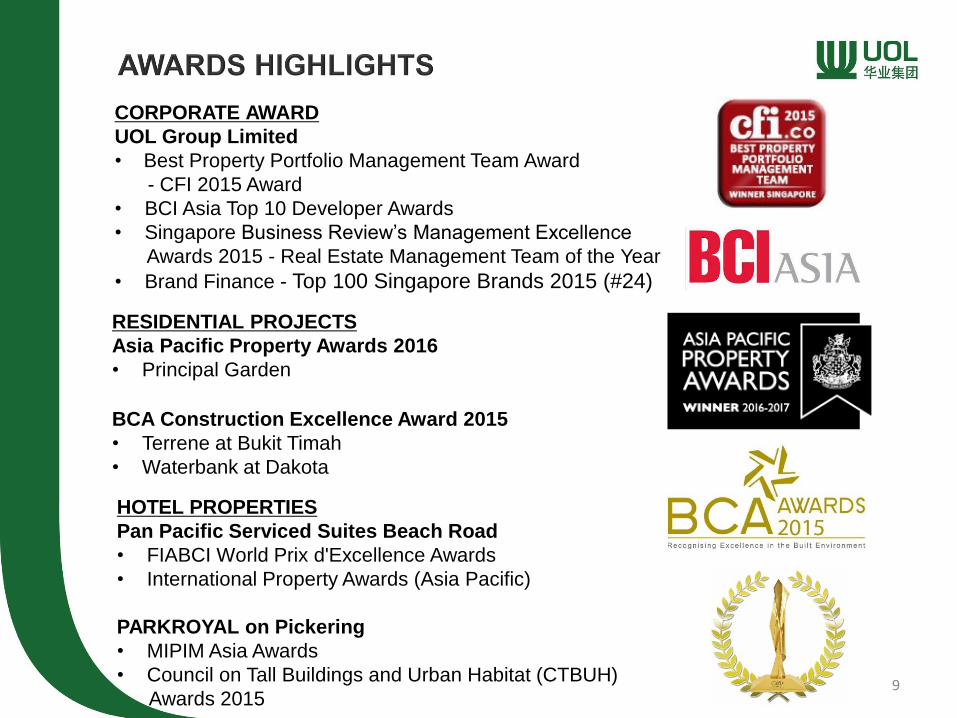
RESIDENTIAL PROJECTS
Asia Pacific Property Awards 2016
• Principal Garden
BCA Construction Excellence Award 2015
• Terrene at Bukit Timah
• Waterbank at Dakota
CORPORATE AWARD
UOL Group Limited
• Best Property Portfolio Management Team Award
- CFI 2015 Award
• BCI Asia Top 10 Developer Awards
• Singapore Business Review’s Management Excellence
Awards 2015 - Real Estate Management Team of the Year
• Brand Finance - Top 100 Singapore Brands 2015 (#24)
HOTEL PROPERTIES
Pan Pacific Serviced Suites Beach Road
• FIABCI World Prix d'Excellence Awards
• International Property Awards (Asia Pacific)
PARKROYAL on Pickering
• MIPIM Asia Awards
• Council on Tall Buildings and Urban Habitat (CTBUH)
Awards 20159
1H2016 RESULTS OVERVIEW
10

11
$m 2Q2016 2Q2015
%
Change 1H2016 1H2015
%
Change
Revenue 363.6 342.2 6 693.7 580.5 19
Share of profit of
associated and joint
venture companies
38.1 35.3 8 72.2 74.2 -3
Profit before fair value and
other (losses)/gains and
income tax
105.8 114.9 -8 199.3 203.8 -2
Fair value gains on
associated companies’
investment properties
9.1 2.4 284 9.1 2.4 284
Fair value (losses)/gains on
the Group’s investment
properties
(28.7) 57.9 -150 (28.7) 57.9 -150
Profit before income tax 79.3 175.7 -55 173.0 265.3 -35
Net attributable profit 68.8 152.5 -55 145.9 226.7 -36
Earnings per share (cents) 8.64 19.36 -55 18.31 28.78 -36

12
1H2016 FY2015 % Change
Net tangible asset value per share $9.77 $9.89 -1
Total equity $8,392m $8,401m 0
Cash $272m $276m -1
Net debt $2,461m $2,294m 7
Gearing ratio 0.29 0.27 7

Propertydevelopment
Propertyinvestments
Hoteloperations
Managementservices
Investments
185.5
55.1
101.1
5.016.8
162.3
54.9
98.6
4.7
21.7
2Q2016
2Q2015
($m) Revenue by Business Segments
2Q2016 vs 2Q2015
13
14%
0%
3%
-23%8%
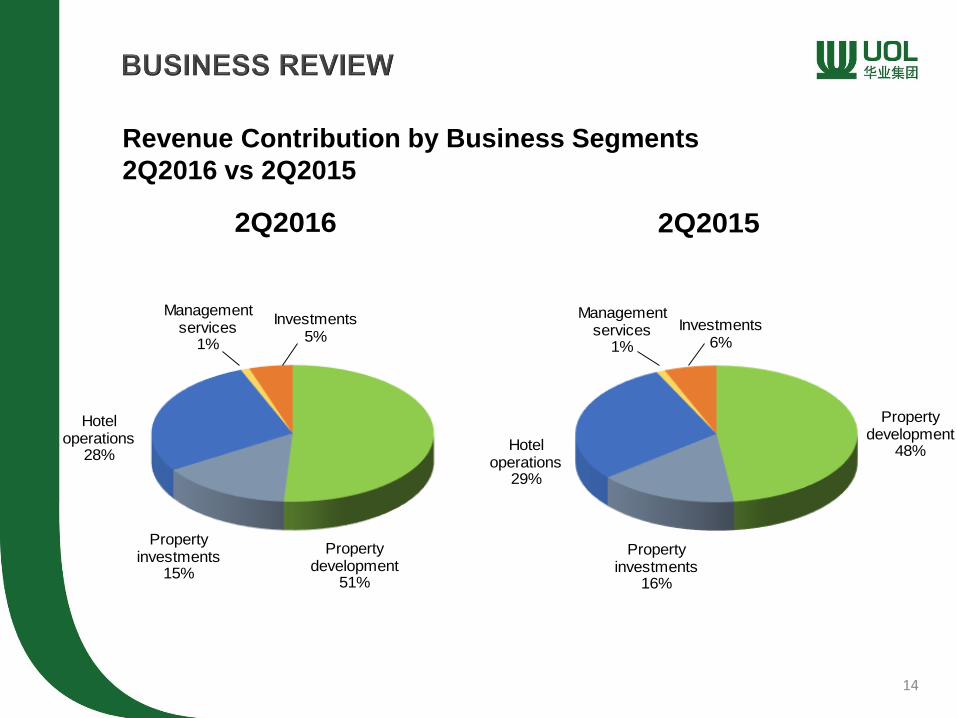
Revenue Contribution by Business Segments
2Q2016 vs 2Q2015
14
Property development
48%
Property investments
16%
Hotel operations
29%
Management services
1%
Investments6%
2Q2015
Property development
51%
Property investments
15%
Hotel operations
28%
Management services
1%
Investments5%
2Q2016

Propertydevelopment
Propertyinvestments
Hoteloperations
Managementservices
Investments
349.8
110.6
206.0
10.4 16.8
239.7
108.1
201.2
9.821.7
1H2016
1H2015
($m) Revenue by Business Segments
1H2016 vs 1H2015
15
46%
2%
2%
-23%7%

Revenue Contribution by Business Segments
1H2016 vs 1H2015
16
Property development
41%
Property investments
18%
Hotel operations
35%
Management services
2%
Investments4%
1H2015
Property development
50%
Property investments
16%
Hotel operations
30%
Management services
2%
Investments2%
1H2016
OPERATION HIGHLIGHTS
17

Clementi Avenue 1 Site
• Successfully tendered for 99-year
leasehold site in December 2015
• Potentially yield 505 units
• 50% stake
• Tallest Prefabricated Pre-finished
Volumetric Construction (PPVC)
building in the world
• Target to launch in 1Q2017
18Source: URA

Principal Garden
• 99-year leasehold site at Prince Charles Crescent
• 663-unit development near Redhill MRT station
• 70% stake
• Launched in Oct 2015
• 33.5% sold as at 30 Jun 2016 19

Botanique at Bartley
• 99-year leasehold site along Upper Paya Lebar Road
• 797-unit condominium near Bartley MRT station
• 100% stake
• 91.7% sold as at 30 Jun 2016 20
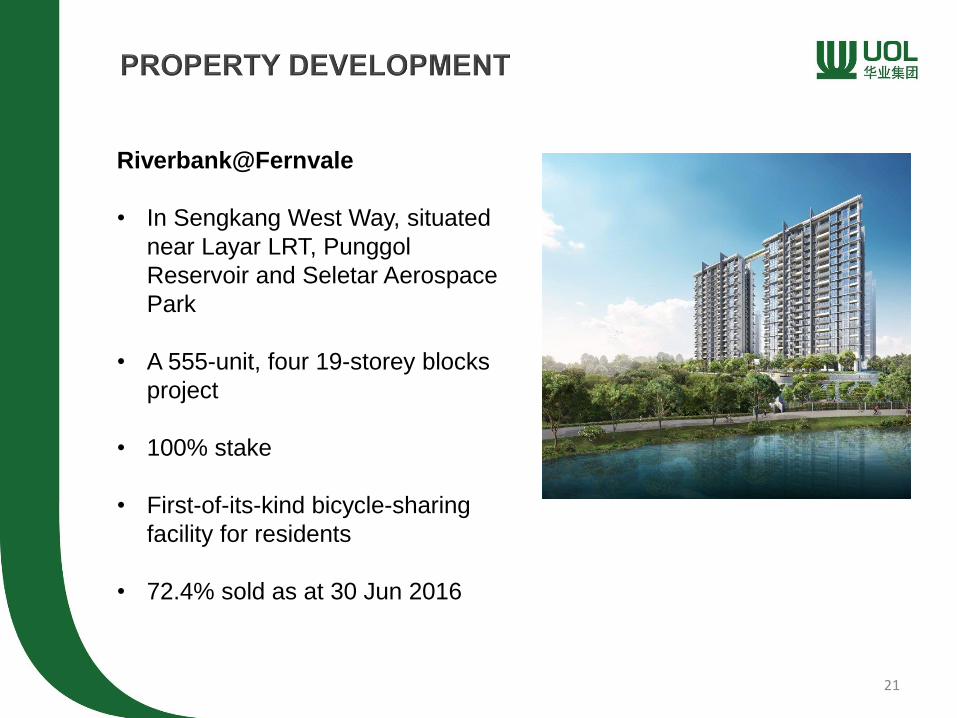
Riverbank@Fernvale
• In Sengkang West Way, situated
near Layar LRT, Punggol
Reservoir and Seletar Aerospace
Park
• A 555-unit, four 19-storey blocks
project
• 100% stake
• First-of-its-kind bicycle-sharing
facility for residents
• 72.4% sold as at 30 Jun 2016
21

The Esplanade, Tianjin
• Mixed development, along HaiHe River,
comprising four blocks of 522 residential
units, a 319-room hotel, 17,075 sqm
GFA office and 11,926 sqm GFA retail
space
• 100% stake
• 100% of 4 residential towers sold
as at 30 Jun 2016
• 78.1% of one office tower sold as at 30
Jun 2016
22

Park Eleven, Shanghai
• Mixed development located
within the Changfeng Ecological
Business Park, about 5 km to
the north-east of the Hongqiao
Transportation Hub and less
than 10 km from The Bund
• 398 residential units and
4,000 sqm of net lettable area
of retail
• 40% stake
• Target to launch in 3Q2016
23

Site at Bishopsgate, London
• UOL’s first investment in Europe
• Freehold land of 3,200 sqm
• Located in London’s central financial
district, about 200m from Liverpool
Street Station and the future Crossrail
Station
• Approved for a 43-storey tower
(52,255 sqm GFA) with residential,
hotel and retail components
• Currently seeking planning approval
for the intensification of the number of
residential units to 160 and hotel
rooms to 237
• 100% stake 24

Profit recognition of launched projects
25
Project Name %
Equity
Stake
No. of
Units
Saleable
Area
(sqm)
% Sold(as at 30.06.16)
%
Completed(as at 30.06.16)
TOP Date
Completed
Thomson Three 50 445 39,965 98.4 100 TOP
The Esplanade, Tianjin 100 570 71,586 94.0 100 TOP
Ongoing
Seventy Saint Patrick’s 100 186 12,950 100 98 Est. 3Q2016
Riverbank@Fernvale 100 555 48,345 72.4 85 Est. 1Q2017
Botanique at Bartley 100 797 55,419 91.7 28 Est. 3Q2018
Principal Garden 70 663 50,665 33.5 15 Est. 2Q2018

Singapore residential pipeline
* Mixed development with 398 residential units and 4,000 sqm of net lettable area of retail
** Mixed development with proposed 160 residential units, 237 hotel rooms and a retail component
Project Name/Location Tenure
of Land
Site Area
(sqm)
Est.
Saleable
Area (sqm)
Est. No.
of Units
%
Owned
Target
Launch
Clementi Ave 1 site 99 13,038 45,633 505 50 1Q2017
Overseas residential pipeline
Project Name/Location Site Area
(sqm)
Est. Saleable
Area (sqm)
Est. No.
of Units
%
Owned
Target
Launch
Park Eleven, Shanghai (Changfeng)* 39,540 78,526 398 40 3Q2016
Site at Bishopsgate, London** 3,200 13,551 160 100 2017
Total 42,740 92,077 558
26

110 High Holborn, London
• Acquired in June 2016
• Freehold asset of about 10,900 sqm located in London’s Midtown,
near Holborn underground station
• Comprises offices together with retail space arranged over basement,
ground and eight upper floors
• 100% stake 27
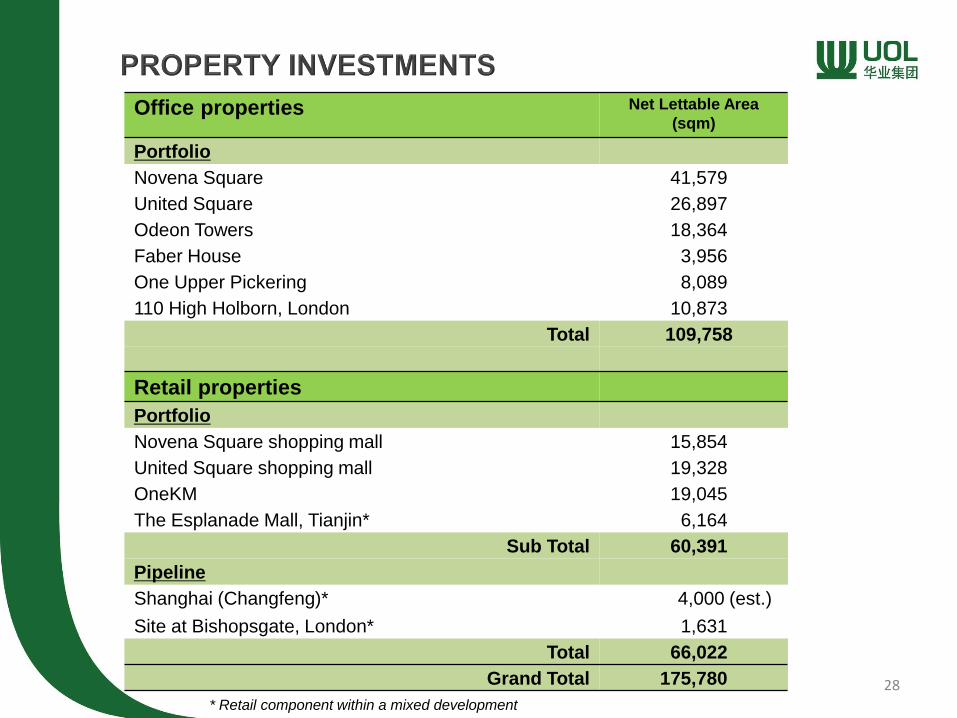
* Retail component within a mixed development
Office properties Net Lettable Area
(sqm)
Portfolio
Novena Square 41,579
United Square 26,897
Odeon Towers 18,364
Faber House 3,956
One Upper Pickering 8,089
110 High Holborn, London 10,873
Total 109,758
Retail properties
Portfolio
Novena Square shopping mall 15,854
United Square shopping mall 19,328
OneKM 19,045
The Esplanade Mall, Tianjin* 6,164
Sub Total 60,391
Pipeline
Shanghai (Changfeng)* 4,000 (est.)
Site at Bishopsgate, London* 1,631
Total 66,022
Grand Total 175,780 28

Owned Serviced Suites Properties Rooms
Portfolio
Pan Pacific Serviced Suites Orchard, Singapore 126
Pan Pacific Serviced Suites Beach Road, Singapore 180
PARKROYAL Serviced Suites Beach Road, Singapore 90
PARKROYAL Serviced Suites Kuala Lumpur 287
Total 683
29

Owned Hotels Country Rooms
Portfolio
Pan Pacific Orchard Singapore 206
PARKROYAL on Beach Rd Singapore 346
PARKROYAL on Kitchener Road Singapore 532
PARKROYAL on Pickering Singapore 367
Pan Pacific Perth Australia 486
PARKROYAL Darling Harbour, Sydney Australia 340
PARKROYAL Parramatta Australia 196
PARKROYAL Melbourne Airport Australia 276
PARKROYAL Kuala Lumpur Malaysia 426
PARKROYAL Penang Malaysia 309
Pan Pacific Xiamen China 354
Pan Pacific Suzhou China 480
Pan Pacific Tianjin China 319
PARKROYAL Yangon Myanmar 334
Sofitel Plaza Hanoi Vietnam 321
PARKROYAL Saigon Vietnam 186
Sub Total 5,478
Pipeline
Hotel in Bishopsgate, London (to be
operated under the “Pan Pacific” brand)
PARKROYAL Parramatta extension
currently under development
UK
Australia
237
90
Sub Total 327
Total 5,80530

Note: Serviced suites are included in the above tally
Existing Pipeline
No. of Hotels No. of Rooms No. of Hotels No. of Rooms
By Brand
Pan Pacific 19 5,763 3 790
PARKROYAL 13 3,779 3 855
Others 1 321 0 0
Total 33 9,863 6 1,645
By Ownership Type
Owned 20 6,161 1 327
Managed 13 3,702 5 1,318
Total 33 9,863 6 1,645
31

This presentation may contain forward-looking statements or financial information. Such forward-looking statements
and financial information may involve known and unknown risks, uncertainties, assumptions and other factors which
may cause the actual results, performance or achievements of UOL Group Limited, or industry results, to be materially
different from any future results, performance or achievements expressed or implied by such forward-looking
statements and financial information.
Such forward-looking statements and financial information are based on assumptions including (without limitation) UOL
Group Limited’s present and future business strategies, general industry and economic conditions, interest rate trends,
cost of capital and capital availability, availability of real estate properties, competition from other companies, shifts in
customer demands, customers and partners, changes in operating expenses (including employee wages, benefits and
training), governmental and public policy changes and the continued availability of financing in the amounts and the
terms necessary to support future business activities.
You are advised not to place undue reliance on these forward-looking statements and financial information, which are
based on UOL Group Limited’s current views concerning future events.
UOL Group Limited expressly disclaims any obligation or undertaking to release publicly any updates or revisions to
any forward-looking statements or financial information contained in this presentation to reflect any change in UOL
Group Limited’s expectations with regard thereto or any change in events, conditions or circumstances on which any
such statement or information is based, subject to compliance with all applicable laws and regulations and/or the rules
of the SGX-ST and/or any other regulatory or supervisory body.
This presentation may include market and industry data and forecasts. You are again advised that there can be no
assurance as to the accuracy or completeness of such included information. While UOL Group Limited has taken
reasonable steps to ensure that the information is extracted accurately and in its proper context, UOL Group Limited
has not independently verified any of the data or ascertained the underlying assumptions relied upon therein.
32