Investor Letter
24
Investor Letter First Quarter Fiscal Year 2022 August 3, 2021
Transcript of Investor Letter

Investor LetterFirst Quarter Fiscal Year 2022August 3, 2021

21Q FY22
1 Please refer to the appendix for a reconciliation of these non-GAAP financial measures to their most directly comparable GAAP measures.
Financial results for the first quarter of fiscal 2022 came in ahead of expectations as we continue to build on the momentum we enjoyed in the fourth quarter of last fiscal year.
Revenue was $180 million in the first fiscal quarter compared to revenue of $163 million in the first quarter of the prior fiscal year, representing growth of 11%. Revenue was above the guidance of between $172 million – $174 million that we provided in our earnings press release for the fourth fiscal quarter.
GAAP loss from operations in the first fiscal quarter was ($73.9) million and non-GAAP loss from operations was ($16.2) million. Non-GAAP loss from operations was ahead of guidance of between ($24) million–($26) million primarily due to overachievement in our top line.
GAAP net loss attributable to New Relic per basic share was ($1.24), compared to a loss of ($0.50) per basic share for the first quarter of fiscal 2021. Non-GAAP net loss attributable to New Relic per diluted share was ($0.25). This was above the guidance of between ($0.37) – ($0.40) that we provided in our earnings press release for the fourth fiscal quarter.
GAAP gross margins were 67.2% and Non-GAAP gross margins were 69.0%. Revenue upside drove better than expected gross margins this quarter, and we are still targeting full year gross margins in the low to mid 70s. We continue to invest aggressively to: 1. Facilitate the transition out of our data centers and into the cloud and 2. Drive data ingest. When our transition to the cloud
Business Update
Revenue (in millions)
$160 $163 $166 $166 $173 $180
Mar 204Q20
Jun 201Q21
Sep 202Q21
Dec 203Q21
Mar 214Q22
Jun 211Q22
Non-GAAP Operating Income (Loss) (in millions)1
$3.5$7.6
($5.3)($8.4)
($18.5)($16.2)
Mar 204Q20
Jun 201Q21
Sep 202Q21
Dec 203Q21
Mar 214Q21
Jun 211Q22
Non-GAAP Gross Margins1
0
20
40
60
80
10084% 81% 75% 74% 69% 69%
Mar 204Q20
Jun 201Q21
Sep 202Q21
Dec 203Q21
Mar 214Q21
Jun 211Q22
31Q FY22
is complete, we expect gross margins to be back in the 80% range. However, if our data ingest continues to grow ahead of plan, which we would view as a positive leading indicator of the health of our business, then a return to 80% gross margins could be pushed out beyond two years.
Deferred revenue in our fiscal first quarter was $318 million compared to $375 million in our fiscal fourth quarter. This decline is primarily due to our ongoing transition to a consumption model where the sales emphasis is on usage, not upfront commitments. This leads to less of a focus on large contracts or early renewals and more of a focus on driving customer value, which poses a headwind to deferred revenue.
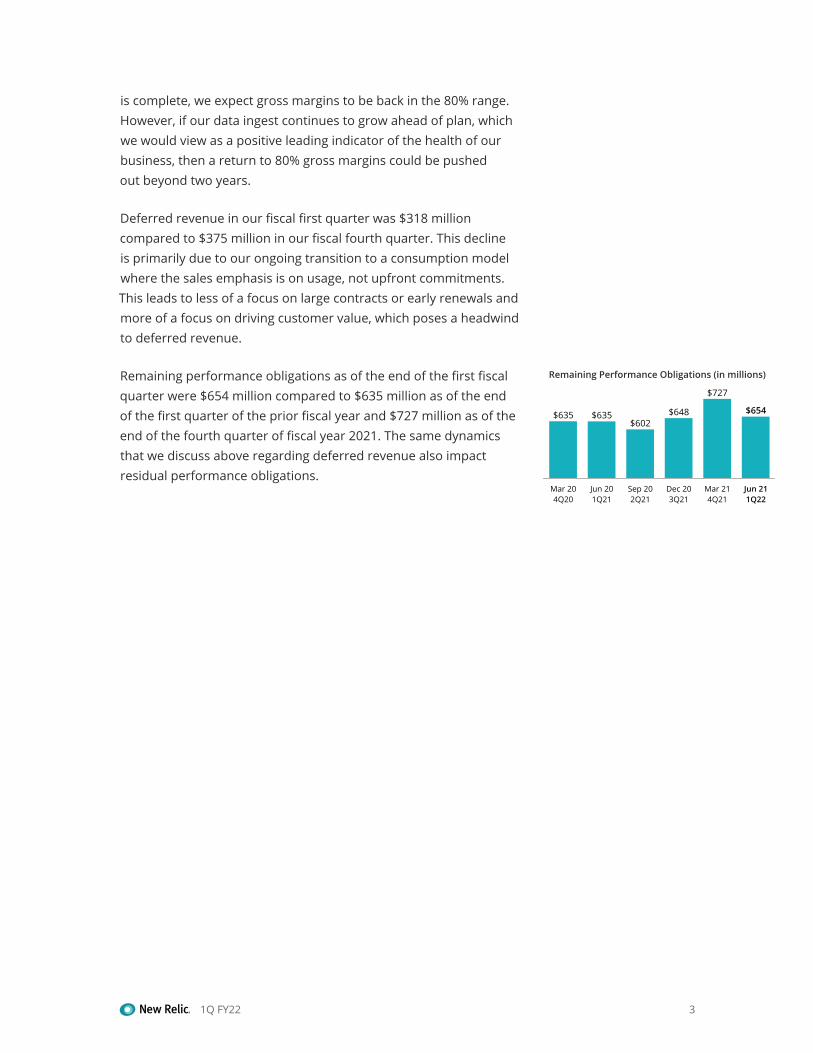
Remaining performance obligations as of the end of the first fiscal quarter were $654 million compared to $635 million as of the end of the first quarter of the prior fiscal year and $727 million as of the end of the fourth quarter of fiscal year 2021. The same dynamics that we discuss above regarding deferred revenue also impact residual performance obligations.
Remaining Performance Obligations (in millions)
400
500
600
700
800
$635 $635$602
$648
$727
$654
Mar 204Q20
Jun 201Q21
Sep 202Q21
Dec 203Q21
Mar 214Q21
Jun 211Q22

41Q FY22
I’m thrilled to serve as New Relic’s CEO and before I share our results for this first quarter of fiscal 2022, I want to express my gratitude for all of the hard work by our Relics, past and present, especially Lew Cirne who founded and led this company from the ground up and laid the foundation for our success in this quarter and the years to come.
I’m pleased to share that we soundly beat the expectations we set on our last earnings call, and we’re raising guidance for the second fiscal quarter and the rest of the year. We continue to expect reacceleration in top line growth on a year over year basis in the back half of the fiscal year.
At New Relic, we are obsessed about helping our customers master telemetry data not just to troubleshoot production incidents that are impacting customers now, but to take proactive, preventive steps to avoid impacting customers, and deliver the insights that make building more perfect software faster and easier from the start.
We aspire to help millions of developers and engineers build better software, faster and with less toil by making observability a daily part of their engineering practice and helping them take a data-driven approach across the entire software lifecycle.
As our new CEO, I’ve identified five strategic priorities. The entire company is now aligned behind these objectives, and we have identified measurable success criteria for each to help us all gauge progress. Each quarter we will provide an update on how we are doing on all five.
In this letter, my first quarter as CEO, I’d like to expand on each of these priorities, articulate why it is a focus and how we will measure progress, as well as share results from this quarter.
Let’s dive in!
Dear New Relic Stockholders,
Return to Market Revenue
Growth Rates
1Migrate 80% ofBusiness to the New Relic One Consumption
Model
2Grow the Number of Paying
Customers
3Methodically
Deliver Unique Value
4ImproveInternal
Execution Efficiency
5

51Q FY22
Priority #1 – Return to Market Revenue Growth Rates Our top priority is to return our revenue to market growth rates. As a consumption business this is the crowning metric which measures our ability to innovate value that customers are willing to pay for in an efficient manner. We measure our success with this priority by our quarterly revenue reporting and we aim to show revenue increases and consistent year-over-year growth in the quarters ahead.
For eight quarters, revenue growth has decelerated while we’ve re-platformed our product front and back-end, pivoted toward our new platform pricing model and migrated existing customers to the consumption business model. I’m pleased to share today that in the first fiscal quarter we soundly beat expectations and delivered revenue of $180 million compared to revenue of $163 million in the first quarter of the prior fiscal year, representing growth of 11% and beating guidance of between $172 million – $174 million that we provided in our earnings press release for the fourth fiscal quarter.
GAAP loss from operations in the first fiscal quarter was ($73.9) million and non-GAAP loss from operations was ($16.2) million. Non-GAAP loss from operations was ahead of guidance of between ($24) million–($26) million primarily due to overachievement in our top line.
GAAP net loss attributable to New Relic per basic share was ($1.24), compared to a loss of ($0.50) per basic share for the first quarter of fiscal 2021. Non-GAAP net loss attributable to New Relic per diluted share was ($0.25). This was above the guidance of between ($0.37) – ($0.40) that we provided in our earnings press release for the fourth fiscal quarter.
As expected, our deferred revenue in our fiscal first quarter was $318 million compared to $375 million in our fiscal fourth quarter. This decline is primarily due to our ongoing transition to a consumption model where the sales emphasis is on usage, not upfront commitments. This leads to less of a focus on large contracts or early renewals and more of a focus on driving customer value. The move to a consumption model changes the dynamics of deferred revenue, so deferred revenue is less useful in understanding the momentum of the business as we continue our transition.
Net Revenue Retention2
The following tables present our Net Revenue Retention rate, or NRR, in aggregate and broken out above and below the $25K annual spend threshold. Because NRR is a trailing 12 month metric, these numbers reflect the deceleration in our business over the past year. Active customer accounts with greater than or equal to $25K in annual spend are the bulk of our revenue and NRR for this segment essentially reflects our business as a whole, while our active customer accounts with less than $25K in annual spend are a small percentage of our revenue, but tend to grow faster off a smaller base. As we complete the transition to a consumption model, NRR will increasingly be an important metric to gauge our progress against our revenue growth priority.
2 Please refer to the appendix for the definition of net revenue retention.

61Q FY22
Data Growth Data ingest is an important contributor to our revenues and validation of our consumption model. Our revenue mix remains consistent at about 65% / 35% (users / data), and our expectation remains that we will get back to 80% gross margins as we complete our transition to the cloud and the revenue mix will trend closer to 70% / 30% (users / data) in the intermediate term.
Total daily data ingest ending June 2021 increased 71% compared to June 2020.
Average Daily PB Ingest Per Month
Nov20
Dec20
Oct20
Sep20
Aug20
Jul20
Jun20
Jan21
Feb21
Mar21
Apr21
May21
Jun21
NRR <$25K Jun 191Q20
Sep 192Q20
Dec 193Q20
Mar 204Q20
Jun 201Q21
Sep 202Q21
Dec 203Q21
Mar 214Q21
Jun 211Q22
<$25K 131% 131% 130% 128% 129% 121% 117% 123% 119%
QoQ -0.3% -0.9% -2.1% 0.6% -7.3% -4.2% 5.6% -4.0%
NRR >=$25K Jun 191Q20
Sep 192Q20
Dec 193Q20
Mar 204Q20
Jun 201Q21
Sep 202Q21
Dec 203Q21
Mar 214Q21
Jun 211Q22
>=$25K 132% 131% 128% 125% 121% 118% 114% 111% 110%
QoQ -1.8% -2.9% -2.7% -4.0% -2.5% -3.9% -3.3% -0.6%
NRR – Total Jun 191Q20
Sep 192Q20
Dec 193Q20
Mar 204Q20
Jun 201Q21
Sep 202Q21
Dec 203Q21
Mar 214Q21
Jun 211Q22
Total 132% 131% 128% 125% 122% 119% 115% 112% 111%
QoQ -1.6% -2.6% -2.7% -3.5% -3.1% -4.0% -2.4% -1.0%
71Q FY22
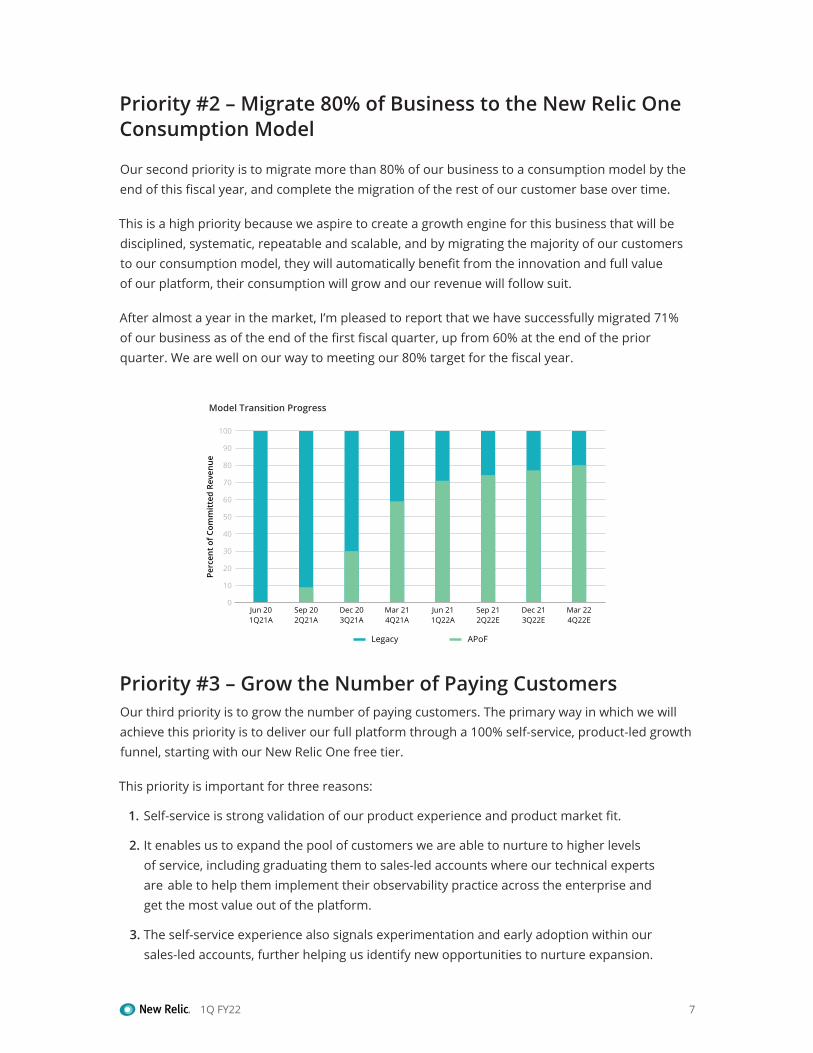
Priority #2 – Migrate 80% of Business to the New Relic One Consumption Model
Our second priority is to migrate more than 80% of our business to a consumption model by the end of this fiscal year, and complete the migration of the rest of our customer base over time.
This is a high priority because we aspire to create a growth engine for this business that will be disciplined, systematic, repeatable and scalable, and by migrating the majority of our customers to our consumption model, they will automatically benefit from the innovation and full value of our platform, their consumption will grow and our revenue will follow suit.
After almost a year in the market, I’m pleased to report that we have successfully migrated 71% of our business as of the end of the first fiscal quarter, up from 60% at the end of the prior quarter. We are well on our way to meeting our 80% target for the fiscal year.
Priority #3 – Grow the Number of Paying Customers Our third priority is to grow the number of paying customers. The primary way in which we will achieve this priority is to deliver our full platform through a 100% self-service, product-led growth funnel, starting with our New Relic One free tier.
This priority is important for three reasons:
1. Self-service is strong validation of our product experience and product market fit.
2. It enables us to expand the pool of customers we are able to nurture to higher levels of service, including graduating them to sales-led accounts where our technical experts are able to help them implement their observability practice across the enterprise and get the most value out of the platform.
3. The self-service experience also signals experimentation and early adoption within our sales-led accounts, further helping us identify new opportunities to nurture expansion.
Model Transition Progress
0
10
20
30
40
50
60
70
80
90
100
Legacy APoF
Sep 202Q21A
Dec 203Q21A
Mar 214Q21A
Mar 224Q22E
Jun 211Q22A
Sep 212Q22E
Dec 213Q22E
Jun 201Q21A
Perc
ent o
f Com
mit
ted
Reve
nue

81Q FY22
We are encouraged by the early signs we are seeing in our PAYG business. The number of PAYG accounts (PAYG is a self-service account that has entered a credit card) continues to grow rapidly, and as of the end of first quarter, approximately 80% of our PAYG accounts accrue charges and are billed in a given quarter, consistent with last quarter.
Most of our PAYG customers are small and don’t necessarily pay us every month, but churn remains low at approximately 1% – 2% per month. However, PAYG remains an excellent source of leads, and as you can see from the chart below, accounts that started as PAYG consuming at a $25K+ annual run rate have grown from 35 customers last quarter to 69 customers this quarter. Importantly, four of those accounts are at a $100K+ annual run rate at the end of the first fiscal quarter.
Total active customer account growth for the quarter was flattish, which is primarily due to the long tail of our smaller accounts transitioning to free, which means the dollar impact is small. Also, and importantly, our methodology for counting accounts has changed in fiscal 2022. The two most important changes are: 1. We consolidated subsidiary accounts under the parent company 2. We count any account for which we have recognized revenue in the quarter as a customer.
0
500
1,000
1,500
2,000
2,500
3,000
3,500
Dec 20Nov 20Sep 20Aug 20Jul 20 Jan 21 Feb 21 Mar 21 Apr 21 May 21 Jun 21Oct 20
Cumulative Number of PAYG Accounts
0
10
20
30
40
50
60
80
70
Dec 20Nov 20Sep 20Aug 20Jul 20 Jan 21 Feb 21 Mar 21 Apr 21 May 21 Jun 21Oct 20
PAYG Spending >$25K Per Year
91Q FY22
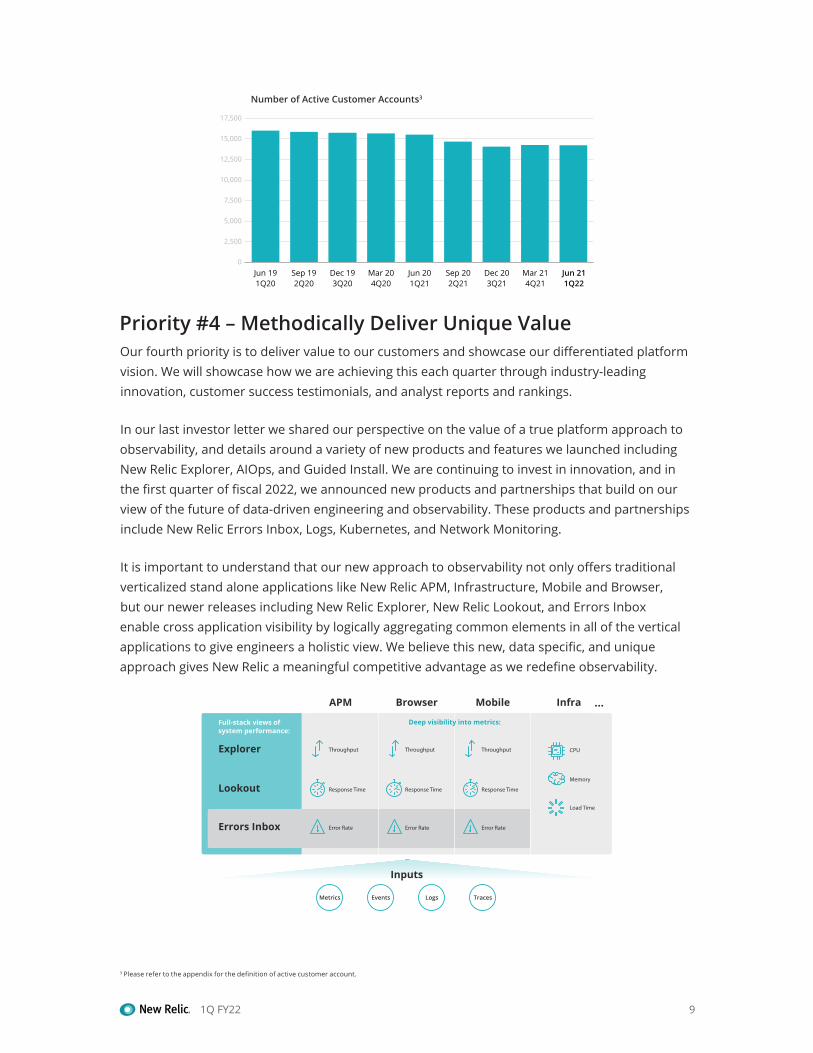
Priority #4 – Methodically Deliver Unique Value Our fourth priority is to deliver value to our customers and showcase our differentiated platform vision. We will showcase how we are achieving this each quarter through industry-leading innovation, customer success testimonials, and analyst reports and rankings.
In our last investor letter we shared our perspective on the value of a true platform approach to observability, and details around a variety of new products and features we launched including New Relic Explorer, AIOps, and Guided Install. We are continuing to invest in innovation, and in the first quarter of fiscal 2022, we announced new products and partnerships that build on our view of the future of data-driven engineering and observability. These products and partnerships include New Relic Errors Inbox, Logs, Kubernetes, and Network Monitoring.
It is important to understand that our new approach to observability not only offers traditional verticalized stand alone applications like New Relic APM, Infrastructure, Mobile and Browser, but our newer releases including New Relic Explorer, New Relic Lookout, and Errors Inbox enable cross application visibility by logically aggregating common elements in all of the vertical applications to give engineers a holistic view. We believe this new, data specific, and unique approach gives New Relic a meaningful competitive advantage as we redefine observability.
Number of Active Customer Accounts3
0
2,500
5,000
7,500
10,000
12,500
15,000
17,500
20,000
Sep 192Q20
Dec 193Q20
Mar 204Q20
Jun 201Q21
Sep 202Q21
Dec 203Q21
Mar 214Q21
Jun 211Q22
Jun 191Q20
3 Please refer to the appendix for the definition of active customer account.
Metrics Events Logs Traces
Deep visibility into metrics:Full-stack views of system performance:
Explorer
APM
Throughput
Response Time
Error Rate
Browser Mobile Infra …
CPU
Memory
Load Time
Lookout
Errors Inbox
Inputs
Throughput
Response Time
Error Rate
Throughput
Response Time
Error Rate
101Q FY22
This quarter was another hallmark quarter of innovation from our product and marketing organizations. We held our annual #futurestack developer conference and enjoyed record attendance with many thousands more engineers who viewed the sessions on demand following the conference.
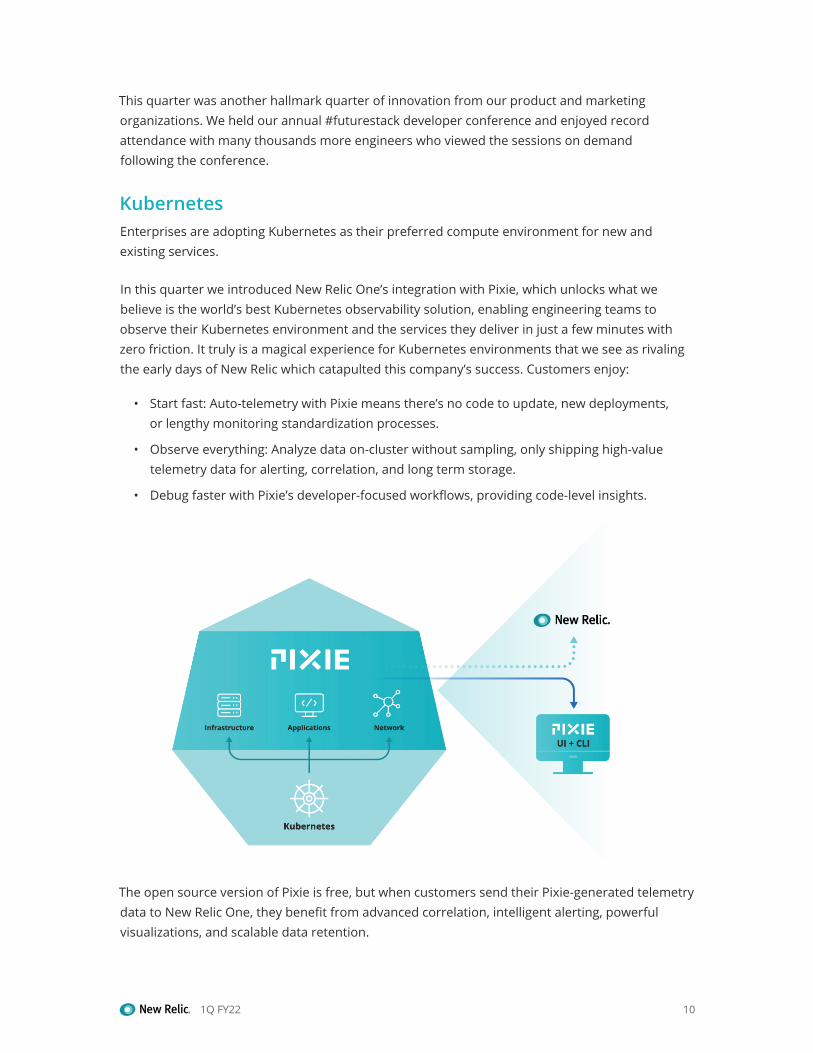
KubernetesEnterprises are adopting Kubernetes as their preferred compute environment for new and existing services.
In this quarter we introduced New Relic One’s integration with Pixie, which unlocks what we believe is the world’s best Kubernetes observability solution, enabling engineering teams to observe their Kubernetes environment and the services they deliver in just a few minutes with zero friction. It truly is a magical experience for Kubernetes environments that we see as rivaling the early days of New Relic which catapulted this company’s success. Customers enjoy:
• Start fast: Auto-telemetry with Pixie means there’s no code to update, new deployments, or lengthy monitoring standardization processes.
• Observe everything: Analyze data on-cluster without sampling, only shipping high-value telemetry data for alerting, correlation, and long term storage.
• Debug faster with Pixie’s developer-focused workflows, providing code-level insights.
The open source version of Pixie is free, but when customers send their Pixie-generated telemetry data to New Relic One, they benefit from advanced correlation, intelligent alerting, powerful visualizations, and scalable data retention.

111Q FY22
New Relic Errors InboxNew Relic Errors Inbox allows engineers to organize errors by team, and then enable those teams to track, triage and resolve all their relevant errors from a single screen. Without New Relic Errors Inbox, an engineer is constantly dealing with alerts that aren’t correlated, get sent to a broad array of engineers, and therefore run the risk of being ignored.
With New Relic Errors Inbox, developers can:
• View and triage issues for entities and services across the full application stack
• Receive detailed alerts with error information inline the moment an error is detected
• Resolve errors faster with full-stack context and persistent data to fix re-opened errors
• Work errors as a team with shared visibility and comments
New Relic Errors Inbox has more than 2,000 active users in approximately 45 days after launch, making it one of New Relic’s most successful new product launches ever.
Network Monitoring with KentikWe were also excited to announce our partnership with Kentik, pulling network context into New Relic One and helping devOps teams and NetOps teams collaborate more closely together in the New Relic One experience. Early adopters are already engaged and using this new offer and we anticipate making it generally available in the back half of the calendar year.

121Q FY22
Priority #5 – Improve Internal Execution Efficiency Our fifth and final corporate priority is to increase our internal execution efficiency. All areas of the business need to move faster, with less friction and more efficiency. We need to systematize our planning, prioritization and execution rhythms and better stitch together internal data across product, marketing, sales and finance so that we can run the business in real-time and better serve our customers in their moments consuming the platform. This takes leadership at the highest levels. I’m happy to share that in the first fiscal quarter we are already getting good traction in several areas:
LeadershipThe new executive team is off to a running start with clear objectives for this quarter. As we shared a few weeks ago, we hired Anita Lynch, our new Chief Data Officer and owner of our internal data systems. She is joining Kristy Friedrichs’ team, our new Chief Operations Officer responsible for systematizing our internal execution across functions. Manav Khurana, GM and product owner of our burgeoning self-service business was also promoted to Chief Growth Officer, bringing all aspects of that self-service product experience together with the full marketing organization under his terrific leadership.
Operational Efficiency At the beginning of the fiscal year, we managed a workforce reduction of approximately 10% of our employee base. The majority of the restructuring impacted Sales and Marketing, and was the result of a strategy that is focused on improving customer acquisition costs by achieving a more efficient sales-led consumption model for our larger customers, and marketing-led self-service for our smaller customers.
Cost of Goods and ServicesGAAP gross margins were 67.2% and Non-GAAP gross margins were 69.0%. Revenue upside drove better than expected gross margins this quarter, and we are still targeting full year gross margins in the low to mid 70s. We continue to invest aggressively to: 1. Facilitate the transition out of our data centers and into the cloud and 2. Drive data ingest. When our transition to the cloud is complete, we expect gross margins to be back in the 80% range.
Alliances and Channels One of the ways we are increasing our GTM efficiency is to broaden our reach through partners. In the first fiscal quarter, we continued to lay the groundwork for a broader ecosystem of managed service providers, resellers and consulting partners. While some of these partnerships are productive already, our partnership with AWS continues to drive the vast majority of our indirect business. Billings from the AWS Marketplace grew sequentially for the third quarter in a row, enabling us to put up yet another record quarter.

131Q FY22
In SummaryWe are off to a fast start for fiscal year 2022 and we’re optimistic that all of the investments we’re making in our platform and products will continue to drive growing awareness and adoption in the observability community. In our second quarter we’ll anniversary our initial annual pool of funds contracts which should help the investment community understand how customers are responding to our consumption model. As we execute on our new go to market model that prioritizes customer success, we expect to continue to drive growth in users, data and accounts. We are on the right path and I am excited to step into the CEO role and do my part to help New Relic realize its full potential.

141Q FY22
All financial comparisons are on a year-over-year basis unless otherwise noted. Financial statement tables can be found at the end of this letter.
First Quarter ResultsFirst Quarter Fiscal Year 2022 Financial Highlights
• Revenue of $180 million, compared to $163 million for the first quarter of fiscal 2021.
• GAAP gross margin of 67% and non-GAAP gross margin of 69%.
• GAAP loss from operations was ($73.9) million, compared to a loss of ($26.1) million for the first quarter of fiscal 2021.
• Non-GAAP income (loss) from operations was ($16.2) million, compared to $7.6 million for the first quarter of fiscal 2021.
• GAAP net loss attributable to New Relic per basic share was ($1.24), compared to ($0.50) per basic share for the first quarter of fiscal 2021.
• Non-GAAP net income (loss) attributable to New Relic per diluted share was ($0.25), compared to $0.15 per diluted share for the first quarter of fiscal 2021.
• Cash provided by operating activities was $9.9 million and free cash flow was $4.8 million for the first quarter of fiscal 2022.
• Cash, cash equivalents and short-term investments were $817 million at the end of the first quarter of fiscal 2022, compared with $816 million at the end of the fourth quarter of fiscal 2021.
• Remaining performance obligations were $654 million at the end of the first quarter of fiscal 2022, compared with $727 million at the end of the fourth quarter of fiscal 2021. This represents the aggregate unrecognized transaction price of remaining performance obligations as of each of June 30, 2021 and March 31, 2021.
Financial Discussion

151Q FY22
Key Performance Metrics
OutlookSecond Quarter and Full Year Fiscal 2022 OutlookFor the second quarter of fiscal year 2022, we expect:
• Revenue between $181 million and $183 million, representing year-over-year growth of between 9% and 10%, respectively.
• Non-GAAP loss from operations of between ($13) million and ($15) million.
• Non-GAAP net loss attributable to New Relic per diluted share between ($0.11) and ($0.15).
For the full year fiscal 2022, we expect:
• Revenue between $730 million and $735 million, representing year-over-year growth of between 9% and 10%, respectively.
• Non-GAAP loss from operations between ($53) and ($55) million.
• Non-GAAP net loss attributable to New Relic per diluted share between ($0.49) and ($0.52).
Jun 19 1Q20
Sep 19 2Q20
Dec 19 3Q20
Mar 20 4Q20
Jun 20 1Q21
Sep 20 2Q21
Dec 20 3Q21
Mar 21 4Q21
Jun 21 1Q22
Active Customer Accounts 15,800 15,700 15,600 15,500 15,400 14,500 13,900 14,100 14,100
Active Customer Accounts >$100,000 759 787 832 846 862 894 913 945 964
Percentage of Revenue from Active Customer Accounts >$100,000 71% 72% 74% 75% 76% 77% 78% 79% 79%
Net Revenue Retention Rate (NRR) 132% 131% 128% 125% 122% 119% 115% 112% 111%

161Q FY22
Forward-Looking Statements
This investor letter contains “forward-looking” statements, as that term is defined under the federal securities l aws. Any statement that refers to expectations, projections, targets or other characterizations of future events, including financial projections and future market conditions, is a forward-looking statement. Statements included in this investor letter that are forward-looking statements include but are not limited to statements regarding: New Relic’s future financial performance, including its outlook on financial results for the second quarter and the full year of fiscal 2022, such as revenue, non-GAAP loss from operations, non-GAAP net loss attributable to New Relic per diluted share, our ability to achieve our five strategic priorities, including statements regarding reacceleration of revenue growth and returning to market growth rates, ability to exceed our target revenue percentage on the new consumption model, growing the number of paying customers, delivering unique value and demonstrating our differentiated platform vision, and improving internal execution efficiency and costs, improvements in gross margins, churn, ability to complete our cloud migration, benefits and features of new products and partnerships, including Errors Inbox, Logs, Kubernetes and Network Monitoring, trends related to sales and marketing and research and development spend as a percentage of revenue, our revenue mix in the intermediate and longer-term, expectations of growth in awareness and increase adoption in the observability community, and related ability to continue to drive growth in our data, users and accounts, and related ability to drive financial performance as a result of these changes. These forward-looking statements are based on our assumptions, expectations and beliefs as of the date of this investor letter and are subject to substantial risks, uncertainties, assumptions, and changes in circumstances that may cause our actual results, performance, or achievements to differ materially from those expressed or implied in any forward-looking statement. The risks and uncertainties include, but are not limited to, New Relic’s ability to determine optimal prices for its products and the potential challenges presented by New Relic’s evolving pricing models; the effect of the COVID-19 pandemic on New Relic’s business and on global economies and financial markets generally; New Relic’s ability to generate sufficient revenue to achieve and sustain profitability, particularly in light of its significant ongoing expenses; New Relic’s short operating history in an evolving industry; New Relic’s ability to manage its significant recent growth; the dependence of New Relic’s business on its customers remaining on its platform and increasing their spend with New Relic; New Relic’s ability to develop enhancements to its products, increase adoption and usage of its products and introduce new products that achieve market acceptance; the dependence on customers expanding their use of New Relic’s products beyond the current predominant use cases; New Relic’s ability to expand its marketing and sales capabilities and increase sales of its solutions; privacy concerns, including changes in privacy laws and regulations, which could result in additional cost and liability to New Relic or inhibit sales; New Relic’s ability to effectively compete in intensely competitive markets and respond effectively to rapidly changing technology, evolving industry standards and changing customer needs, requirements or preferences; fluctuation of New Relic’s quarterly results; New Relic’s dependence on lead generation strategies to drive sales and revenue; interruptions or performance problems associated with New Relic’s technology and infrastructure; New Relic’s dependence on SaaS technologies and related services from third parties; defects or disruptions in New Relic’s products; the expense and complexity of New Relic’s ongoing and planned investments in data center hosting facilities and expenditures on cloud hosting providers; risks associated with international operations; New Relic’s ability to protect its intellectual property rights; risks related to the acquisition and integration of businesses or technologies; risks related to sales to government entities and highly regulated organizations; certain risks associated with incurring indebtedness, including risks related to servicing New Relic’s convertible senior notes and related capped call transactions; and other “Risk Factors” set forth in New Relic’s most recent filings with the Securities and Exchange Commission (the “SEC”). We assume no obligation and do not intend to update these forward-looking statements, except as required by law. For more information about factors that could affect New Relic’s financial and other results and the forward-looking statements in this investor letter, please refer to the risks described in our filings with the SEC, including our Annual Report on Form 10-K and subsequent Quarterly Reports on Form 10-Q, particularly in the sections titled “Risk Factors” and “Management’s Discussion and Analysis of Financial Condition and Results of Operations.”
Non-GAAP Financial Measures
This investor letter also contains certain non-GAAP financial measures as defined by SEC rules. These non-GAAP financial measures are in addition to, and not a substitute for or superior to, measures of financial performance prepared in accordance with GAAP. There are a number of limitations related to the use of these non-GAAP financial measures versus their nearest GAAP equivalents. For example, other companies may calculate non-GAAP financial measures differently or may use other measures to evaluate their performance, all of which

171Q FY22
could reduce the usefulness of our non-GAAP financial measures as tools for comparison. Please refer to our August 3, 2021 press release for additional information as to why we believe these non-GAAP financial measures are useful to investors and others in assessing our operating performance. As required by Regulation G, we have provided a reconciliation of those measures to their most directly comparable GAAP measures, which is available in the appendix to this investor letter. However, we have not reconciled our expectations as to non-GAAP operating income (loss), non- GAAP earnings per share, non-GAAP gross margin, non-GAAP operating margin, non-GAAP expenses as a percentage of revenue, or free cash flow in future periods to their most directly comparable GAAP measure because certain items, namely stock-based compensation expense, lawsuit litigation cost and other expense, employer payroll taxes on equity incentive plans and gain or loss from lease modification, are out of our control or cannot be reasonably predicted. Accordingly, reconciliation is not available without unreasonable effort, although it is important to note that these factors could be material to our results computed in accordance with GAAP.
Operating Metrics
Active Customer Accounts. New Relic defines an Active Customer Account at the end of any period as an individual account, as identified by a unique account identifier, aggregated at the parent hierarchy level, for which New Relic has recognized any revenue in the fiscal quarter. The number of Active Customer Accounts that is reported as of a particular date is rounded down to the nearest hundred.
Number of Active Customer Accounts with Revenue Greater than $100,000. As a measure of New Relic’s ability to scale with its customers and attract large enterprises to its platform, New Relic counts the number of Active Customer Accounts for which it has recognized greater than $100,000 in revenue in the trailing 12-months.
Percentage of Revenue from Active Customer Accounts Greater than $100,000. New Relic also looks at its percentage of overall revenue it receives from its Active Customer Accounts with revenue greater than $100,000 in any given quarter as an indicator of its relative performance when selling to New Relic’s large customer relationships or its low-end of the market.
Net Revenue Retention Rate (“NRR”). NRR monitors the growth in use of New Relic’s platform by its existing active customer accounts and allows New Relic to measure the health of its business and future growth prospects. To calculate NRR, New Relic first identifies the cohort of Active Customer Accounts that were Active Customer Accounts in the same quarter of the prior fiscal year. Next, New Relic identifies the measurement period as the 12-month period ending with the period reported and the prior comparison period as the corresponding period in the prior year. NRR is the quotient obtained by dividing the revenue generated from a cohort of Active Customer Accounts in the measurement period by the revenue generated from that same cohort in the prior comparison period.

181Q FY22
Condensed Consolidated Statements of Operations(In thousands, except per share data; unaudited)
2021 2020Revenue $ 180,484 $ 162,585Cost of revenue 59,264 33,273Gross profit 121,220 129,312Operating expenses: Research and development 48,730 40,844 Sales and marketing 102,813 85,136 General and administrative 43,565 29,434Total operating expenses 195,108 155,414Loss from operations (73,888) (26,102)Other income (expense): Interest income 938 2,781 Interest expense (1,226) (6,104) Other expense (336) (395)Loss before income taxes (74,512) (29,820)Income tax provision (benefit) (453) 332Net loss $ (74,059) $ (30,152)Net loss and adjustment attributable to redeemable non-controlling interest $ (4,355) $ 396Net loss attributable to New Relic $ (78,414) $ (29,756)Net loss attributable to New Relic per share, basic and diluted $ (1.24) $ (0.50)Weighted-average shares used to compute net loss per share, basic and diluted 63,339 59,927
Three Months Ended June 30,
191Q FY22
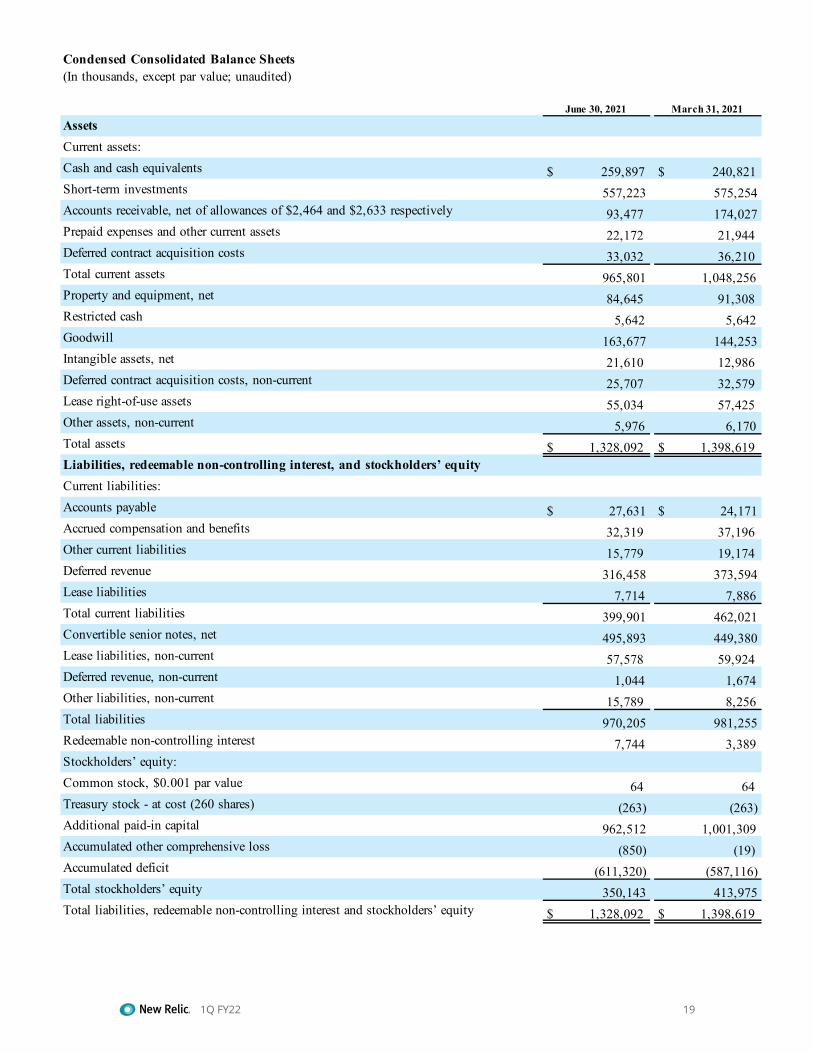
Condensed Consolidated Balance Sheets(In thousands, except par value; unaudited)
June 30, 2021 March 31, 2021AssetsCurrent assets:Cash and cash equivalents $ 259,897 $ 240,821Short-term investments 557,223 575,254Accounts receivable, net of allowances of $2,464 and $2,633 respectively 93,477 174,027Prepaid expenses and other current assets 22,172 21,944Deferred contract acquisition costs 33,032 36,210Total current assets 965,801 1,048,256Property and equipment, net 84,645 91,308Restricted cash 5,642 5,642Goodwill 163,677 144,253Intangible assets, net 21,610 12,986Deferred contract acquisition costs, non-current 25,707 32,579Lease right-of-use assets 55,034 57,425Other assets, non-current 5,976 6,170Total assets $ 1,328,092 $ 1,398,619Liabilities, redeemable non-controlling interest, and stockholders’ equityCurrent liabilities:Accounts payable $ 27,631 $ 24,171Accrued compensation and benefits 32,319 37,196Other current liabilities 15,779 19,174Deferred revenue 316,458 373,594Lease liabilities 7,714 7,886Total current liabilities 399,901 462,021Convertible senior notes, net 495,893 449,380Lease liabilities, non-current 57,578 59,924Deferred revenue, non-current 1,044 1,674Other liabilities, non-current 15,789 8,256Total liabilities 970,205 981,255Redeemable non-controlling interest 7,744 3,389Stockholders’ equity:Common stock, $0.001 par value 64 64Treasury stock - at cost (260 shares) (263) (263)Additional paid-in capital 962,512 1,001,309Accumulated other comprehensive loss (850) (19)Accumulated deficit (611,320) (587,116)Total stockholders’ equity 350,143 413,975Total liabilities, redeemable non-controlling interest and stockholders’ equity $ 1,328,092 $ 1,398,619

201Q FY22
Condensed Consolidated Statements of Cash Flows(In thousands; unaudited)
2021 2020Cash flows from operating activities:Net loss attributable to New Relic: $ (78,414) $ (29,756)Net loss and adjustment attributable to redeemable non-controlling interest $ 4,355 $ (396)Net loss: $ (74,059) $ (30,152)Adjustments to reconcile net loss to net cash provided by operating activities:Depreciation and amortization 23,025 21,051Stock-based compensation expense 42,187 31,208Amortization of debt discount and issuance costs 587 5,466Other (922) (222)Changes in operating assets and liabilities:Accounts receivable, net 80,550 36,065Prepaid expenses and other assets 18 (3,155)Deferred contract acquisition costs (190) (9,388)Lease right-of-use assets 2,692 (2,249)Accounts payable 4,894 (3,923)Accrued compensation and benefits and other liabilities (8,627) 5,573Lease liabilities (2,517) 1,347Deferred revenue (57,766) (16,473)Net cash provided by operating activities 9,872 35,148Cash flows from investing activities:Purchases of property and equipment (2,226) (8,225)Cash paid for acquisition, net of cash acquired (7,192) -Purchases of short-term investments (23,828) (73,422)Proceeds from sale and maturity of short-term investments 40,513 13,100Capitalized software development costs (2,860) (3,668)Net cash provided by (used in) investing activities 4,407 (72,215)Cash flows from financing activities:Proceeds from exercise of employee stock options 4,797 1,424Net cash provided by financing activities 4,797 1,424Net increase (decrease) in cash, cash equivalents and restricted cash 19,076 (35,643)Cash, cash equivalents and restricted cash at beginning of period 246,463 298,164Cash, cash equivalents and restricted cash at end of period $ 265,539 $ 262,521
Three Months Ended June 30,

211Q FY22
Reconciliation from GAAP to Non-GAAP Results(In thousands, except per share data; unaudited)
2021 2020Reconciliation of gross profit and gross margin:
GAAP gross profit $ 121,220 $ 129,312 Plus: Stock-based compensation 1,072 1,502Plus: Amortization of purchased intangibles 1,676 1,276Plus: Amortization of stock-based compensation capitalized in software development costs 420 239Plus: Employer payroll tax on employee equity incentive plans 52 91Non-GAAP gross profit $ 124,440 $ 132,420GAAP gross margin 67% 80%Non-GAAP adjustments 2% 1%Non-GAAP gross margin 69% 81%Reconciliation of operating expenses:
GAAP research and development $ 48,730 $ 40,844Less: Stock-based compensation expense (10,964) (8,804)Less: Employer payroll tax on employee equity incentive plans (299) (349)Non-GAAP research and development $ 37,467 $ 31,691GAAP sales and marketing $ 102,813 $ 85,136Less: Stock-based compensation expense (11,534) (13,308)Less: Employer payroll tax on employee equity incentive plans (245) (359)Less: Restructuring charges (1) (11,071) -Non-GAAP sales and marketing $ 79,963 $ 71,469GAAP general and administrative 43,565 $ 29,434Less: Stock-based compensation expense (18,617) (7,594)Less: Transaction costs related to acquisition (361) -Less: Employer payroll tax on employee equity incentive plans (217) (149)Less: Restructuring charges (1) (1,208) -Non-GAAP general and administrative $ 23,162 $ 21,691Reconciliation of income (loss) from operations and operating margin:
GAAP loss from operations $ (73,888) $ (26,102)Plus: Stock-based compensation expense 42,187 31,208Plus: Amortization of purchased intangibles 1,676 1,276Plus: Transaction costs related to acquisition 361 -Plus: Amortization of stock-based compensation capitalized in software development costs 420 239Plus: Employer payroll tax on employee equity incentive plans 813 948Plus: Restructuring charges (1) 12,279 -Non-GAAP income (loss) from operations $ (16,152) $ 7,569 GAAP operating margin -41% -16%Non-GAAP adjustments 32% 21%Non-GAAP operating margin -9% 5%Reconciliation of net income (loss):
GAAP net loss attributable to New Relic $ (78,414) $ (29,756)
Three Months Ended June 30,

221Q FY22
Plus: Stock-based compensation expense 42,187 31,208Plus: Amortization of purchased intangibles 1,676 1,276Plus: Transaction costs related to acquisition 361 -Plus: Amortization of stock-based compensation capitalized in software development costs 420 239Plus: Employer payroll tax on employee equity incentive plans 813 948Plus: Amortization of debt discount and issuance costs 587 5,466Plus: Adjustment to redeemable non-controlling interest 4,395 -Plus: Restructuring charges 12,279 -Non-GAAP net income (loss) attributable to New Relic $ (15,696) $ 9,381 Non-GAAP net income (loss) attributable to New Relic per share:
Basic $ (0.25) $ 0.16Diluted $ (0.25) $ 0.15Shares used in non-GAAP per share calculations:
Basic 63,339 59,927 Diluted 63,339 61,285 (1) Restructuring related charge for the stock-based compensation expense of $0.5 million is included on its respective line items.

231Q FY22
Reconciliation from GAAP to Non-GAAP Gross Margin and Income (Loss) from Operations (In thousands, except per share data; unaudited)
6/30/21 3/31/21 12/31/20 9/30/20 6/30/20 3/31/20Reconciliation of gross profit and gross margin:GAAP gross profit 121,220$ 115,544$ 120,372$ 120,856$ 129,312$ 131,584$ Plus: Stock-based compensation expense 1,072 1,343 1,472 1,622 1,502 1,466 Plus: Amortization of purchased intangibles 1,676 1,676 1,277 1,276 1,276 368 Plus: Amortization of stock-based compensation capitalized in software development costs 420 379 339 265 239 182 Plus: Employer payroll tax on employee equity incentive plans 52 100 36 50 91 99 Non-GAAP gross profit 124,440 119,042 123,496 124,069 132,420 133,699
GAAP gross margin 67% 67% 72% 73% 80% 82%Non-GAAP adjustments 2% 2% 2% 2% 1% 2%Non-GAAP gross margin 69% 69% 74% 75% 81% 84%Reconciliation of income (loss) from operations and operating margin:GAAP loss from operations (73,888)$ (54,308)$ (48,042)$ (42,948)$ (26,102)$ (27,480)$ Plus: Stock-based compensation expense 42,187 32,099 36,469 35,367 31,208 29,040 Plus: Amortization of purchased intangibles 1,676 1,676 1,277 1,276 1,276 368 Plus: Transaction costs related to acquisition 361 - 885 - - - Plus: Amortization of stock-based compensation capitalized in software development costs 420 379 339 265 239 182 Plus: Lawsuit litigation expense - - 217 37 - (133,699) Plus: Employer payroll tax on employee equity incentive plans 813 1,680 461 711 948 1,356 Less: Restructuring charges 12,279 - - - - - Non-GAAP income (loss) from operations (16,152)$ (18,474)$ (8,394)$ (5,292)$ 7,569$ (130,233)$
Three Months Ended
241Q FY22
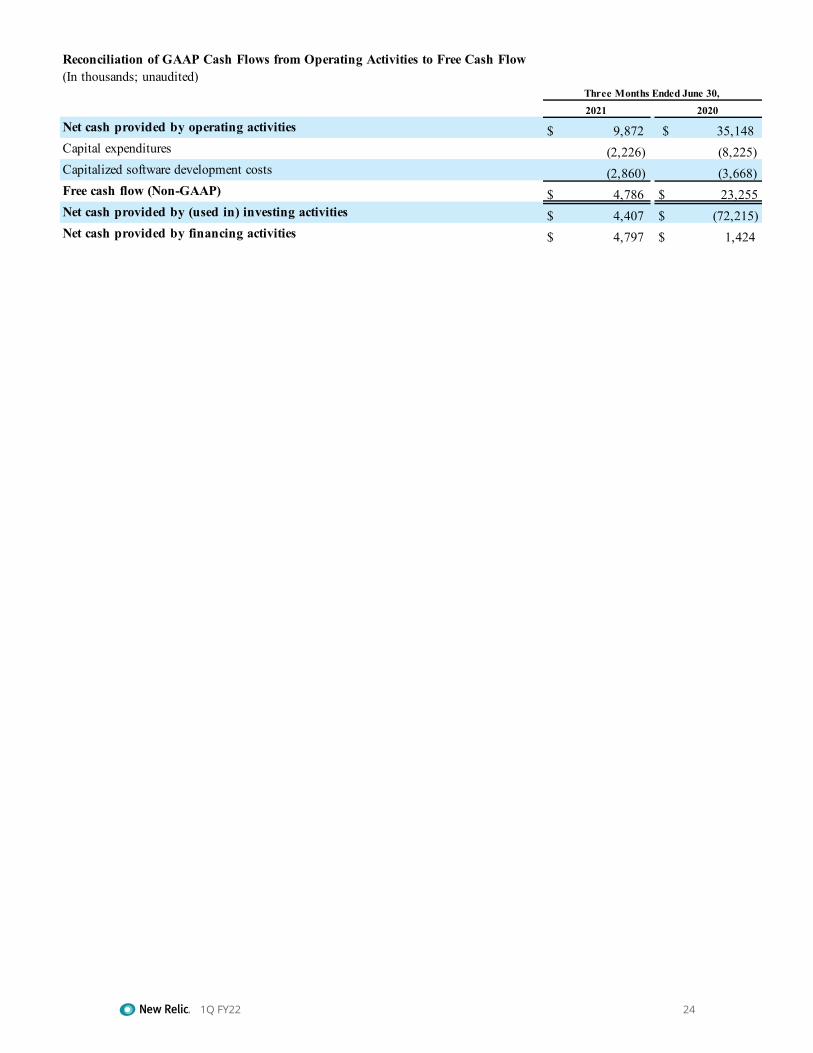
Reconciliation of GAAP Cash Flows from Operating Activities to Free Cash Flow(In thousands; unaudited) 2021 2020Net cash provided by operating activities $ 9,872 $ 35,148 Capital expenditures (2,226) (8,225)Capitalized software development costs (2,860) (3,668)Free cash flow (Non-GAAP) $ 4,786 $ 23,255Net cash provided by (used in) investing activities $ 4,407 $ (72,215)Net cash provided by financing activities $ 4,797 $ 1,424
Three Months Ended June 30,