INVESTOR DAY - Brookfield Asset Management Inc/media/Files/B/BrookField-… · · 2017-09-27We...
49
Brookfield Infrastructure Partners INVESTOR DAY SEPTEMBER 27, 2017
Transcript of INVESTOR DAY - Brookfield Asset Management Inc/media/Files/B/BrookField-… · · 2017-09-27We...

Brookfield Infrastructure Partners
INVESTOR DAY
SEPTEMBER 27 , 2017

Agenda for Today
2
A Decade of GrowthSam Pollock, Chief Executive Officer
Review of PerformanceBahir Manios, Chief Financial Officer
Looking AheadSam Pollock, Chief Executive Officer

3
A Decade of Growth

4
Starting with the past 12 months…
Increased FFO/unit by 20%
Over $2 billion of capital deployment
Increased capital backlog to $2.4 billion
Recapitalized North American gas transmission business
Telecom infrastructure sector momentum

January 2018 marks the 10th anniversary
of BIP’s inception
Let’s review what we’ve accomplished…
5

6
Polling Question #1
When did you begin following / investing in BIP?
a) 2008 – 2010
b) 2011 – 2013
c) 2014 – 2016
d) 2017

7
Over the past decade, we’ve delivered on four key objectives
Scale and diversification
Solid financial foundation
Track record of investment discipline
Profitable growth
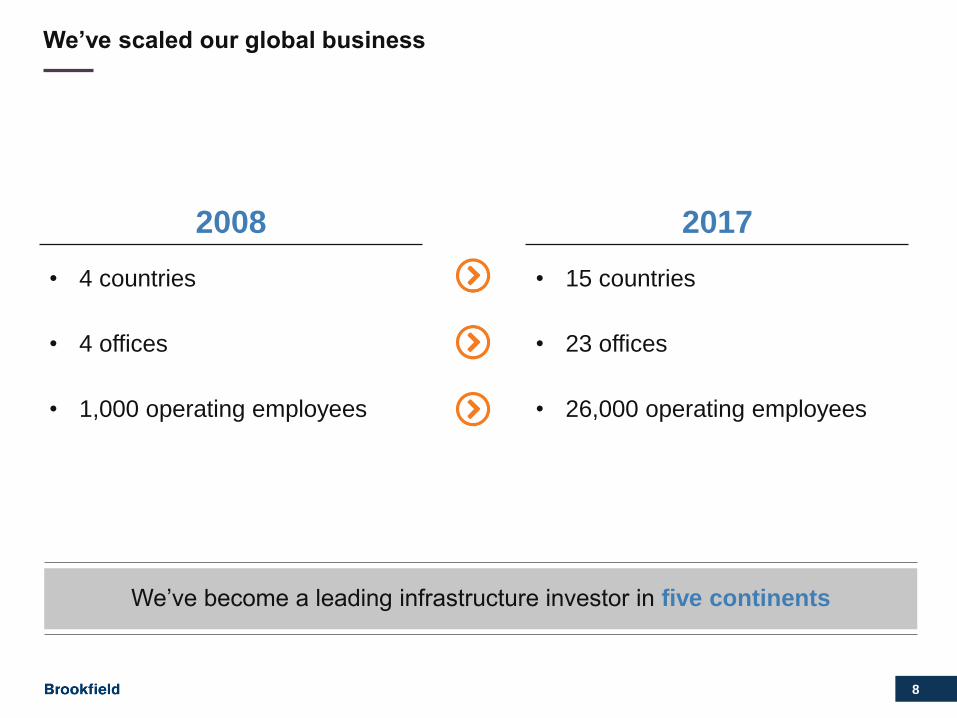
8
2008 2017
• 4 countries • 15 countries
• 4 offices • 23 offices
• 1,000 operating employees • 26,000 operating employees
We’ve scaled our global business
We’ve become a leading infrastructure investor in five continents

9
2008
We’ve diversified our operations significantly
We own and operate 35 high-quality businesses across five sectors
TIMBER
WATER
Desalination
Irrigation
Distribution
2017
COMMS INFRA
Towers
Fiber Backbone
ENERGY
Natural Gas Distribution
Gas Storage
District Energy
TRANSPORT
Railroads
Toll Roads
Ports
UTILITIES
Electricity Transmission
UTILITIES
Regulated Distribution
Regulated Transmission
Regulated Terminal

10
We’ve built up a strong financial foundation
Total liquidity today: $2.8 billion
NYSETSX
DUAL-LISTING
S&P/TSX Composite
INDEX INCLUSION
BBB+
INVESTMENT GRADE
CREDIT RATING
8 years
LONG-DEBT
MATURITY PROFILE
$2.0 billion
LINES OF CREDIT

11
BBI TAKE-
PRIVATE
$1.1B
December 2010
$1.2
$17.2
We’ve demonstrated an ability to make large value-based investments…
NTS
ACQUISITION
$1.3B
April 2017
UK REGULATED
DISTRIBUTION
MERGER
$525M
November 2012
RAIL
EXPANSION
$600M
October 2011
TDF
ACQUISITION
$415M
March 2015
MARKET
CAP ($B)

12
…and to monetize our mature assets
We seek to profitably re-deploy capital
Sold 10 businesses in the past eight years
Generated over $2 billion of gross proceeds; average IRR >25%
Launched next phase of capital recycling plan

13
As a result, we’ve profitably grown the business…
$-
$0.50
$1.00
$1.50
$2.00
$2.50
$3.00
$3.50
2009 2010 2011 2012 2013 2014 2015 2016 2017
FFO/unit Distribution/unit
1) Annualized based on Q2’17 results
CAGR
20%
FFO AND DISTRIBUTIONS PER UNIT
CAGR
12%
1
14
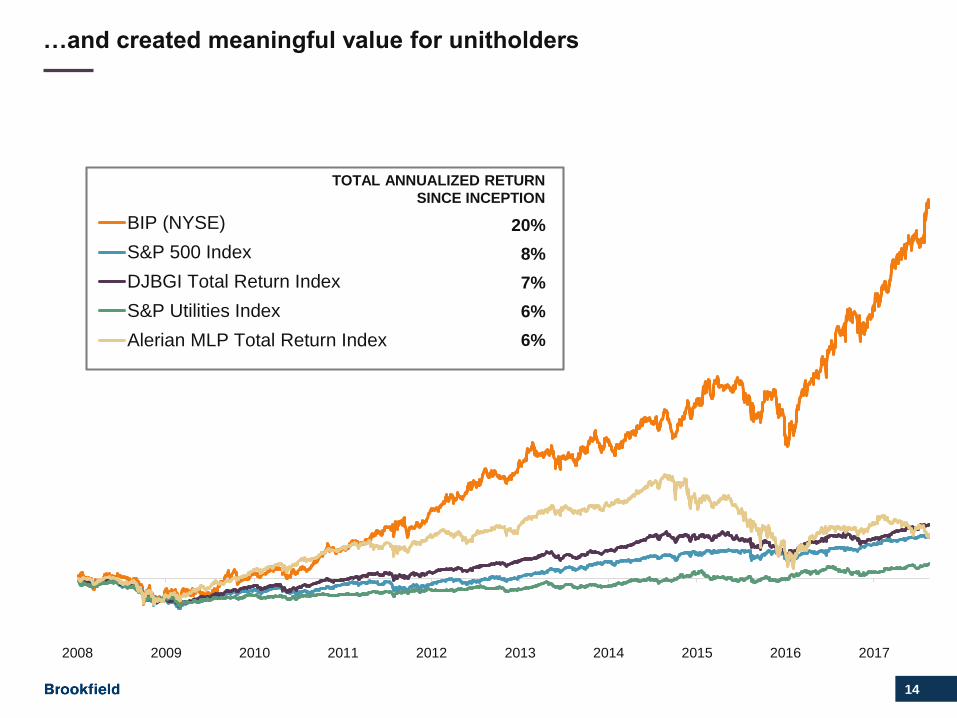
2008 2009 2010 2011 2012 2013 2014 2015 2016 2017
BIP (NYSE)
S&P 500 Index
DJBGI Total Return Index
S&P Utilities Index
Alerian MLP Total Return Index
…and created meaningful value for unitholders
TOTAL ANNUALIZED RETURN
SINCE INCEPTION
20%
8%
7%
6%
6%
15
Review of Performance

16
BIP Financial Health Check
EBITDA margins
Balance sheet strength
Financial risk
management
17
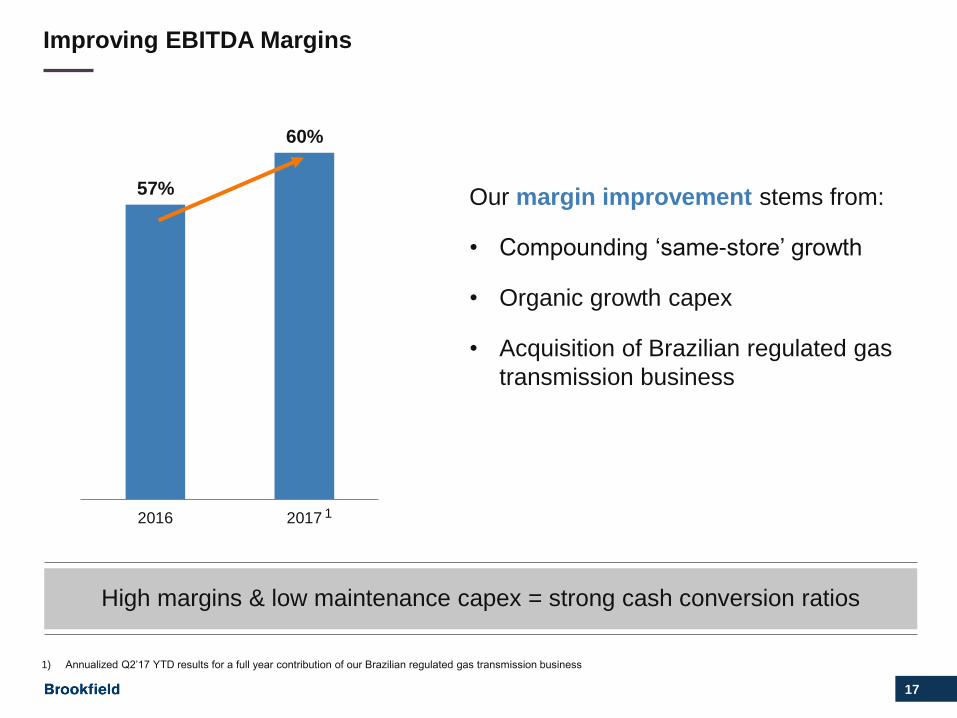
Improving EBITDA Margins
High margins & low maintenance capex = strong cash conversion ratios
1) Annualized Q2’17 YTD results for a full year contribution of our Brazilian regulated gas transmission business
Our margin improvement stems from:
• Compounding ‘same-store’ growth
• Organic growth capex
• Acquisition of Brazilian regulated gas
transmission business
57%
60%
2016 2017 1

18
Our balance sheet and credit profile are in great shape…
<15%Recourse
debt
$2.8BCorporate
liquidity
30%Debt maturing
in next five years
• Interest coverage ratio at corporate level increased to 20x
• 90% of FFO structured at investment grade metrics

19
…and we continue to actively manage our financial risks
Further insulated business from rising rates
Fully hedged on all developed market currencies

2020
How should investors assess
our performance as
allocators of capital?
This year’s discussion

21
Polling Question #2
How do you evaluate BIP?
a) Balance sheet revaluations
b) Cash flow metrics
c) Return on Invested Capital
d) Accounting earnings metrics
e) Distribution yield & growth

22
Return on Invested Capital (ROIC) is a popular metric with investors
However…it is only helpful if measured and analyzed correctly
Useful metric
Measures return a company generates when
deploying capital

23
How is it calculated?
Issues with the above:
Two of the metrics above utilize a return on assets calculation
All of above calculations use accounting-related measures
vs. cash flows and paid-in capital
CALCULATION OF ROICBIP ROIC
(FY2016)
BloombergConsolidated EBIT/
Consolidated Equity + Debt + Deferred Taxes2%
CapIQNet income attributable to LP’s/
Partnership Capital attributable to LP’s7%
FactsetNet income attributable to LP’s/
Consolidated Equity + Debt2%

24
How should it be calculated?
1) Adjusted for returns of capital
NUMERATOR
AFFO1
vs.
Net Income
DENOMINATOR
Invested Capital
vs.
Partnership Capital

25
Numerator: AFFO vs. Net Income
AFFO is a more meaningful measurement of sustainable cash generated
• Similar but for one key difference – D&A expenses vs. maintenance capex
CUMULATIVE
2010-2016
Net income attributable to partnership $ 1,621
Add back or deduct the following:
Depreciation and amortization 2,631
Deferred income taxes 52
Mark-to-market gains and losses (95)
FFO 4,209
Maintenance capital expenditures (817)
AFFO 3,392
Less: Return of Capital (163)
Adjusted AFFO $ 3,229
(in US$ millions, net to BIP)
Insignificant
26
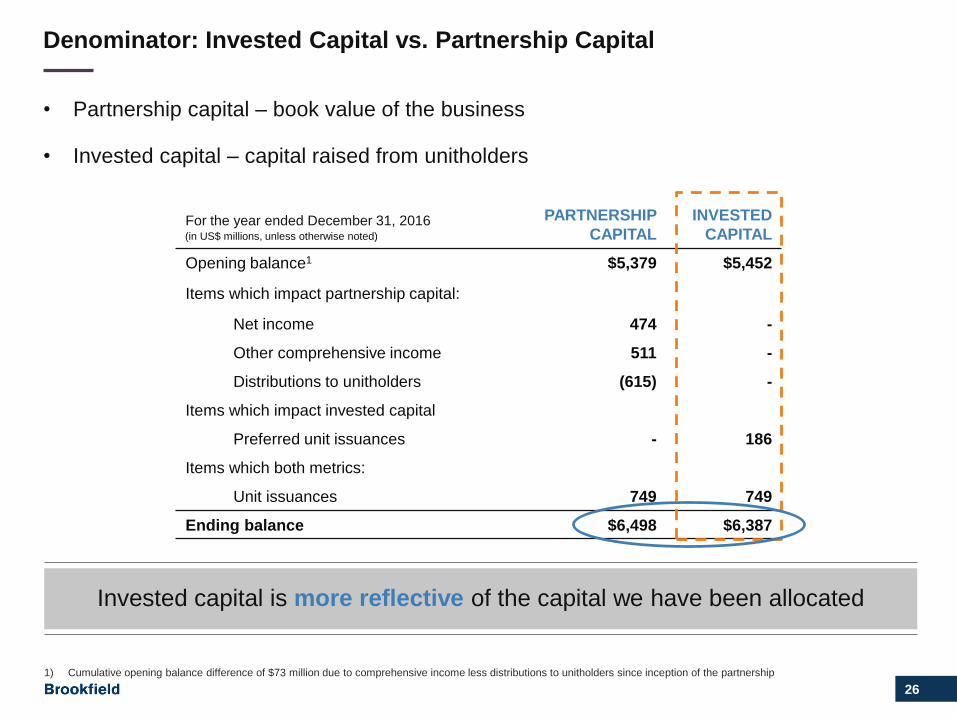
Denominator: Invested Capital vs. Partnership Capital
Invested capital is more reflective of the capital we have been allocated
• Partnership capital – book value of the business
• Invested capital – capital raised from unitholders
1) Cumulative opening balance difference of $73 million due to comprehensive income less distributions to unitholders since inception of the partnership
For the year ended December 31, 2016 PARTNERSHIP
CAPITAL
INVESTED
CAPITAL
Opening balance1 $5,379 $5,452
Items which impact partnership capital:
Net income 474 -
Other comprehensive income 511 -
Distributions to unitholders (615) -
Items which impact invested capital
Preferred unit issuances - 186
Items which both metrics:
Unit issuances 749 749
Ending balance $6,498 $6,387
(in US$ millions, unless otherwise noted)

27
BIP’s ROIC Profile
Average ROIC of ~13%
1) Reflects annualized Q2’17 YTD results pro forma for a full year contribution of our Brazilian regulated gas transmission business
2) Weighted average invested capital for the relevant period
Actual Pro forma
(in US$ millions, unless otherwise noted) 2012 2013 2014 2015 2016 20171
FFO $ 462 $ 682 $ 724 $ 808 $ 944 $1,256
Maintenance Capital (107) (129) (131) (136) (173) (206)
Return of Capital (3) (35) (36) (41) (48) (124)
Adjusted AFFO 352 518 557 631 723 926
Invested Capital2 $3,725 $4,255 $4,397 $5,101 $5,530 $6,503
ROIC 10% 12% 13% 13% 13% 14%
Track record of prior years returns and current year profile

28
So what do these results mean?
BIP generates a strong return on invested capital
• Average ROIC of 13%
Growing because ROIC exceeds 13%
• Reflecting current cash on cash returns + future growth

29
Returns over past 5+ years
This is an accurate reflection of ROIC as it reflects the embedded organic growth profile of our business
= ~20%Δ in invested capital
$2.8 billion
Δ in AFFO$574 million

30
Embedded organic growth is built up as follows…
Inflation and GDP growth alone are expected to generate ~4-6% FFO/unit growth
over the long term
Volume Upside
from GDP
Growth
(1-2%)
Cash Flows
Reinvested
(2-3%)
Inflationary
Price Increases
(3-4%)
FFO/unit
Growth
(6-9%)
=++
4-6%
75% of EBITDA
indexed to
inflation
35-50% of EBITDA
benefits from
GDP-linked revenue
growth

31
…and is reflected by our same-store EBITDA growth
This trend should continue for the next five years
1) On a constant currency and ownership basis and adjusting for the impact of new equity injections in the business since inception
2012 2013 2014 2015 2016 2017
SAME-STORE1 EBITDA CAGR
4%UTILITIES
6%TRANSPORT
2%ENERGY
4%COMM INFRA
5%CAGR

32
BIP has provided investors with compelling risk-adjusted returns on invested capital
We have deployed a significant amount of capital
Investing at ~20% returns ─ combination of:
• Cash on cash return of ~13%
• Embedded growth in business
Expect to continue delivering similar returns in the future

33
Looking Ahead

34
Polling Question #3
What trends will drive infrastructure investment
opportunities in the next 10 years?

35
Trends we believe will shape future opportunities
Low-carbon,
thermal energy
Unprecedented
data usage
Economic
growth in
Asia
Urbanization
Water
Scarcity
Smart
cities5G
Technologies
Private
investment in
infrastructure
Self-driving
and electric
cars
Aging public
infrastructure

36
We’ve grouped these trends into four opportunity sets
Water infrastructure
Municipal infrastructure
Data infrastructure
Investment in Asia

37
Data is the fastest growing major commodity
80%
130%
180%
230%
280%
2016 2017 2018 2019 2020 2021
Index (%)
Data Oil & Gas Electricity Shipping Containers
Freight Wheat Soybeans Steel
DEMAND GROWTH IN SELECTED COMMODITIES (2016 – 2021)1
See endnotes on page 48

38
Exponential global growth in data usage creating opportunities
Massive global investment in data infrastructure required to keep pace
• Telecom towers
• Fibre
• Data centers
OPPORTUNITY SET
• Mobile devices
• Over-the-top (OTT) video
• Internet of Things
DRIVERS

39
Smart Safety & Security Smart Infrastructure Smart Homes
US $226B cumulative safe city
market by 2021E
US $712B smart ICT
infrastructure market by 2020E
US $405B smart home market by
2030E
Smart Energy Smart Buildings Smart Mobility
US $137B cumulative smart
energy market by 2024E
US $101B smart building market
by 2021E
US $1.5T future mobility market
by 2030E
There is an increasing level of investment in municipal infrastructure
Potential US$3 trillion+ market by mid-2020
Source: Bank of America Merrill Lynch Equity Research March 2017

40
Focus on ‘smart cities’ to maximize efficiency of critical infrastructure
• District energy
• Smart meters
• Transit systems
• LED lighting
OPPORTUNITY SET
• Urbanization
• Congestion
• Pollution/climate change
DRIVERS

41
Global water consumption double the rate of population growth
By 2050:
• 3.9 billion people living under severe water stress2
• $6.7 trillion global funding gap for water supply and sanitation3
U.S. government funding for water and wastewater infrastructure
down 22% between 2009 and 20144
See endnotes on page 48
OPPORTUNITY SET
• Water supply (refurbishment of aging infrastructure and desalination)
• Water transportation (irrigation)
• Recycling (‘graywater’ water purification)

42
Building a foundation for Asia’s fast-growing economies
5.7% GDP growth per capita5
$26 trillion to be invested in
infrastructure by 20306
In the next 30 years, 34% of the
world’s population growth will occur
in Asia7
Brookfield office locations
• Data infrastructure
• Transportation
• Water and utilities
OPPORTUNITY SET
See endnotes on page 48

43
Our business strategy for the next decade… no change
PATIENCE
Be selective
INNOVATE
Creative deal structuring
DO THE SMALL THINGS WELL
Focus on organic growth and tuck-ins
BE DECISIVE
Pursue the right opportunities with conviction
EXECUTE DISPOSITIONS WELL
Recycle mature assets at attractive valuations

44
We believe the next 10 years should be as successful as the first 10
Strong foundation in place
‒ Global presence and reach
‒ Access to capital
‒ Established investment engine
Outlook for supply of opportunities is stronger

45
Looking out 10 years
2028
25%
25%
10%
10%
GEOGRAPHIES SECTORS
AsiaData
Water
Municipal

46
Pulling it all together
✓ First decade of concrete growth
✓ Solid return on invested capital
✓ New trends driving opportunities
BIP – 10
YEARS
AHEAD

47
Q&A

48
Endnotes
1. Data compiled from Cisco, EIA, Markets & Markets, DOT, OECD, Statistica
2. Mountford, Helen. “Water: The Environmental Outlook to 2050.” OECD, 2011.
3. Gurría, Angel. “Financing Infrastructure for a Water Secure World.” High-Level Panel on Infrastructure Financing for a Water Secure World . Paris, France.
4. “2017 Infrastructure Report Card.” American Society of Civil Engineers, 2017.
5. Asian Development Outlook: Asia's Potential Growth. Asian Development Bank, 2016.
6. Bank, Asian Development. “Meeting Asia's Infrastructure Needs: Highlights.” Meeting Asia's Infrastructure Needs: Highlights, 2017.
7. World Population Prospects. United Nations, 2017.

49
Important Cautionary Notes
All amounts are in U.S. dollars unless otherwise
specified. Unless otherwise indicated, the statistical and
financial data in this presentation is presented as of
June 30, 2017.
CAUTIONARY STATEMENT REGARDING FORWARD-
LOOKING STATEMENTS AND INFORMATION
This presentation contains “forward-looking information”
within the meaning of Canadian provincial securities laws
and “forward-looking statements” within the meaning of
Section 27A of the U.S. Securities Act of 1933, as
amended, Section 21E of the U.S. Securities Exchange
Act of 1934, as amended, “safe harbor” provisions of the
United States Private Securities Litigation Reform Act of
1995 and in any applicable Canadian securities
regulations. Forward-looking statements include
statements that are predictive in nature, depend upon or
refer to future events or conditions, and include
statements regarding our and our subsidiaries’
operations, business, financial condition, expected
financial results, performance, prospects, opportunities,
priorities, targets, goals, ongoing objectives, strategies
and outlook, as well as the outlook for North American
and international economies for the current fiscal year
and subsequent periods, and include, but are not limited
to, statements regarding our asset management. In
some cases, forward-looking statements can be identified
by terms such as “expects,” “anticipates,” “plans,”
“believes,” “estimates,” “seeks,” “intends,” “targets,”
“projects,” “forecasts” or negative versions thereof and
other similar expressions, or future or conditional verbs
such as “may,” “will,” “should,” “would” and “could.”
Although we believe that our anticipated future results,
performance or achievements expressed or implied by the
forward-looking statements and information are based
upon reasonable assumptions and expectations, the
reader should not place undue reliance on forward-
looking statements and information because they involve
known and unknown risks, uncertainties and other factors,
many of which are beyond our control, which may cause
our and our subsidiaries’ actual results, performance or
achievements to differ materially from anticipated future
results, performance or achievements expressed or
implied by such forward-looking statements and
information.
Factors that could cause actual results to differ materially
from those contemplated or implied by forward-looking
statements include, but are not limited to: the impact or
unanticipated impact of general economic, political and
market factors in the countries in which we do business;
the fact that our success depends on market demand for
our products; the behavior of financial markets, including
fluctuations in interest rates and foreign exchanges rates;
changes in inflation rates in North America and
international markets; the performance of global equity
and capital markets and the availability of equity and debt
financing and refinancing within these markets; strategic
actions including dispositions; the competitive market for
acquisitions and other growth opportunities; our ability to
satisfy conditions precedent required to complete such
acquisitions; our ability to effectively integrate acquisitions
into existing operations and attain expected benefits; the
outcome and timing of various regulatory, legal and
contractual issues; changes in accounting policies and
methods used to report financial condition (including
uncertainties associated with critical accounting
assumptions and estimates); the effect of applying future
accounting changes; business competition; operational
and reputational risks; technological change; changes in
government regulation and legislation within the countries
in which we operate; changes in tax laws; catastrophic
events, such as earthquakes and hurricanes; the possible
impact of international conflicts and other developments
including terrorist acts and cyberterrorism; and other risks
and factors detailed from time to time in our documents
filed with the securities regulators in Canada and the
United States.
We caution that the foregoing list of important factors that
may affect future results is not exhaustive. When relying
on our forward-looking statements, investors and others
should carefully consider the foregoing factors and other
uncertainties and potential events. Except as required by
law, we undertake no obligation to publicly update or
revise any forward-looking statements or information in
this presentation, whether as a result of new information,
future events or otherwise.
CAUTIONARY STATEMENT REGARDING USE OF
NON-IFRS MEASURES
This presentation contains references to financial metrics
that are not calculated in accordance with, and do not
have any standardized meaning prescribed by,
International Financial Reporting Standards (“IFRS”). We
believe such non-IFRS measures including, but not
limited to, funds from operations (“”FFO”) and invested
capital, are useful supplemental measures that may assist
investors and others in assessing our financial
performance and the financial performance of our
subsidiaries. As these non-IFRS measures are not
generally accepted accounting measures under IFRS,
references to FFO and invested capital, as examples,
are therefore unlikely to be comparable to similar
measures presented by other issuers and entities. These
non-IFRS measures have limitations as analytical tools.
They should not be considered as the sole measure of
our performance and should not be considered in isolation
from, or as a substitute for, analysis of our financial
statements prepared in accordance with IFRS. For a more
fulsome discussion regarding our use of non-IFRS
measures and their reconciliation to the most directly
comparable IFRS measures refer to our documents filed
with the securities regulators in Canada and the United
States.