Investor Day 2015 -
59
Aspen Technology, Inc. Investor Day Antonio Pietri – President and Chief Executive Officer May 4 th , 2015
-
Upload
jason-want -
Category
Documents
-
view
102 -
download
1
Transcript of Investor Day 2015 -
Aspen Technology, Inc. Investor Day Antonio Pietri – President and Chief Executive Officer
May 4th, 2015
© 2015 Aspen Technology, Inc. All rights reserved 2
Safe Harbor Statement
These slides may contain forward-looking statements for purposes of the safe harbor
provisions of the Private Securities Litigation Reform Act of 1995. Actual results may vary
significantly from AspenTech’s expectations based on a number of risks and uncertainties,
including, without limitation, the risk factors described in AspenTech’s most recent Annual
Report on Form 10-K and any subsequent quarterly reports on Form 10Q, each as filed with
the U.S. Securities and Exchange Commission. AspenTech cannot guarantee any future
results, levels of activity, performance, or achievements. Further, AspenTech expressly
disclaims any current intention to update any forward-looking statements after the date hereof.
© 2015 Aspen Technology, Inc. All rights reserved 3
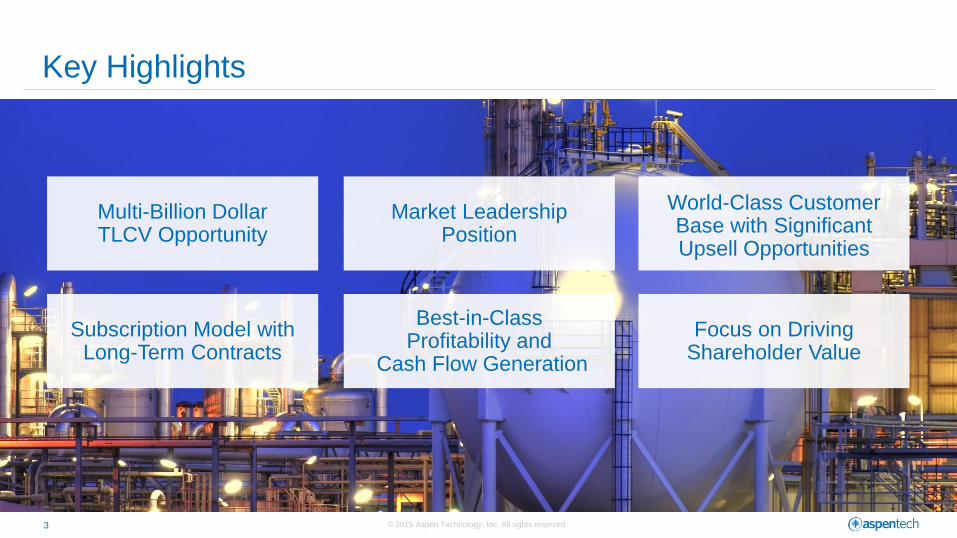
Key Highlights
Multi-Billion Dollar TLCV Opportunity
Market Leadership Position
World-Class Customer Base with Significant Upsell Opportunities
Subscription Model with Long-Term Contracts
Best-in-Class Profitability and
Cash Flow Generation
Focus on Driving Shareholder Value
© 2015 Aspen Technology, Inc. All rights reserved 4
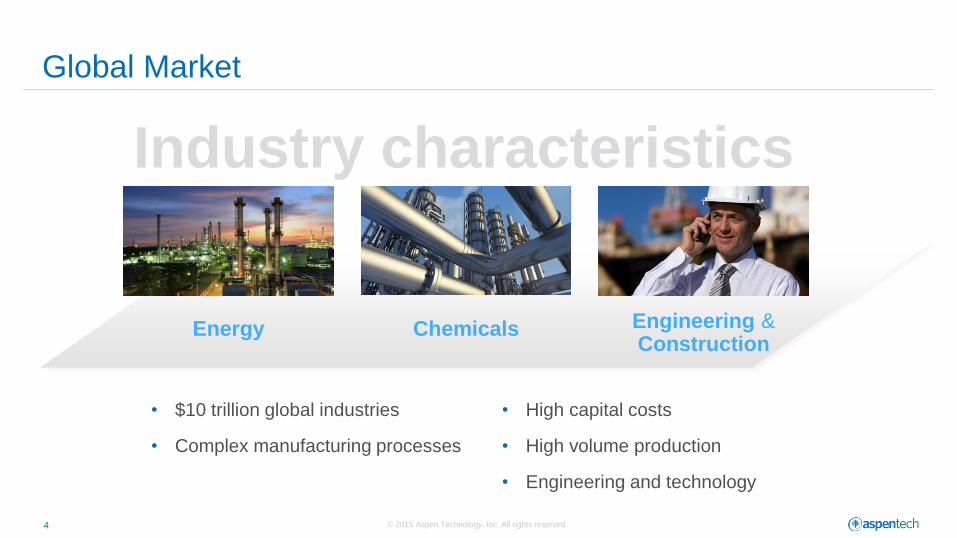
Global Market
Industry characteristics
• $10 trillion global industries
• Complex manufacturing processes
• High capital costs
• High volume production
• Engineering and technology
Energy Chemicals Engineering & Construction
© 2015 Aspen Technology, Inc. All rights reserved 5
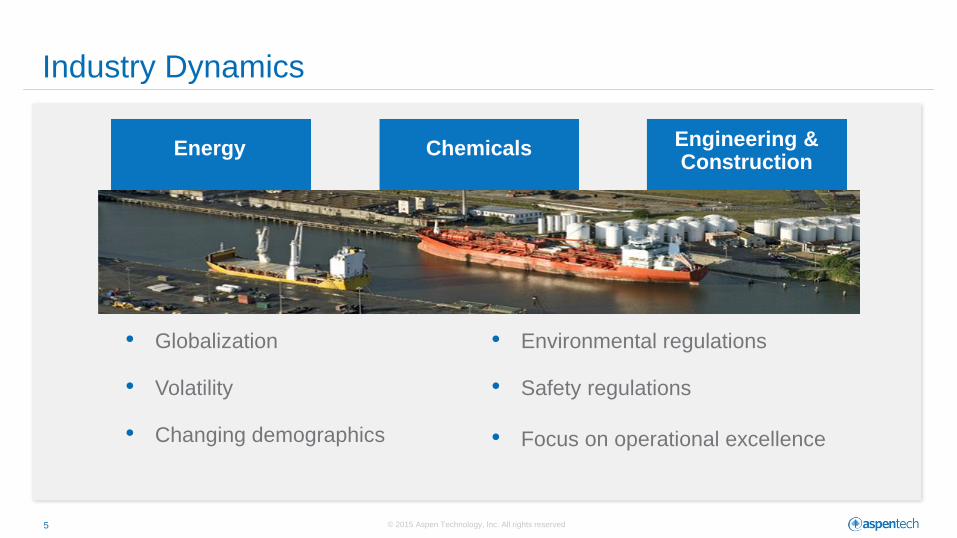
• Globalization
• Volatility
• Changing demographics
Energy Chemicals Engineering & Construction
• Environmental regulations
• Safety regulations
• Focus on operational excellence
Industry Dynamics
© 2015 Aspen Technology, Inc. All rights reserved 6
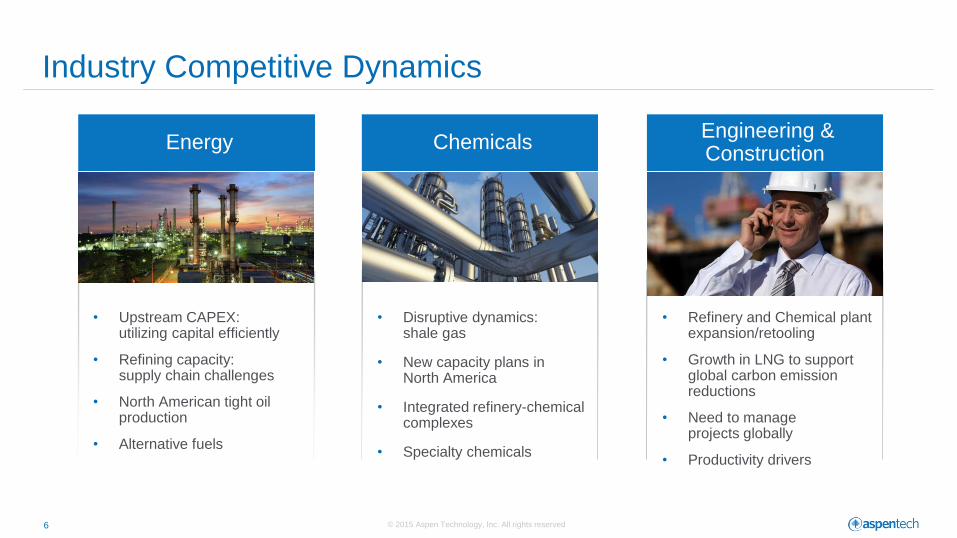
Industry Competitive Dynamics
Energy
• Upstream CAPEX: utilizing capital efficiently
• Refining capacity: supply chain challenges
• North American tight oil production
• Alternative fuels
• Disruptive dynamics: shale gas
• New capacity plans in North America
• Integrated refinery-chemical complexes
• Specialty chemicals
Chemicals
• Refinery and Chemical plant expansion/retooling
• Growth in LNG to support global carbon emission reductions
• Need to manage projects globally
• Productivity drivers
Engineering & Construction
© 2015 Aspen Technology, Inc. All rights reserved 7
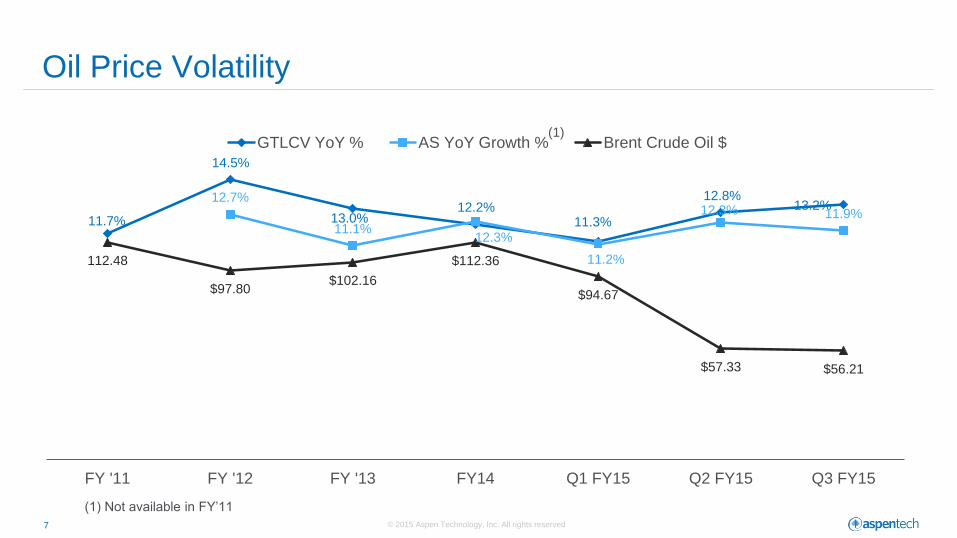
Oil Price Volatility
11.7%
14.5%
13.0% 12.2%
11.3%
12.8% 13.2%
12.7%
11.1% 12.3%
11.2%
12.3% 11.9%
112.48
$97.80 $102.16
$112.36
$94.67
$57.33 $56.21
FY '11 FY '12 FY '13 FY14 Q1 FY15 Q2 FY15 Q3 FY15
GTLCV YoY % AS YoY Growth % Brent Crude Oil $(1)
(1) Not available in FY’11
© 2015 Aspen Technology, Inc. All rights reserved 8
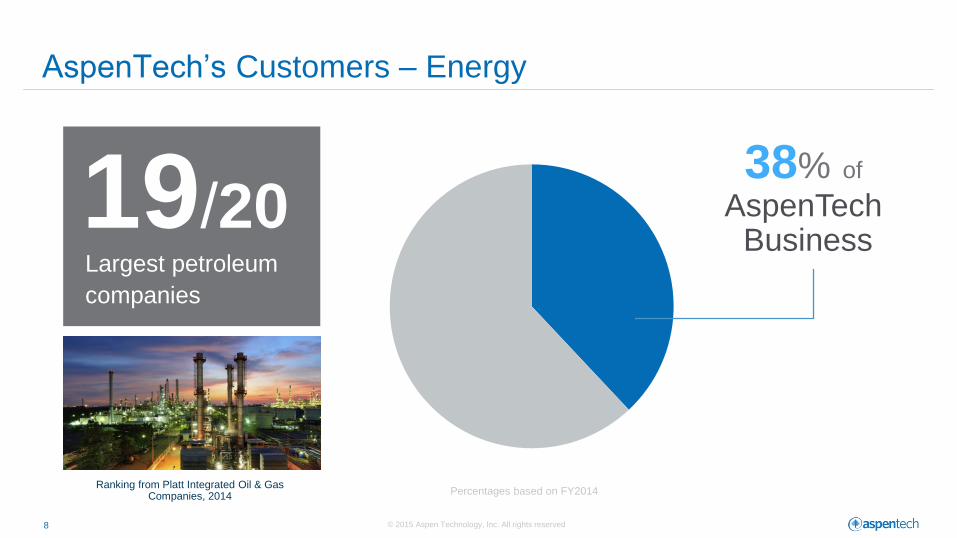
AspenTech’s Customers – Energy
38% of
AspenTech Business
Ranking from Platt Integrated Oil & Gas
Companies, 2014
Largest petroleum
companies
19/20
Percentages based on FY2014
© 2015 Aspen Technology, Inc. All rights reserved 9
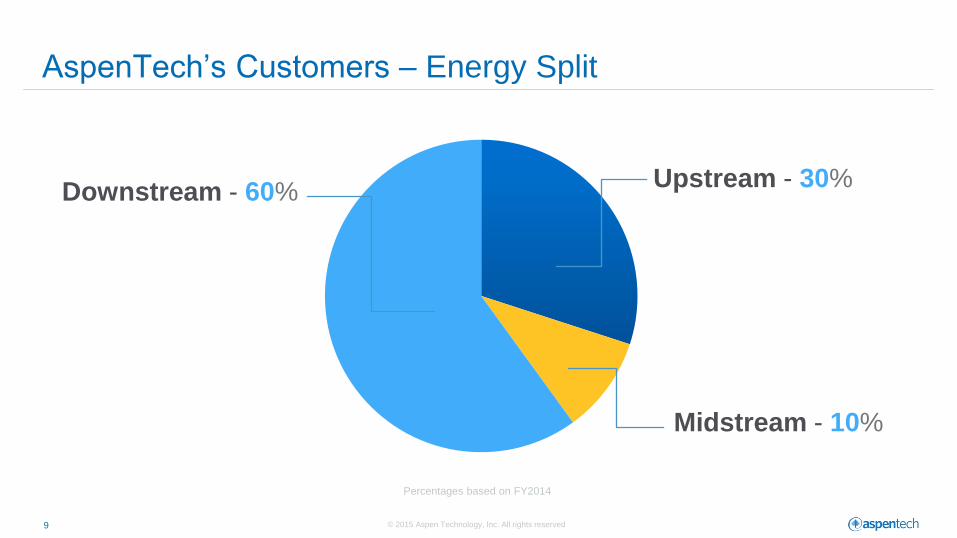
AspenTech’s Customers – Energy Split
Percentages based on FY2014
Downstream - 60%
Midstream - 10%
Upstream - 30%
© 2015 Aspen Technology, Inc. All rights reserved 10
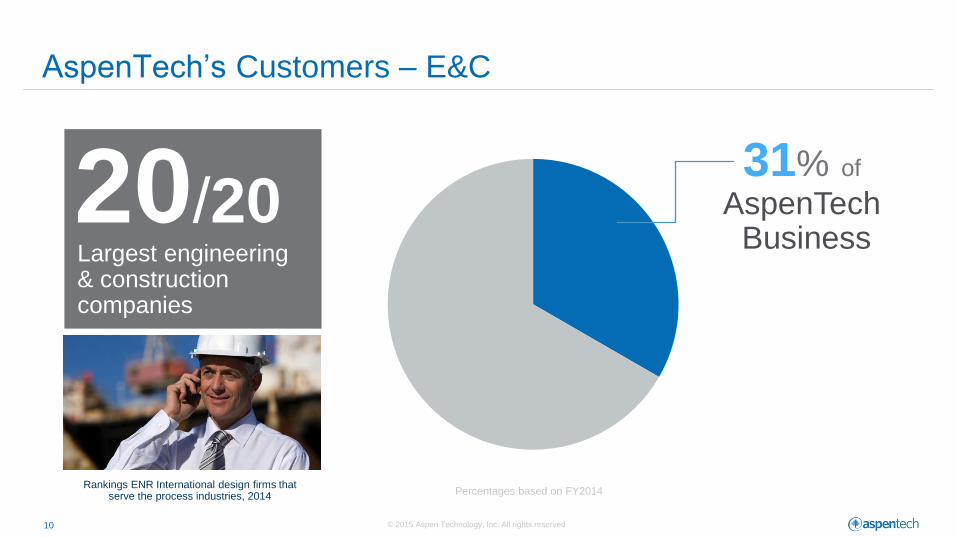
AspenTech’s Customers – E&C
31% of
AspenTech Business
20/20 Largest engineering & construction companies
Rankings ENR International design firms that
serve the process industries, 2014
Percentages based on FY2014
© 2015 Aspen Technology, Inc. All rights reserved 11
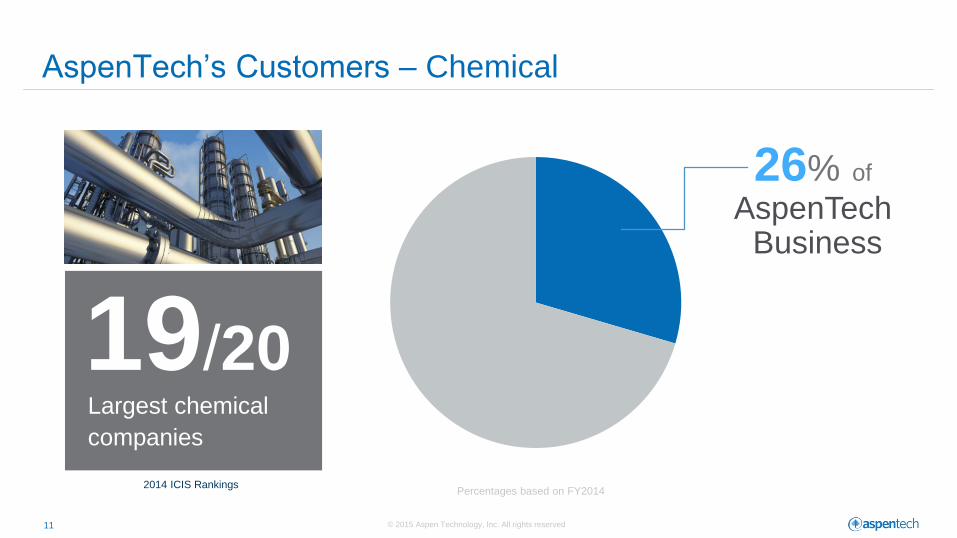
AspenTech’s Customers – Chemical
26% of
AspenTech Business
Largest chemical
companies
19/20
2014 ICIS Rankings
Percentages based on FY2014
© 2015 Aspen Technology, Inc. All rights reserved 12
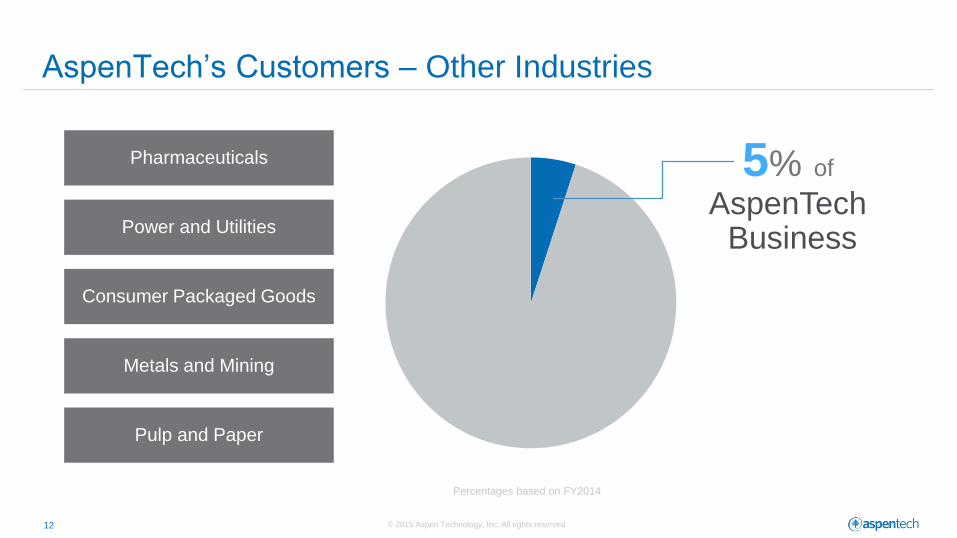
Pharmaceuticals
AspenTech’s Customers – Other Industries
5% of
AspenTech Business
Percentages based on FY2014
Power and Utilities
Consumer Packaged Goods
Metals and Mining
Pulp and Paper
© 2015 Aspen Technology, Inc. All rights reserved 13
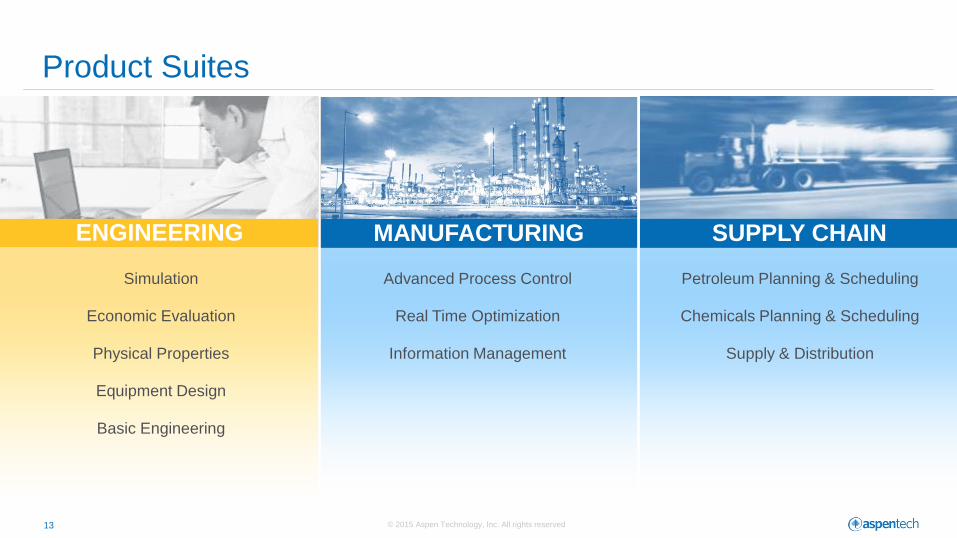
Product Suites
ENGINEERING MANUFACTURING SUPPLY CHAIN
Simulation
Economic Evaluation
Physical Properties
Equipment Design
Basic Engineering
Advanced Process Control
Real Time Optimization
Information Management
Petroleum Planning & Scheduling
Chemicals Planning & Scheduling
Supply & Distribution
© 2015 Aspen Technology, Inc. All rights reserved 14
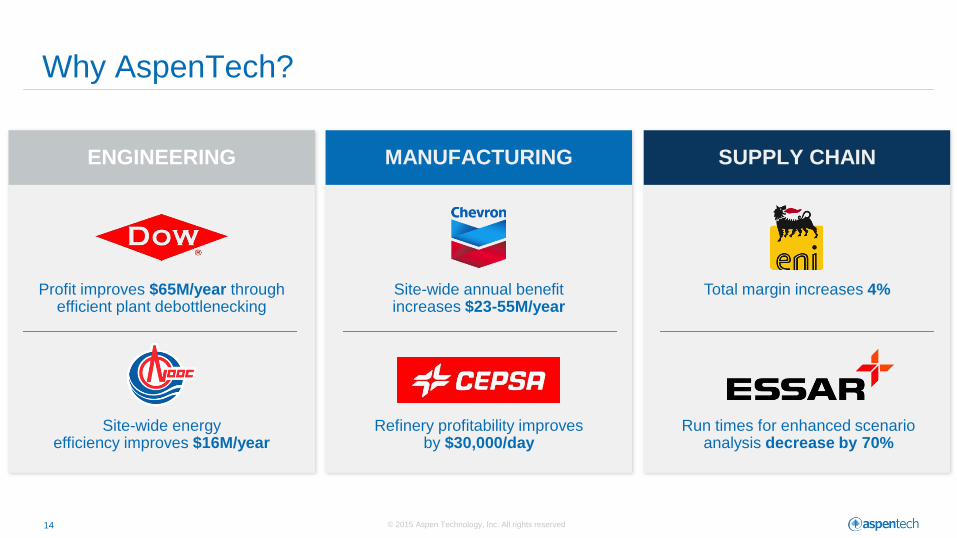
Why AspenTech?
ENGINEERING
Profit improves $65M/year through efficient plant debottlenecking
Site-wide energy efficiency improves $16M/year
MANUFACTURING
Refinery profitability improves by $30,000/day
Site-wide annual benefit increases $23-55M/year
SUPPLY CHAIN
Total margin increases 4%
Run times for enhanced scenario analysis decrease by 70%
© 2015 Aspen Technology, Inc. All rights reserved 15
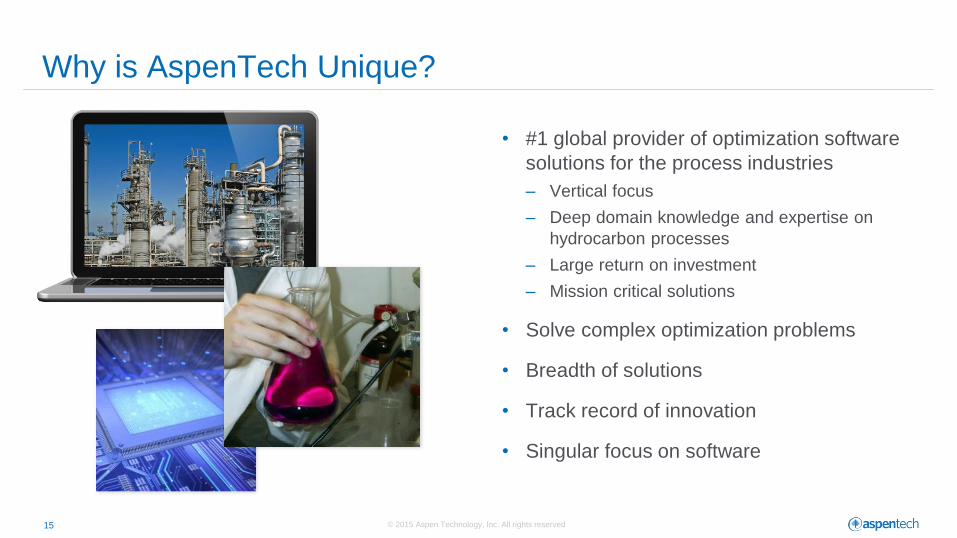
Why is AspenTech Unique?
• #1 global provider of optimization software
solutions for the process industries
– Vertical focus
– Deep domain knowledge and expertise on
hydrocarbon processes
– Large return on investment
– Mission critical solutions
• Solve complex optimization problems
• Breadth of solutions
• Track record of innovation
• Singular focus on software
© 2015 Aspen Technology, Inc. All rights reserved 16
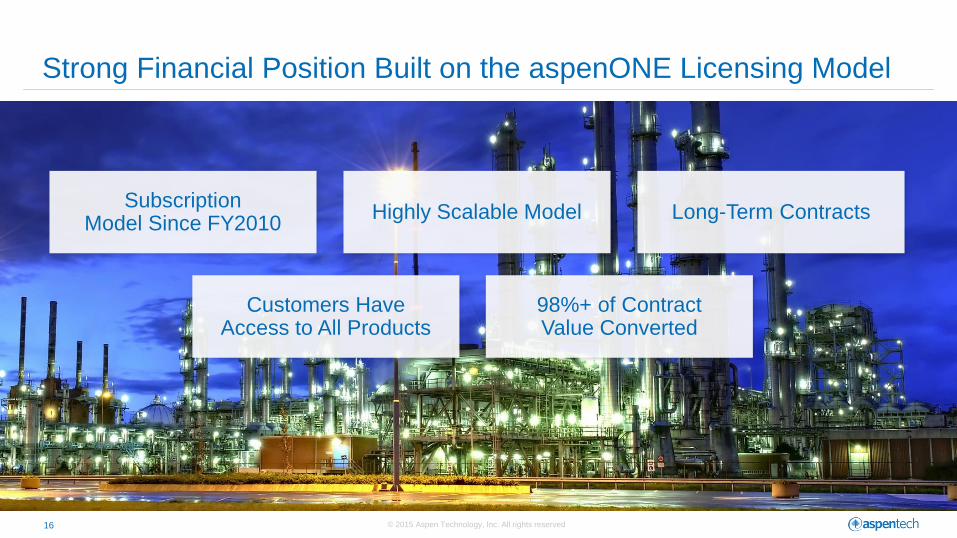
Strong Financial Position Built on the aspenONE Licensing Model
Subscription Model Since FY2010
Highly Scalable Model Long-Term Contracts
Customers Have Access to All Products
98%+ of Contract Value Converted
© 2015 Aspen Technology, Inc. All rights reserved 17
Growth Strategy
Usage and Product Adoption
© 2015 Aspen Technology, Inc. All rights reserved 18
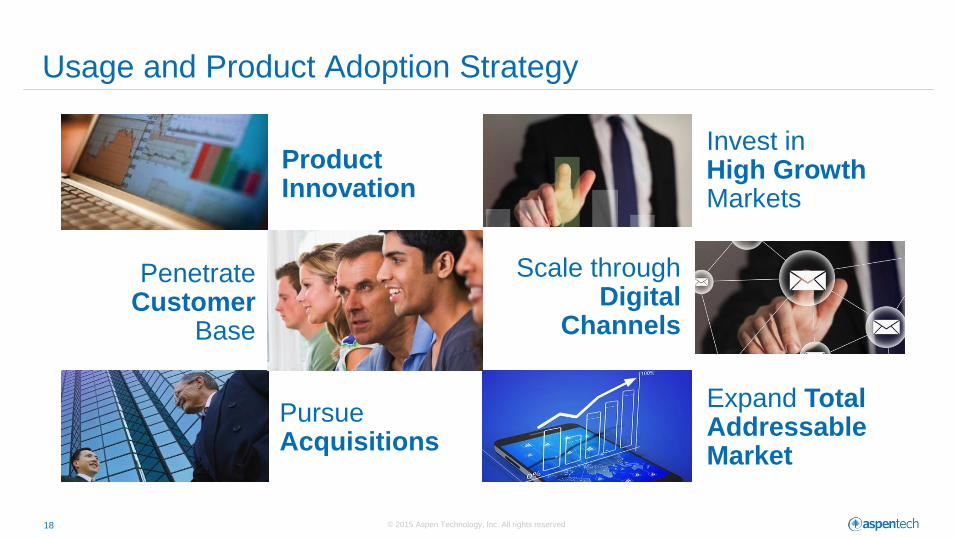
Usage and Product Adoption Strategy
Invest in High Growth Markets
Pursue Acquisitions
Product Innovation
Scale through Digital
Channels
Expand Total Addressable Market
Penetrate Customer
Base
© 2015 Aspen Technology, Inc. All rights reserved 19
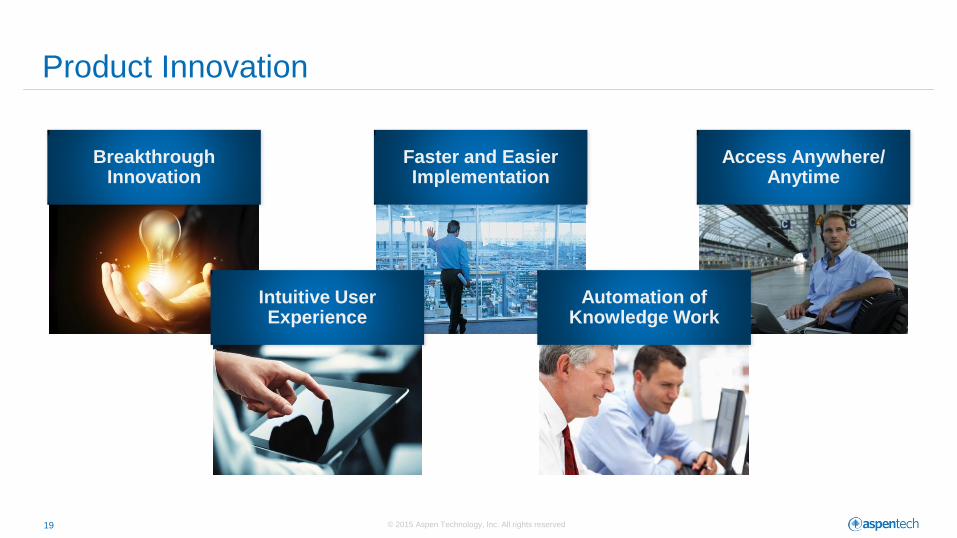
Product Innovation
Access Anywhere/ Anytime
Faster and Easier Implementation
Automation of Knowledge Work
Breakthrough Innovation
Intuitive User Experience
© 2015 Aspen Technology, Inc. All rights reserved 20
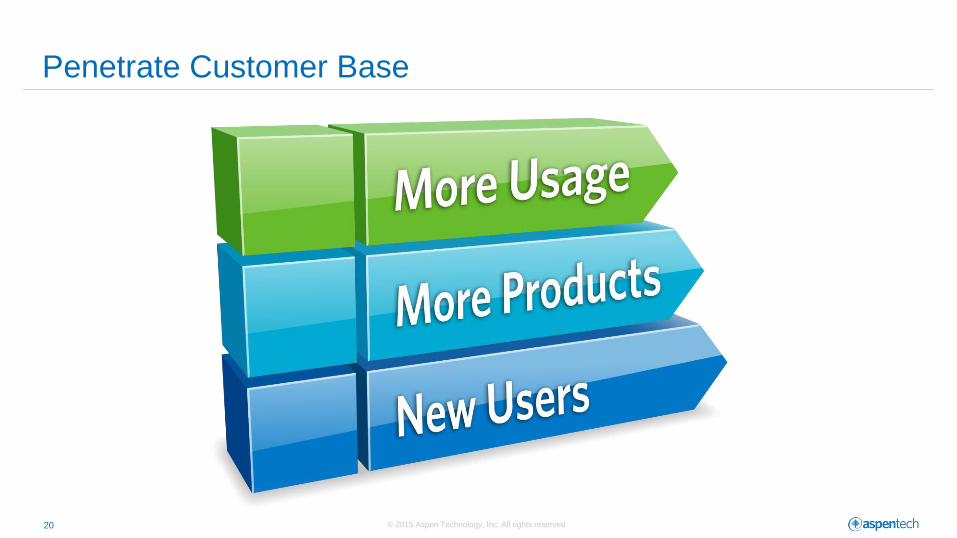
Penetrate Customer Base
© 2015 Aspen Technology, Inc. All rights reserved 21
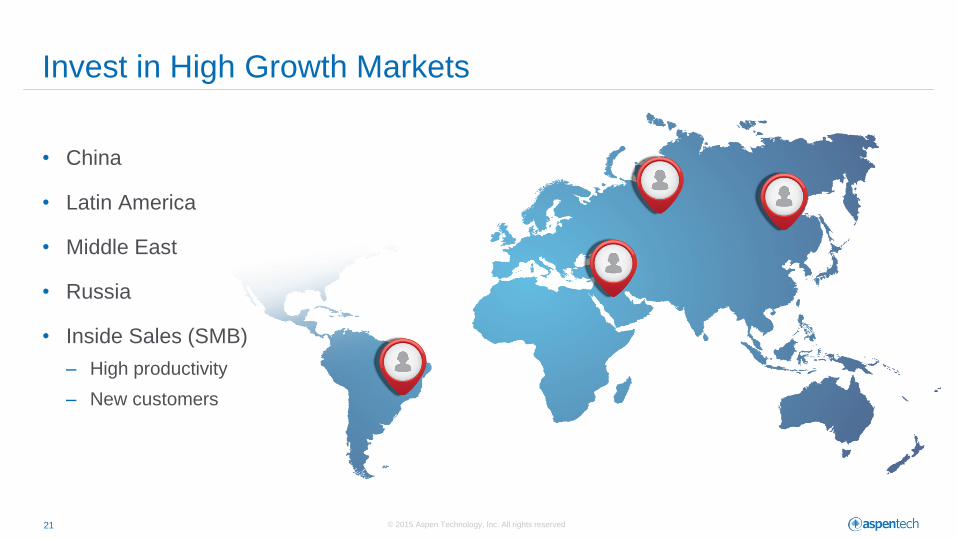
• China
• Latin America
• Middle East
• Russia
• Inside Sales (SMB)
– High productivity
– New customers
Invest in High Growth Markets
© 2015 Aspen Technology, Inc. All rights reserved 22
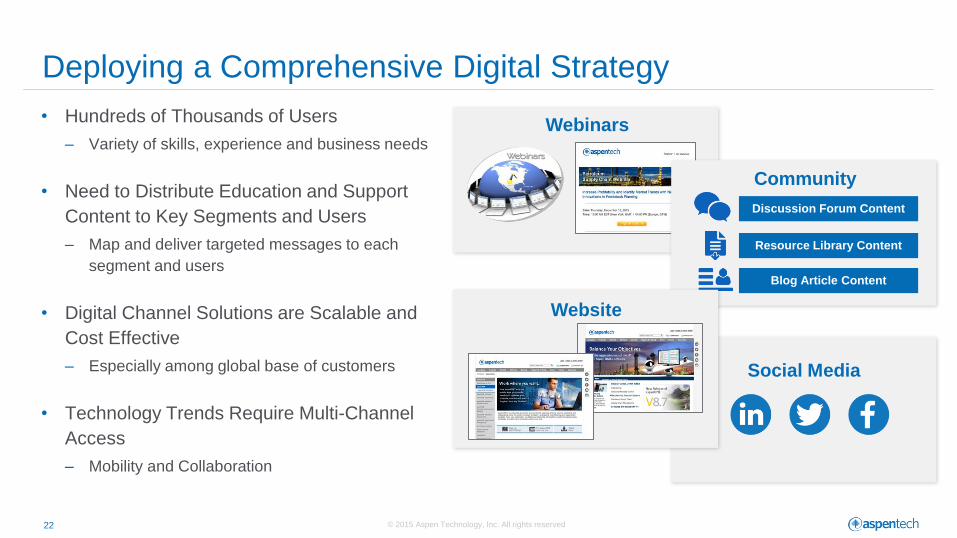
Webinars
Community
Blog Article Content
Discussion Forum Content
Resource Library Content
• Hundreds of Thousands of Users
– Variety of skills, experience and business needs
• Need to Distribute Education and Support
Content to Key Segments and Users
– Map and deliver targeted messages to each
segment and users
• Digital Channel Solutions are Scalable and
Cost Effective
– Especially among global base of customers
• Technology Trends Require Multi-Channel
Access
– Mobility and Collaboration
Deploying a Comprehensive Digital Strategy
Social Media
Website
© 2015 Aspen Technology, Inc. All rights reserved. 23
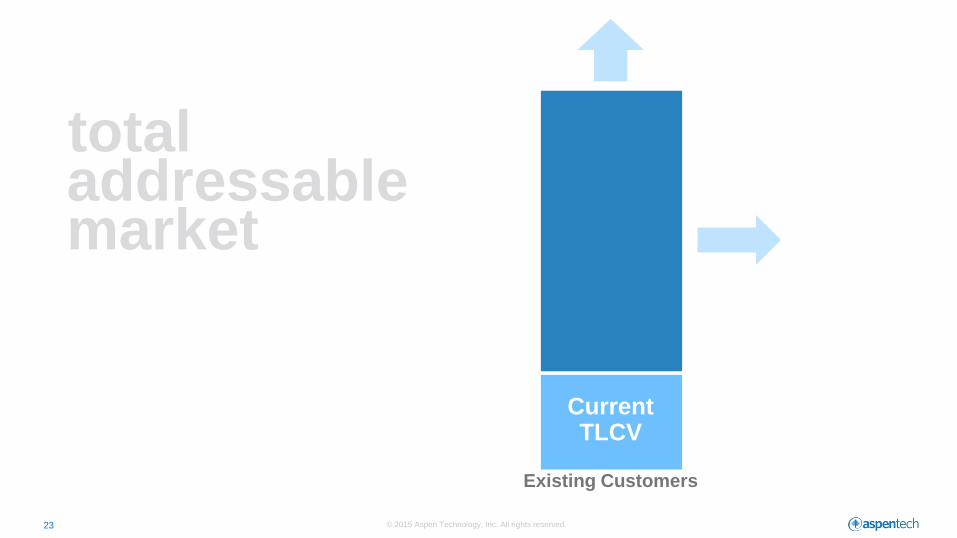
market addressable total
Existing Customers
Current TLCV
© 2015 Aspen Technology, Inc. All rights reserved 24
Acquisitions
• An effective way to drive shareholder
value
– Five small tuck-in acquisitions since
February 2012
• Buy versus make decision
• Growth and profitability a
key consideration
• Continuously evaluating
opportunities
© 2015 Aspen Technology, Inc. All rights reserved. 25
Total Addressable Market
© 2015 Aspen Technology, Inc. All rights reserved 26
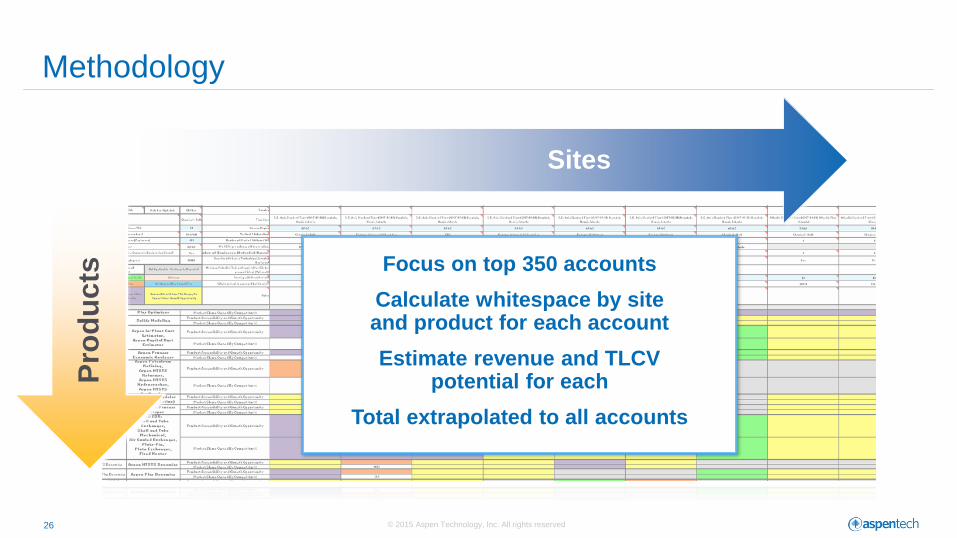
Methodology P
rod
uc
ts
Sites
Focus on top 350 accounts
Calculate whitespace by site and product for each account
Estimate revenue and TLCV potential for each
Total extrapolated to all accounts
© 2015 Aspen Technology, Inc. All rights reserved 27
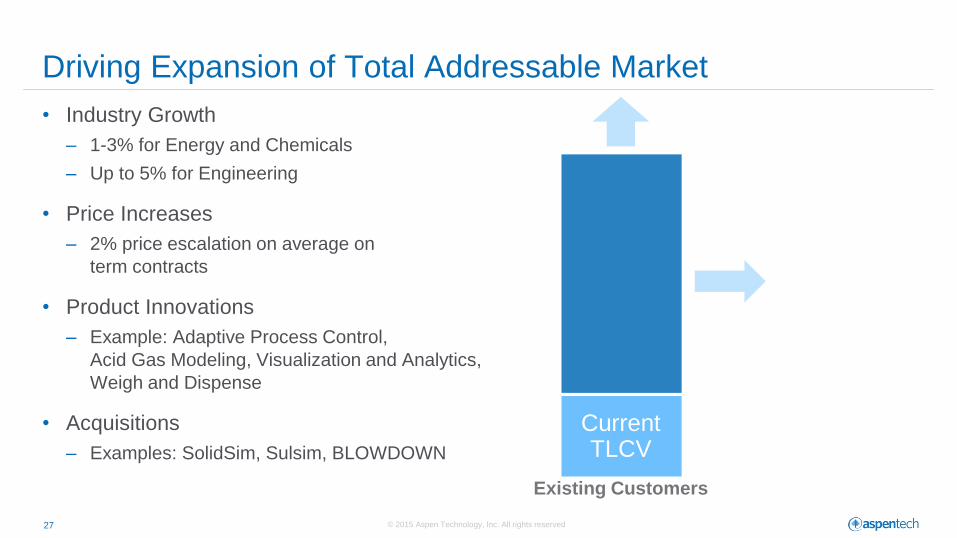
• Industry Growth
– 1-3% for Energy and Chemicals
– Up to 5% for Engineering
• Price Increases
– 2% price escalation on average on
term contracts
• Product Innovations
– Example: Adaptive Process Control,
Acid Gas Modeling, Visualization and Analytics,
Weigh and Dispense
• Acquisitions
– Examples: SolidSim, Sulsim, BLOWDOWN
Driving Expansion of Total Addressable Market
Existing Customers
Current TLCV
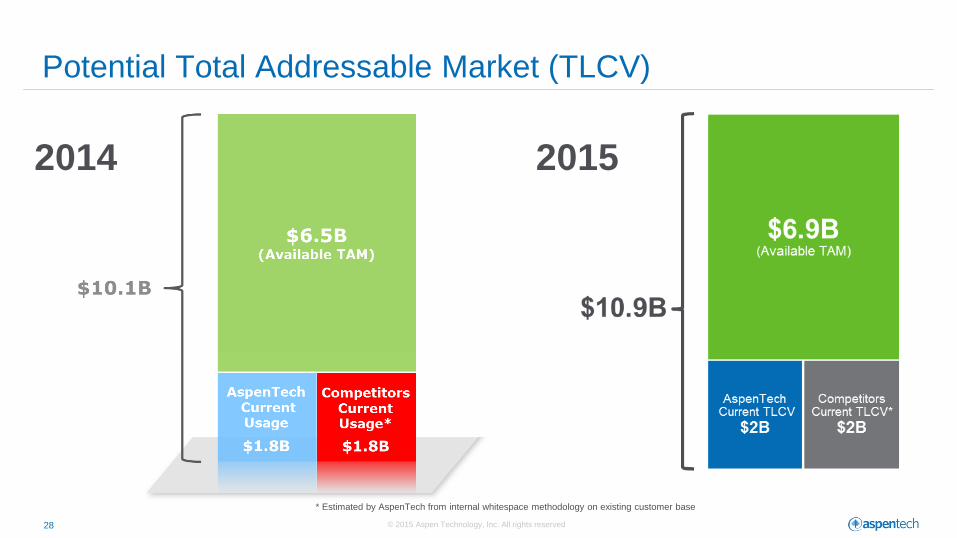
© 2015 Aspen Technology, Inc. All rights reserved 28
* Estimated by AspenTech from internal whitespace methodology on existing customer base
Potential Total Addressable Market (TLCV)
2014 2015
© 2015 Aspen Technology, Inc. All rights reserved 29
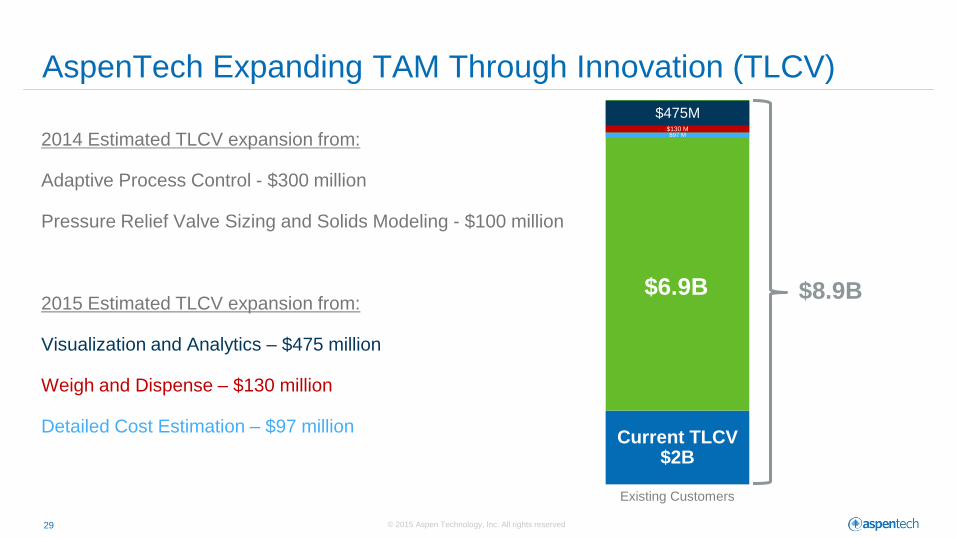
Existing Customers
Current TLCV $2B
$97 M $130 M
$6.9B $8.9B
AspenTech Expanding TAM Through Innovation (TLCV)
2014 Estimated TLCV expansion from:
Adaptive Process Control - $300 million
Pressure Relief Valve Sizing and Solids Modeling - $100 million
2015 Estimated TLCV expansion from:
Visualization and Analytics – $475 million
Weigh and Dispense – $130 million
Detailed Cost Estimation – $97 million
$475M

© 2015 Aspen Technology, Inc. All rights reserved 30
Methodology P
rod
uc
ts
Sites
Focus on top 350 accounts
Calculate whitespace by site and product for each account
Estimate revenue and TLCV potential for each
Total extrapolated to all accounts
© 2015 Aspen Technology, Inc. All rights reserved 31
Investment Allocation that Supports Growth
• Sales organization
– SMB organization
– Russia
– MENA
– China
• Marketing
– Digital channel
– User segmentation
– Market research
• Research and Development
• Acquisitions
© 2015 Aspen Technology, Inc. All rights reserved 32
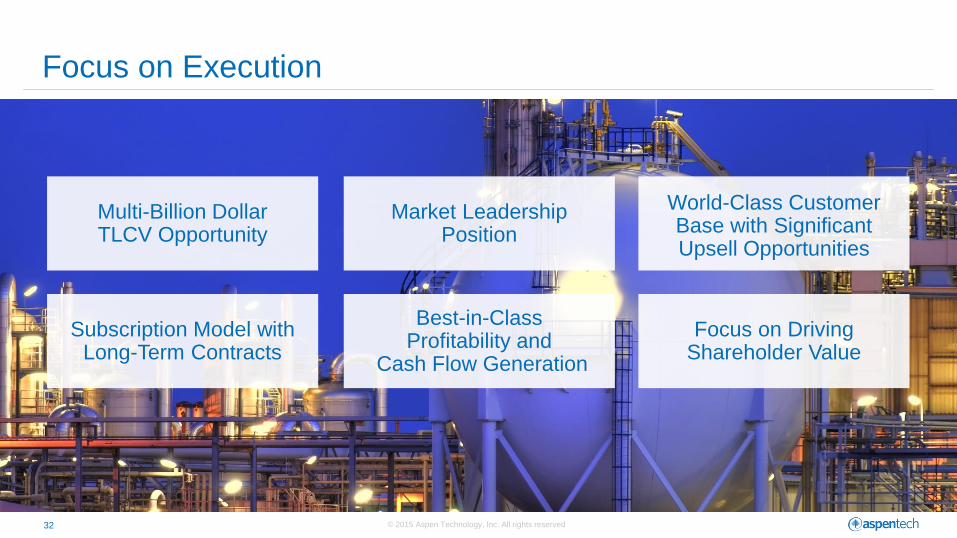
Focus on Execution
Multi-Billion Dollar TLCV Opportunity
Market Leadership Position
World-Class Customer Base with Significant Upsell Opportunities
Subscription Model with Long-Term Contracts
Best-in-Class Profitability and
Cash Flow Generation
Focus on Driving Shareholder Value

Thank you

Aspen Technology, Inc. Investor Day Mark Sullivan – Chief Financial Officer
May 4th, 2015
© 2015 Aspen Technology, Inc. All rights reserved 35
Financial Highlights
• Multi-year history of delivering solid growth in license subscription contracts
• Substantial market white space opportunity
• Best in class profitability and cash flow profile
• Consistently returning capital to shareholders via share repurchases
• In final year of transition to subscription revenue model
• Strong YTD FY 2015 performance and solid outlook for FY 2015 and FY 2016
© 2015 Aspen Technology, Inc. All rights reserved 36
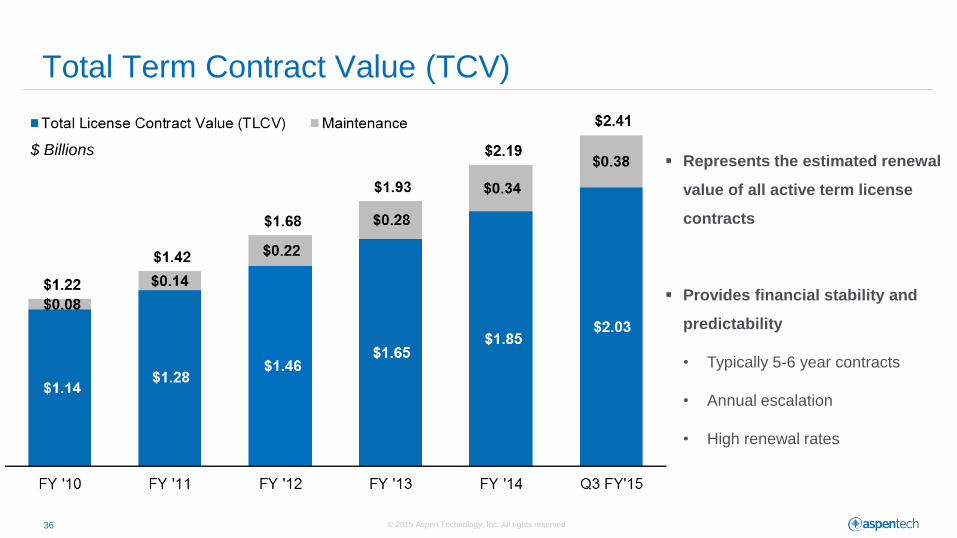
Total Term Contract Value (TCV)
$ Billions Represents the estimated renewal
value of all active term license
contracts
Provides financial stability and
predictability
• Typically 5-6 year contracts
• Annual escalation
• High renewal rates
© 2015 Aspen Technology, Inc. All rights reserved 37
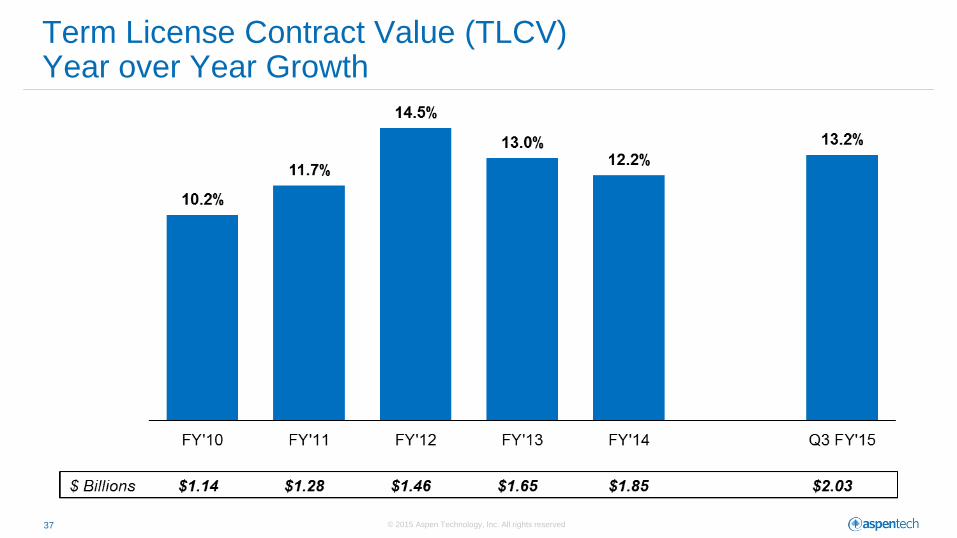
Term License Contract Value (TLCV) Year over Year Growth

© 2015 Aspen Technology, Inc. All rights reserved 38
Annual Spend (1) Year over Year Growth
(1) Represents the aggregate annualized license and maintenance invoice value for all active term contracts.
© 2015 Aspen Technology, Inc. All rights reserved 39
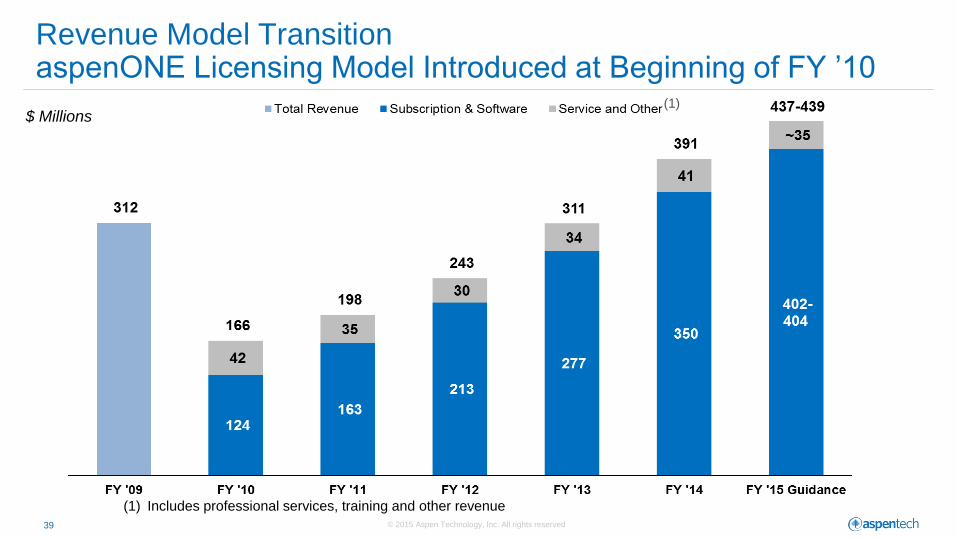
Revenue Model Transition aspenONE Licensing Model Introduced at Beginning of FY ’10
(1) Includes professional services, training and other revenue
$ Millions (1)
© 2015 Aspen Technology, Inc. All rights reserved 40
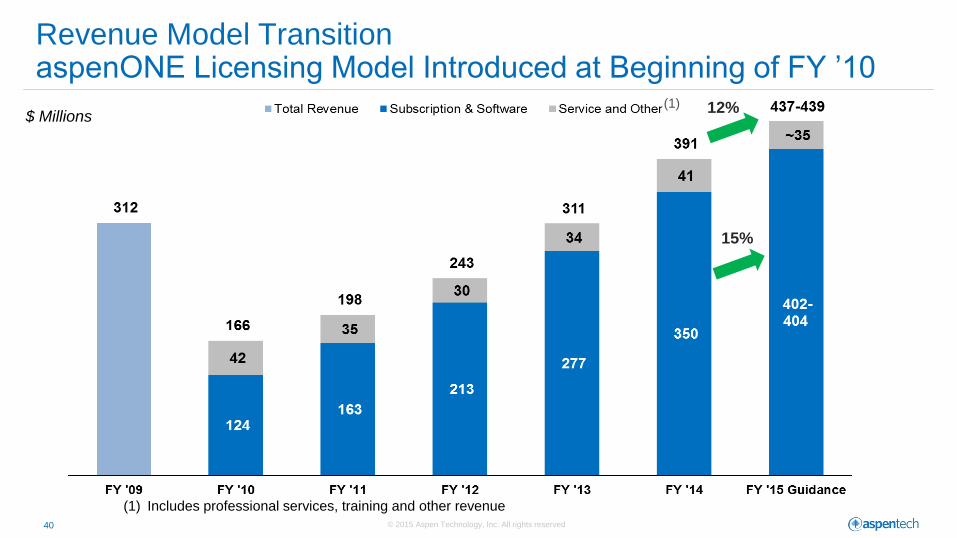
Revenue Model Transition aspenONE Licensing Model Introduced at Beginning of FY ’10
(1) Includes professional services, training and other revenue
$ Millions (1) 12%
15%
© 2015 Aspen Technology, Inc. All rights reserved 41
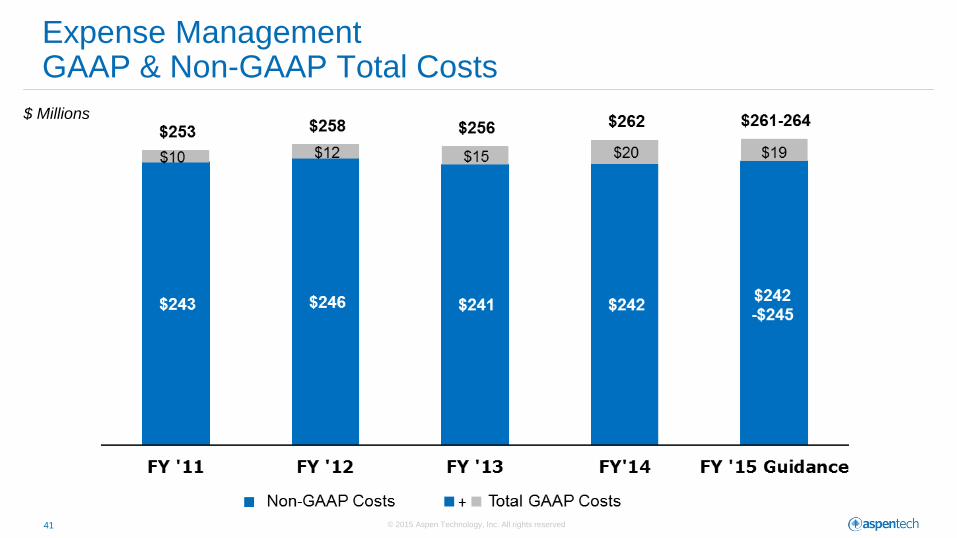
Expense Management GAAP & Non-GAAP Total Costs
$ Millions
© 2015 Aspen Technology, Inc. All rights reserved 42
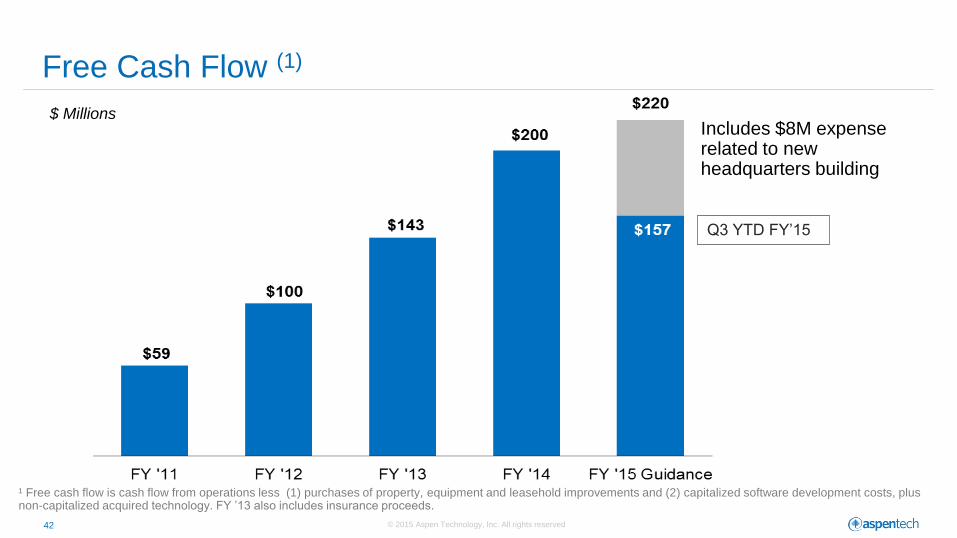
Free Cash Flow (1)
Q3 YTD FY’15
$ Millions Includes $8M expense related to new headquarters building
¹ Free cash flow is cash flow from operations less (1) purchases of property, equipment and leasehold improvements and (2) capitalized software development costs, plus non-capitalized acquired technology. FY ’13 also includes insurance proceeds.
© 2015 Aspen Technology, Inc. All rights reserved 43
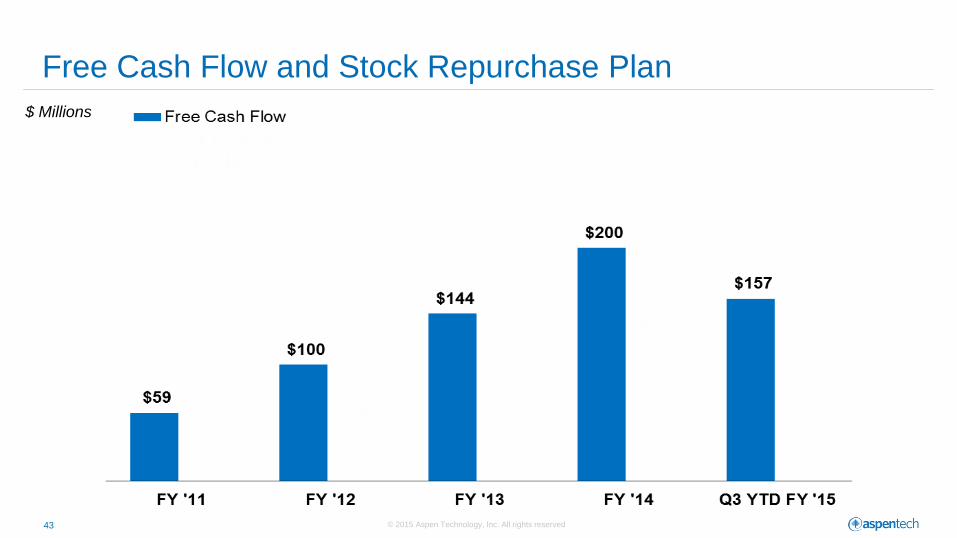
Free Cash Flow and Stock Repurchase Plan
$ Millions
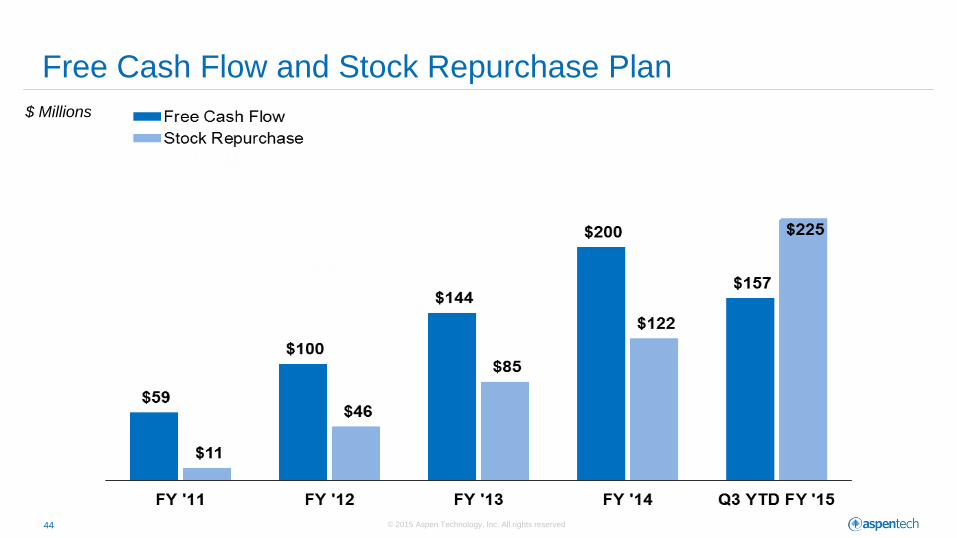
© 2015 Aspen Technology, Inc. All rights reserved 44
$ Millions
Free Cash Flow and Stock Repurchase Plan
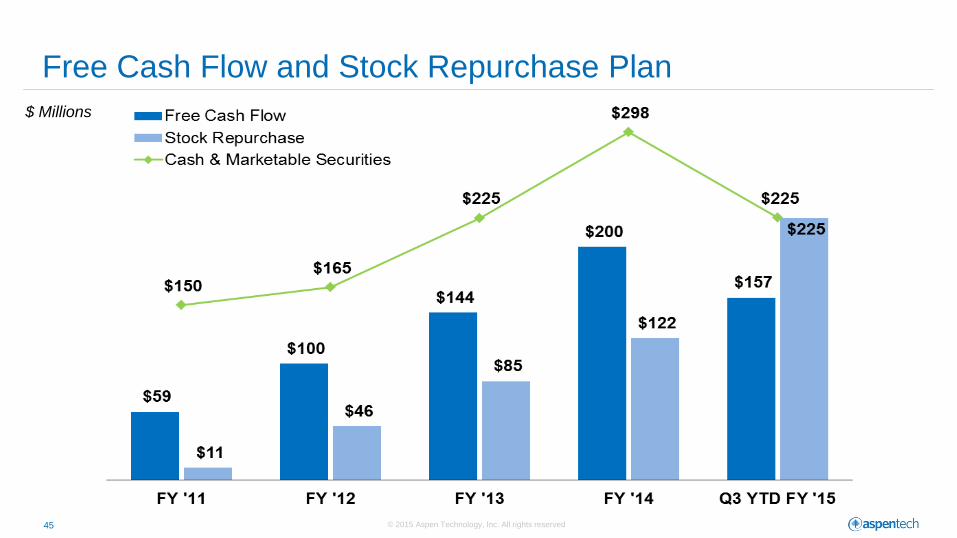
© 2015 Aspen Technology, Inc. All rights reserved 45
$ Millions
Free Cash Flow and Stock Repurchase Plan
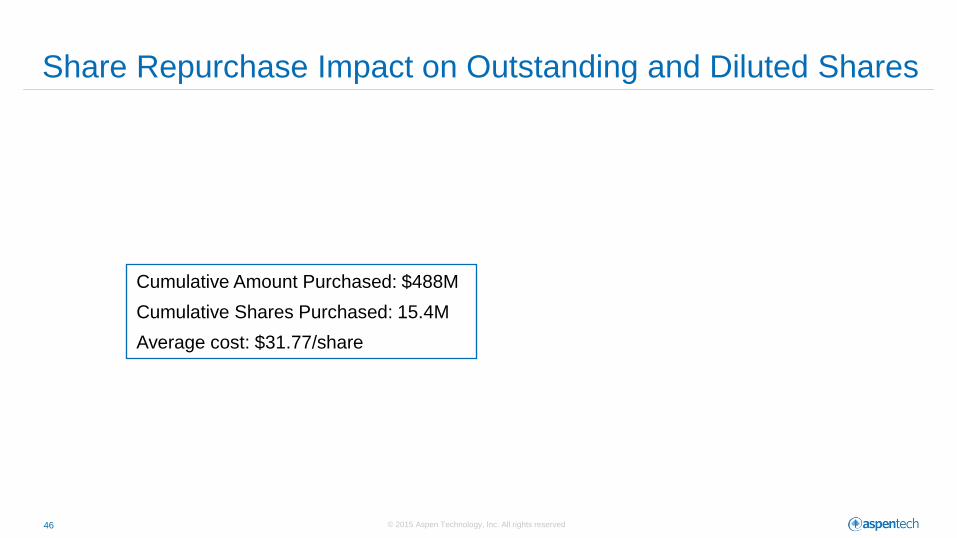
© 2015 Aspen Technology, Inc. All rights reserved 46
Cumulative Amount Purchased: $488M
Cumulative Shares Purchased: 15.4M
Average cost: $31.77/share
Share Repurchase Impact on Outstanding and Diluted Shares
© 2015 Aspen Technology, Inc. All rights reserved 47
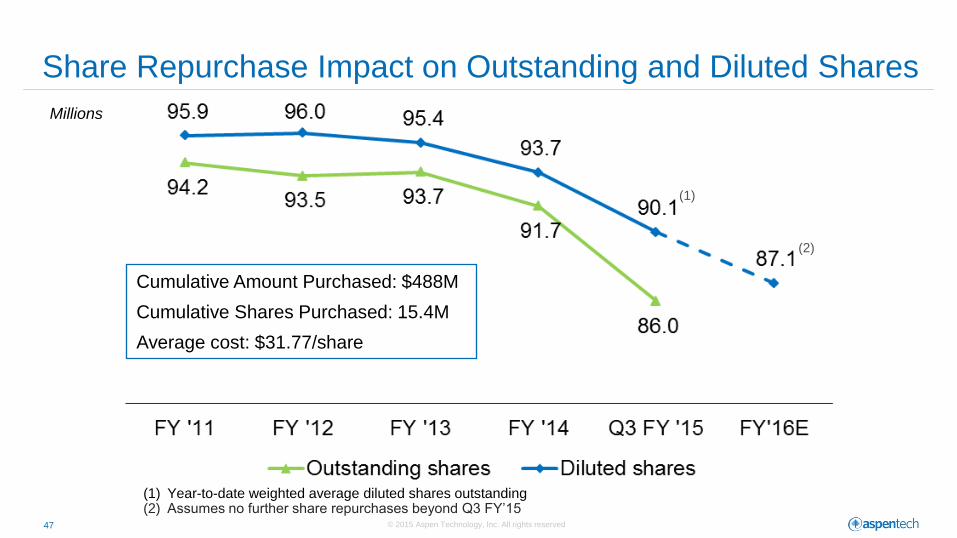
Share Repurchase Impact on Outstanding and Diluted Shares
Millions
Cumulative Amount Purchased: $488M
Cumulative Shares Purchased: 15.4M
Average cost: $31.77/share
(1) Year-to-date weighted average diluted shares outstanding (2) Assumes no further share repurchases beyond Q3 FY’15
(2)
(1)
© 2015 Aspen Technology, Inc. All rights reserved 48
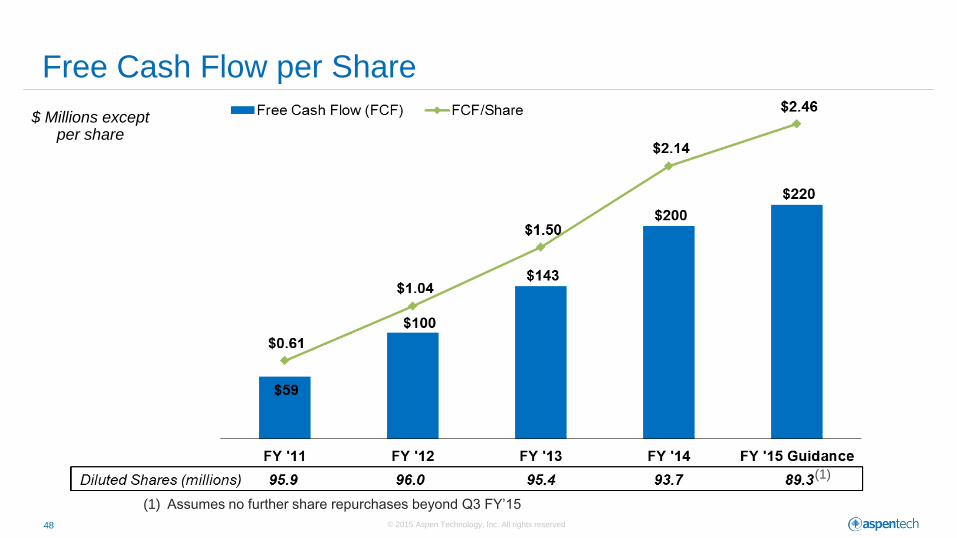
Free Cash Flow per Share
$ Millions except per share
(1) Assumes no further share repurchases beyond Q3 FY’15
(1)
© 2015 Aspen Technology, Inc. All rights reserved 49
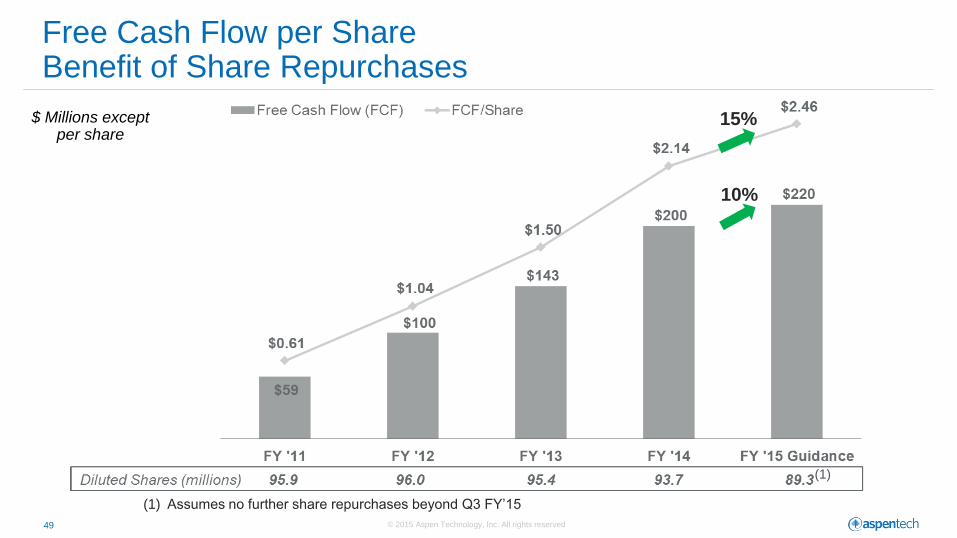
Free Cash Flow per Share Benefit of Share Repurchases
$ Millions except per share
10%
15%
(1) Assumes no further share repurchases beyond Q3 FY’15
(1)
© 2015 Aspen Technology, Inc. All rights reserved 50
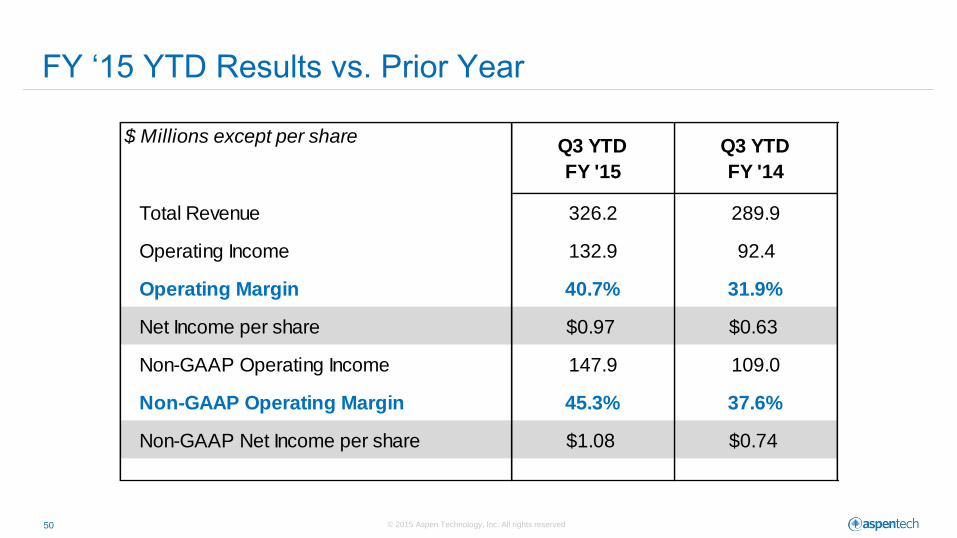
FY ‘15 YTD Results vs. Prior Year
$ Millions except per shareQ3 YTD
FY '15
Q3 YTD
FY '14
Total Revenue 326.2 289.9
Operating Income 132.9 92.4
Operating Margin 40.7% 31.9%
Net Income per share $0.97 $0.63
Non-GAAP Operating Income 147.9 109.0
Non-GAAP Operating Margin 45.3% 37.6%
Non-GAAP Net Income per share $1.08 $0.74

© 2015 Aspen Technology, Inc. All rights reserved. 51
FY 2016 Guidance
© 2015 Aspen Technology, Inc. All rights reserved 52
Non-GAAP Metrics We Will Provide in FY ’16
• Annual Spend: growth guidance and quarterly results
• TLCV/TCV on milestone basis or at year-end
• Non-GAAP P&L metrics
• Free Cash Flow guidance
© 2015 Aspen Technology, Inc. All rights reserved 53
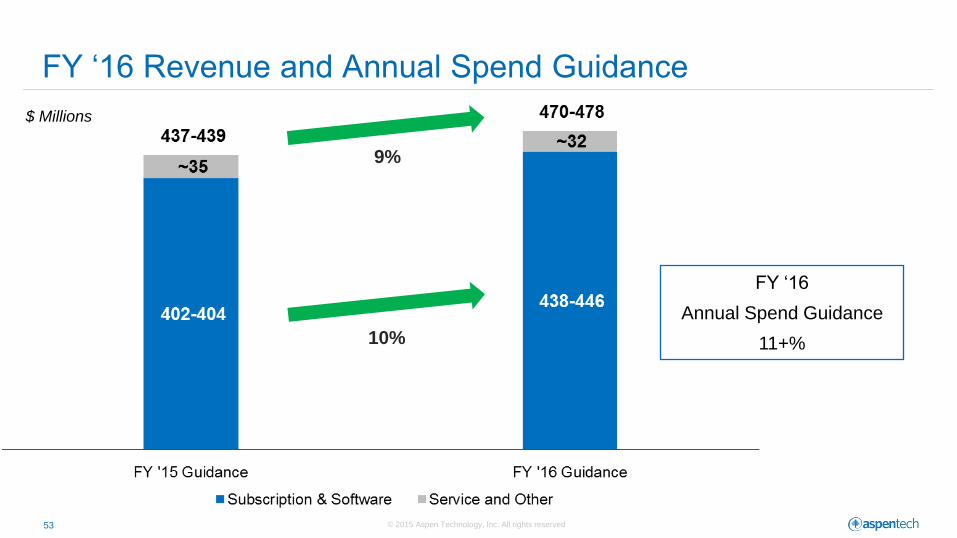
FY ‘16 Revenue and Annual Spend Guidance
$ Millions
10%
9%
FY ‘16
Annual Spend Guidance
11+%
© 2015 Aspen Technology, Inc. All rights reserved 54
Annual Spend vs. Subscription Revenue
• Annual spend increases due to:
• Booking events that a) add new customers, b) add additional tokens, c) increase prices
• Annual fee escalation in our contracts
• Annual Spend is a proxy for subscription revenue, it will not necessarily equal reported
GAAP revenue
• Invoice timing leads revenue recognition, similar to deferred revenue growth preceding revenue
growth
• GAAP rules impact timing of revenue recognition
• Small, decreasing amount of perpetual SMS included in subscription revenue but not in Annual
Spend
• Over-time, Annual Spend and subscription revenue growth rates will be comparable
© 2015 Aspen Technology, Inc. All rights reserved 55
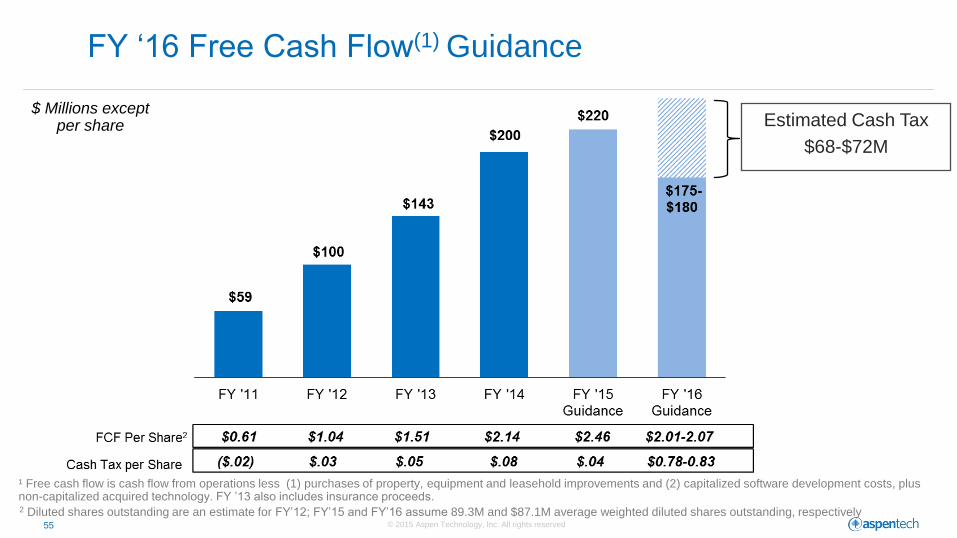
Estimated Cash Tax
$68-$72M
FY ‘16 Free Cash Flow(1) Guidance
¹ Free cash flow is cash flow from operations less (1) purchases of property, equipment and leasehold improvements and (2) capitalized software development costs, plus non-capitalized acquired technology. FY ’13 also includes insurance proceeds. 2 Diluted shares outstanding are an estimate for FY’12; FY’15 and FY’16 assume 89.3M and $87.1M average weighted diluted shares outstanding, respectively
$ Millions except per share
© 2015 Aspen Technology, Inc. All rights reserved 56
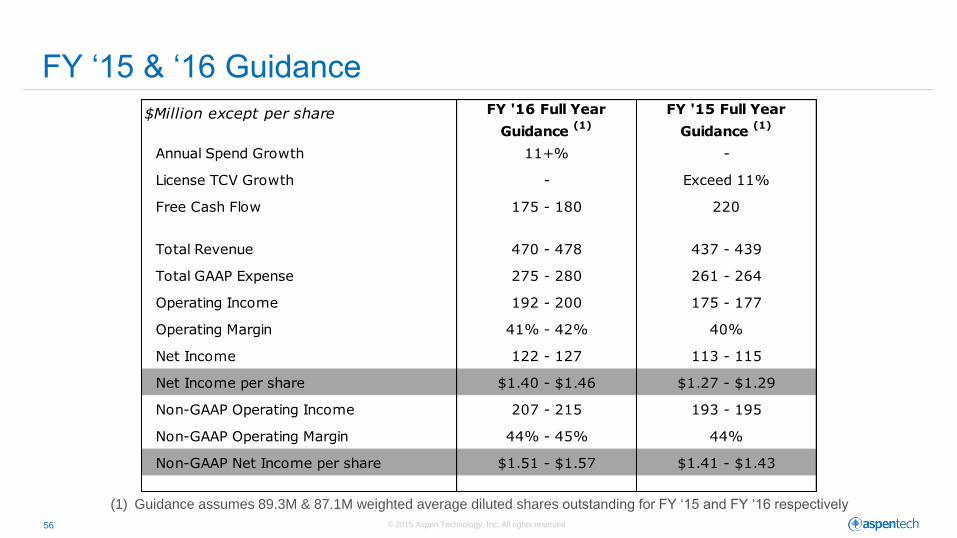
FY ‘15 & ‘16 Guidance
(1) Guidance assumes 89.3M & 87.1M weighted average diluted shares outstanding for FY ‘15 and FY ‘16 respectively
$Million except per share
Annual Spend Growth 11+% -
License TCV Growth - Exceed 11%
Free Cash Flow 175 - 180 220
Total Revenue 470 - 478 437 - 439
Total GAAP Expense 275 - 280 261 - 264
Operating Income 192 - 200 175 - 177
Operating Margin 41% - 42% 40%
Net Income 122 - 127 113 - 115
Net Income per share $1.40 - $1.46 $1.27 - $1.29
Non-GAAP Operating Income 207 - 215 193 - 195
Non-GAAP Operating Margin 44% - 45% 44%
Non-GAAP Net Income per share $1.51 - $1.57 $1.41 - $1.43
FY '15 Full Year
Guidance (1)
FY '16 Full Year
Guidance (1)
© 2015 Aspen Technology, Inc. All rights reserved 57
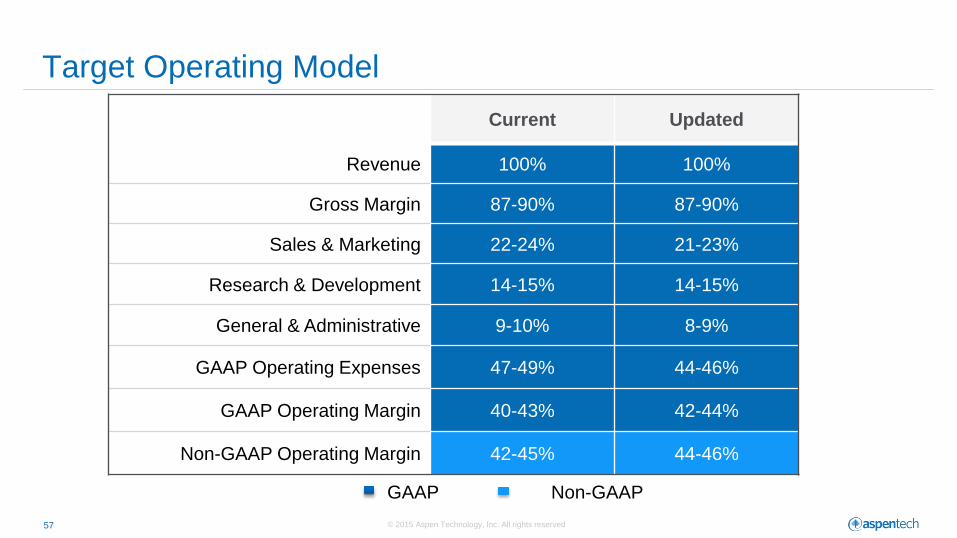
Target Operating Model
Current Updated
Revenue 100% 100%
Gross Margin 87-90% 87-90%
Sales & Marketing 22-24% 21-23%
Research & Development 14-15% 14-15%
General & Administrative 9-10% 8-9%
GAAP Operating Expenses 47-49% 44-46%
GAAP Operating Margin 40-43% 42-44%
Non-GAAP Operating Margin 42-45% 44-46%
GAAP Non-GAAP
© 2015 Aspen Technology, Inc. All rights reserved 58
• Multi-Billion Dollar Market Opportunity
• Market Leadership Position
• World-Class Customer Base with Significant Upsell Opportunities
• Subscription Model with Long-Term Contracts
• Shareholder Value Driven Focus
• Best In Class Profitability and Cash Flow Profile
Conclusion and Q&A

Q&A