Investor Day 2014
55
MIC Fixed Income Presentation – March 24, 2014 1 1 Genworth MI Canada Inc.
-
Upload
genworthfinancial -
Category
Business
-
view
488 -
download
5
Transcript of Investor Day 2014
MIC Fixed Income Presentation – March 24, 20141 1Genworth MI Canada Inc.

MIC Fixed Income Presentation – March 24, 20142 2Genworth MI Canada Inc.
> FORWARD-LOOKING AND
NON-IFRS STATEMENTS
This presentation relating to Genworth MI Canada Inc. (the “Company”, “Genworth Canada” or “MIC”) includes certain forward-
looking statements. These forward-looking statements include, but are not limited to, statements with respect to the Company’s
future operating and financial results, expectations regarding premiums written, losses on claims and investment income,
unearned premiums, adjacent opportunities, capital optimization, the Canadian housing market and potential housing prices, and
other statements that are not historical facts. These forward-looking statements may be identified by their use of words such as
“may”, “would”, “could”, “will,” “intend”, “plan”, “anticipate”, “believe”, “seek”, “propose”, “estimate”, “expect”, and similar
expressions. These statements are based on the Company’s current assumptions, including assumptions regarding economic,
global, political, business, competitive, market and regulatory matters. These forward-looking statements are inherently subject to
significant risks, uncertainties and changes in circumstances, many of which are beyond the control of the Company. The
Company’s actual results may differ materially from those expressed or implied by such forward-looking statements, including as a
result of changes in the facts underlying the Company’s assumptions, and the other risks described in the Company’s Annual
Information Form dated March 17, 2014, its Short Form Base Shelf Prospectus dated June 18, 2014, the Prospectus Supplements
thereto and all documents incorporated by reference in such documents. Other than as required by applicable laws, the Company
undertakes no obligation to publicly update or revise any forward-looking statement, whether as a result of new information,
future developments or otherwise.
To supplement its financial statements, the Company uses select non-IFRS financial measures. Non-IFRS financial measures include
net operating income, interest and dividend income (net of investment expenses), operating earnings per common share (basic),
operating earnings per common share (diluted), shareholders’ equity excluding accumulated other comprehensive income
(“AOCI”), operating return on equity and underwriting ratios such as loss ratio, expense ratio and combined ratio. The Company
believes that these non-IFRS financial measures provide meaningful supplemental information regarding its performance and may
be useful to investors because they allow for greater transparency with respect to key metrics used by management in its financial
and operational decision making. Non-IFRS measures do not have standardized meanings and are unlikely to be comparable to any
similar measures presented by other companies. These measures are defined in the Company’s glossary, which is posted on the
Company’s website at http://investor.genworthmicanada.ca. A reconciliation from non-IFRS financial measures to the most readily
comparable measures calculated in accordance with IFRS, where applicable can be found in the Company’s most recent
management’s discussion and analysis, which is posted on the Company’s website and is also available at www.sedar.com.

> BRIAN HURLEY, CHAIRMAN AND CEO
SOLID AND SUSTAINABLE BUSINESS

MIC Fixed Income Presentation – March 24, 2014Genworth MI Canada Inc. 4 4Genworth MI Canada Inc.
LARGEST PRIVATE RESIDENTIAL
MORTGAGE INSURER IN CANADA
Since 1995 helped 1.5 million families COAST
TO COAST achieve homeownership.
We support more than 250 Canadian lenders.
MARKET FACTS (as at Sept 30, 2014)
$5.9 billion Total Assets
$3.3 billion Shareholders’ Equity
$3.8 billion Market Capitalization
95 million Shares Outstanding
COMPETITIVE STRENGTHS
Strong
Market
Presence
Long-Standing
Customer
Relationships
Best-in Class
Technology
and Processes
Prudent Risk
Management
Impressive
Long-Term
Track Record
Experienced
and Engaged
Workforce
> WHO WE ARE

MIC Fixed Income Presentation – March 24, 20145 5Genworth MI Canada Inc.
> THE MARKET HAS EVOLVED
SINCE WE ENTERED…
IPO of
Company
Implemented
Influencer
Strategy
Launched Loss
Mitigation
Strategy
Implemented
Lender Service
Agreements
MI Product
Development
Leader
In-House
Valuation
Model
Entered
Market
Master
Policies with
Big 5 BanksOmni Score
Developed
Auto-
Decisioning
Implemented
INSURED 1.5 MILLION HOMEOWNERS
ACROSS CANADA TO DATE
6Genworth MI Canada Inc.Genworth MI Canada Inc.
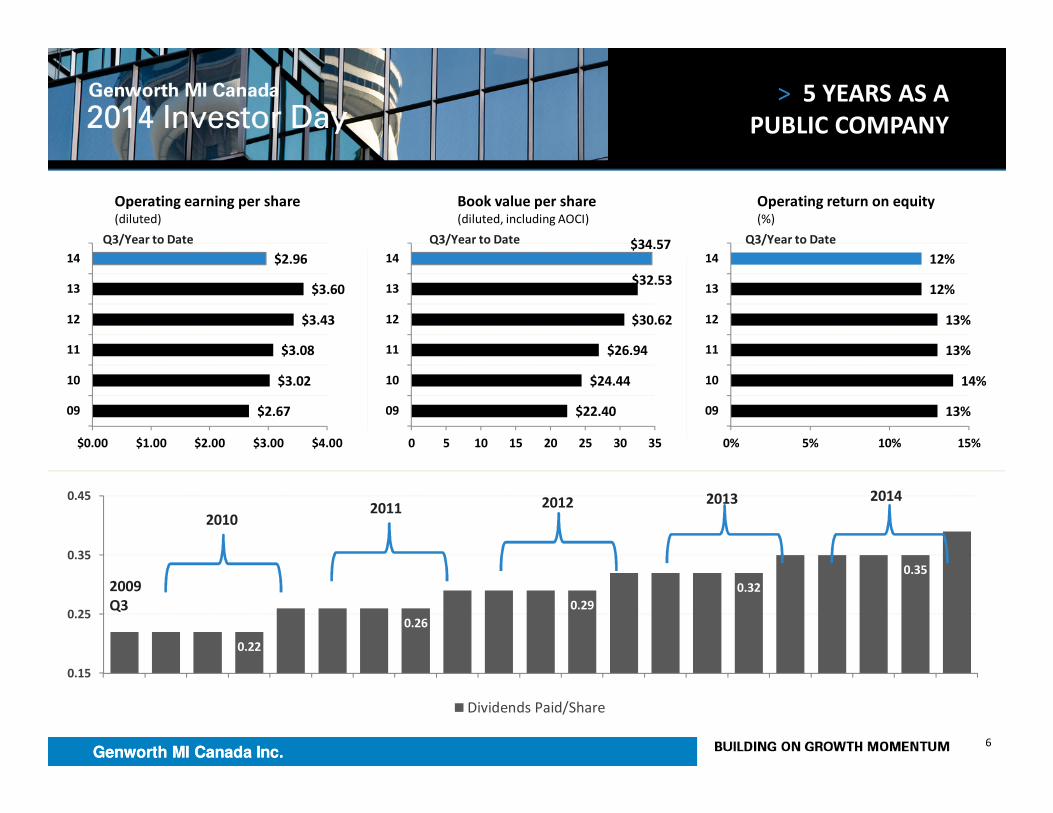
> 5 YEARS AS A
PUBLIC COMPANY
0.22
0.26
0.29
0.32
0.35
0.15
0.25
0.35
0.45
Dividends Paid/Share
20102011 2012 2013 2014
$2.67
$3.02
$3.08
$3.43
$3.60
$2.96
$0.00 $1.00 $2.00 $3.00 $4.00
09
10
11
12
13
14
Operating earning per share(diluted)
$22.40
$24.44
$26.94
$30.62
$32.53
$34.57
0 5 10 15 20 25 30 35
09
10
11
12
13
14
Book value per share(diluted, including AOCI)
13%
14%
13%
13%
12%
12%
0% 5% 10% 15%
09
10
11
12
13
14
Operating return on equity(%)
Q3/Year to Date Q3/Year to Date Q3/Year to Date
2009
Q3

MIC Fixed Income Presentation – March 24, 20147 7Genworth MI Canada Inc.
> AGENDA
Vision for prudent growth
Managing mortgage default risk
Capitalizing on strong capital position
Q&A
Conclusion
TODAY’S AGENDA

> STUART LEVINGS, CHIEF OPERATING OFFICER
VISION FOR PRUDENT GROWTH

9Genworth MI Canada Inc.
> MISSION AND VISION
CANADA’S MORTGAGE INSURER OF CHOICE
Working with our lender partners, regulators and influencers we
› help people responsibly achieve and maintain the dream of
homeownership
› promote strong and sustainable communities across Canada
While enhancing stakeholder value
OUR MISSION
OUR VISION

10Genworth MI Canada Inc.
> GROWTH CATALYSTS
Strong
Market
Presence
Long-Standing
Customer
Relationships
Best-in Class
Technology
and Processes
Prudent Risk
Management
Impressive
Long-Term
Track Record
Experienced
and Engaged
Workforce
COMPETITIVE STRENGTHS
GROWTH CATALYSTS
FOCUS ON PEOPLE, RISK AND TECHNOLOGY
Market Share Market SizePremium
Rates
Adjacent
Opportunities

MIC Fixed Income Presentation – March 24, 201411 11Genworth MI Canada Inc.
> KEY STRATEGIC PRIORITIES
Expand Market Share
Proactive Risk Management
Strong Government Relations
Efficient Capital Structure
Adjacent Opportunities
Employ and Engage Top Talent
Expand Market Share
Proactive Risk Management
Strong Government Relations
Efficient Capital Structure
Adjacent Opportunities
Employ and Engage Top Talent
High Quality, Diversified Portfolio
Operating Income Growth
HOW WE MEASURE SUCCESSHOW WE MEASURE SUCCESS
Market Share Gains
Strong Employee Engagement
STRATEGIC PRIORITIES

MIC Fixed Income Presentation – March 24, 201412 12Genworth MI Canada Inc.
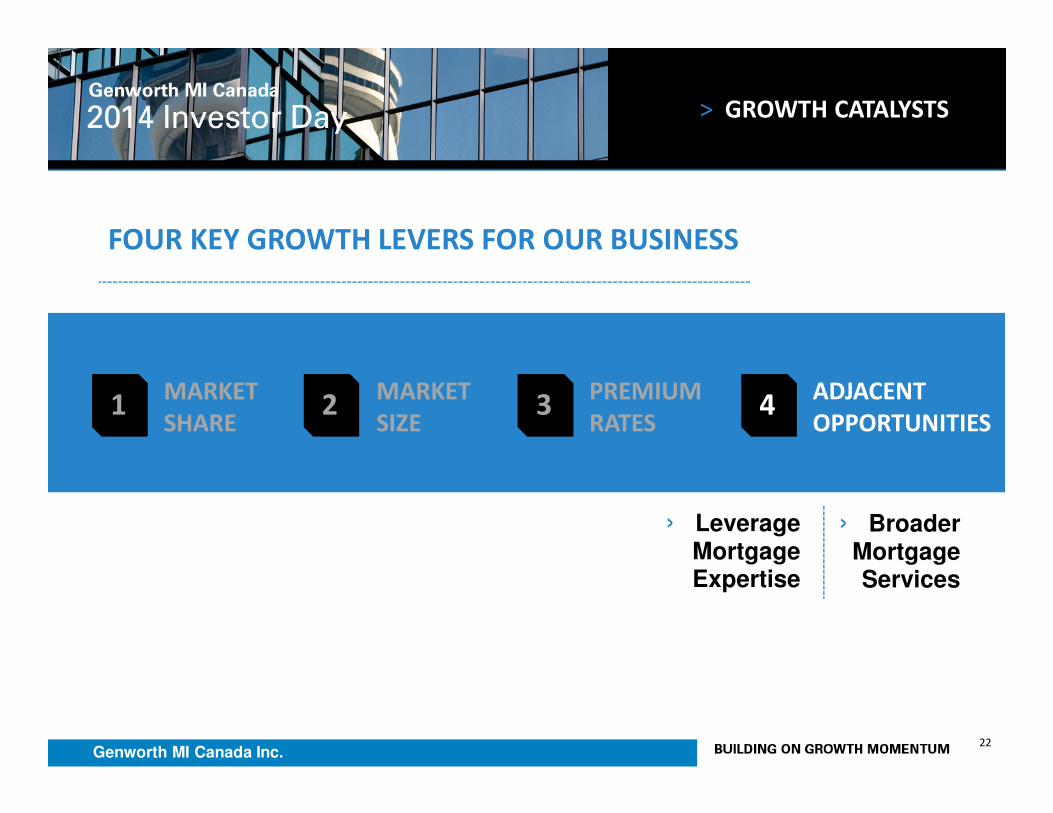
FOUR KEY GROWTH LEVERS FOR OUR BUSINESS
1MARKET
SHARE2 3
MARKET
SIZE
PREMIUM
RATES4
ADJACENT
OPPORTUNITIES
> GROWTH CATALYSTS

MIC Fixed Income Presentation – March 24, 201413 13Genworth MI Canada Inc.
FOUR KEY GROWTH LEVERS FOR OUR BUSINESS
1MARKET
SHARE2 3
MARKET
SIZE
PREMIUM
RATES4
ADJACENT
OPPORTUNITIES
› Enhance Customer Experience
› Build on Value Proposition
› Deepen Collaboration
> GROWTH CATALYSTS

14Genworth MI Canada Inc.
96% 97% 96% 96% 97%
09 10 11 12 13
HIGH DEGREE OF LENDER SATISFACTION> Service Innovation
> Deep Relationships
> Customer-Centric Culture
> Customized Experience
> MARKET SHARE
DRIVING VALUE THROUGH CUSTOMIZED SERVICE EXPERIENCE
ENHANCE CUSTOMER EXPERIENCE

15Genworth MI Canada Inc.
> MARKET SHARE
DELIVERING VALUE BEYOND THE MI TRANSACTION
Customer Training and EducationCustomer Training and Education
Mortgage Default ManagementMortgage Default Management
Portfolio InsurancePortfolio Insurance
Sales TechnologySales Technology
Industry InfluencersIndustry Influencers
BUILD VALUE PROPOSITION

MIC Fixed Income Presentation – March 24, 201416 16Genworth MI Canada Inc.
COLLABORATE ON
> Portfolio Reviews
> Regulatory Change
> Product Development
> MARKET SHARE
ADVISING ON
> Market Trends
> Performance Statistics
> Competitive Intelligence
ADDING VALUE THROUGH THOUGHT LEADERSHIP & APPLICATION
DEEPEN OUR COLLABORATION

MIC Fixed Income Presentation – March 24, 201417 17Genworth MI Canada Inc.
THREE STRATEGIC INITIATIVES
> Enhancing the customer experience
> Building on our value proposition
> Deepening our collaboration
6
2
6
5
8
13
Dec'11 Sep'14
TOP 20 LENDER SHARE
<20% 20-30% >30%MIC Market
Share(Company estimates)
> MARKET SHARE
CAPITALIZE ON MARKET MOMENTUM IN 2015
DEMONSTRATED SHARE GAINS

MIC Fixed Income Presentation – March 24, 201418 18Genworth MI Canada Inc.
FOUR KEY GROWTH LEVERS FOR OUR BUSINESS
1MARKET
SHARE2 3
MARKET
SIZE
PREMIUM
RATES4
ADJACENT
OPPORTUNITIES
› High Ratio Penetration
› First-Time Homebuyer
› Private MI Segment
> GROWTH CATALYSTS

MIC Fixed Income Presentation – March 24, 201419 19Genworth MI Canada Inc.
> Growth in prime home-buying age (30-39) outpacing general population growth (1.8% vs. 1.1%)
> Household formation in Canada supported by immigration
> drives ~60% of population growth > new immigrant quota increased to ~285,000
> Homeownership still seen as a vehicle for building wealth in Canada
> MARKET SIZE
DEMOGRAPHICS AND IMMIGRATION FUEL FIRST-TIME BUYER MARKET
FIRST-TIME BUYERS CONTINUE TO SUPPORT THE HIGH RATIO MARKET

MIC Fixed Income Presentation – March 24, 201420 20Genworth MI Canada Inc.
> MARKET SIZE
Broad Value PropositionCustomer Experience
Tools and Technology Deep Collaboration
EXTENSIVE CUSTOMER ENGAGEMENT
STRONG CUSTOMER ENTRENCHMENT

MIC Fixed Income Presentation – March 24, 201421 21Genworth MI Canada Inc.
FOUR KEY GROWTH LEVERS FOR OUR BUSINESS
1MARKET
SHARE2 3
MARKET
SIZE
PREMIUM
RATES4
ADJACENT
OPPORTUNITIES
> GROWTH CATALYSTS
› Increased Capital Levels
› Annual Review
MIC Fixed Income Presentation – March 24, 201422 22Genworth MI Canada Inc.
1MARKET
SHARE2 3
MARKET
SIZE
PREMIUM
RATES4
ADJACENT
OPPORTUNITIES
› Leverage Mortgage Expertise
› Broader Mortgage Services
> GROWTH CATALYSTS
FOUR KEY GROWTH LEVERS FOR OUR BUSINESS

23Genworth MI Canada Inc.
> CONCLUSION
CLEAR STRATEGY FOR PRUDENT GROWTH
Sound Business Model
Customer-Centric Culture
Supportive Regulatory and Economic Environment
Strong Risk Management Culture

> CRAIG SWEENEY, CHIEF RISK OFFICER
MANAGING MORTGAGE DEFAULT RISK

MIC Fixed Income Presentation – March 24, 2014Genworth MI Canada Inc. 25 25
› Regulatory and Economic Environment
› Assessment of Canadian Markets
› Genworth MIC Portfolio Quality
› Emerging Trends
Genworth MI Canada Inc.
> MANAGING
MORTGAGE DEFAULT RISK

MIC Fixed Income Presentation – March 24, 2014Genworth MI Canada Inc. 26 26
QUALITY OF NEW BUSINESS
CONTINUES TO IMPROVE
POLICY ACTIONS REDUCE RISK
Macroprudential Actions
�Purchase LTV Reduced From 100% to 95%
�Refinance LTV Reduced From 95% to 80%
�Investment Properties Reduced From 95% to 80%
�Max Amortization Reduced From 40 to 25 Years
�All Borrowers Must Qualify at 5-year Fixed Rate
�Max Debt Service Ratio’s Lowered
�Minimum FICO 600 Required For MI
Microprudential Actions
�Increased Regulatory Oversight of Private MIs through PRMHIA
�OSFI Assumes Oversight Of CMHC
�New Limits Planned on Gov’t Backed MI For low-LTV
Mortgages
�B20 & B21 Policy Guidelines On Mortgage Lending
Monetary Policy
�Very Accommodative
�Interest Rates Remain Low To Support Economic Recovery
50%
42%
40% 40%
30% 30%
27% 27%
716
720
726 727 727
730732
737
2007 2008 2009 2010 2011 2012 2013 2014 YTD
HLTV as % of Overall Mortgage Originations
Average Credit Score
Source: Genworth data, as at September 30, 2014
> ECONOMIC AND
REGULATORY ENVIRONMENT
Genworth MI Canada Inc.
MIC Fixed Income Presentation – March 24, 2014Genworth MI Canada Inc. 27 27
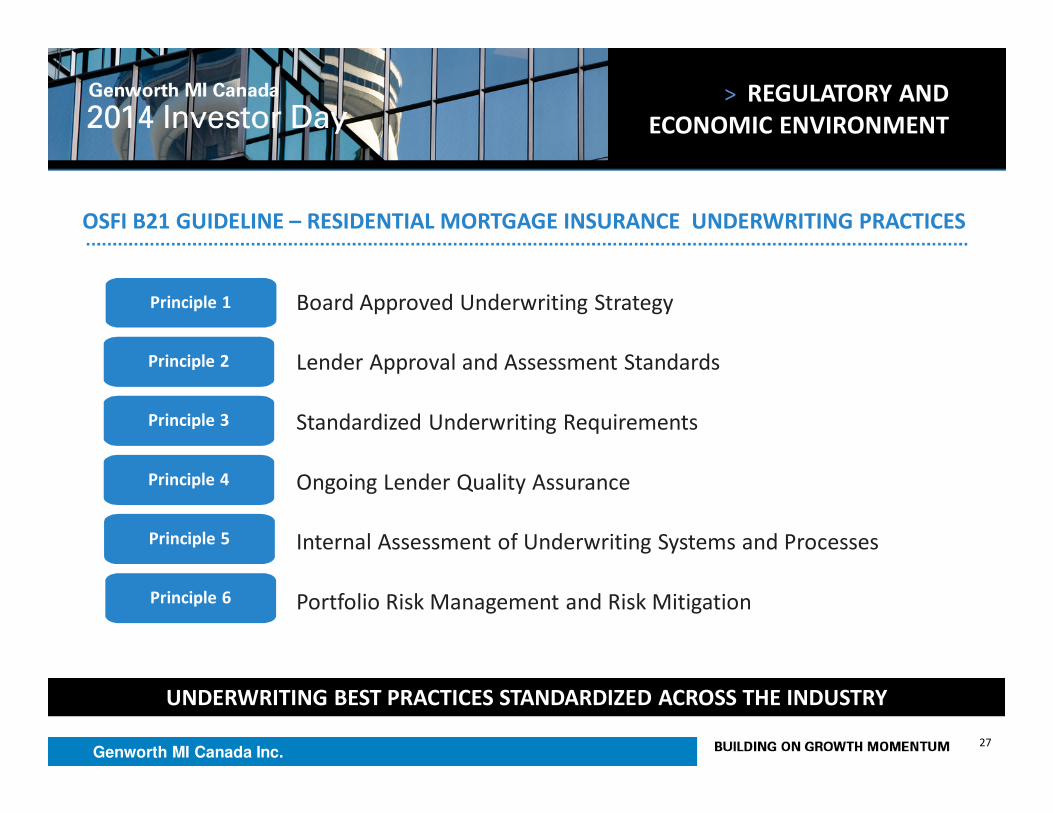
OSFI B21 GUIDELINE – RESIDENTIAL MORTGAGE INSURANCE UNDERWRITING PRACTICES
Principle 2
Principle 3
Principle 4
Principle 1
Principle 5
Principle 6
Board Approved Underwriting Strategy
Lender Approval and Assessment Standards
Standardized Underwriting Requirements
Ongoing Lender Quality Assurance
Internal Assessment of Underwriting Systems and Processes
Portfolio Risk Management and Risk Mitigation
UNDERWRITING BEST PRACTICES STANDARDIZED ACROSS THE INDUSTRY
Genworth MI Canada Inc.
> REGULATORY AND
ECONOMIC ENVIRONMENT

MIC Fixed Income Presentation – March 24, 2014Genworth MI Canada Inc. 28 28
› Solid employment gains supporting
housing market since 2010
› Job growth expected to be positive
over forecast period
› Rising rates in 2015 should keep
price gains modest5.5%
6.0%
6.5%
7.0%
7.5%
8.0%
8.5%
9.0%
0%
10%
20%
30%
40%
50%
60%
National HPI (Teranet) and UE Rate
Cumulative HPI (L) UE Rate (R)
Sources: UE Rate – Statistics Canada, RBC Economics (November 2014 forecast); HPI – Teranet,
Genworth calculations (forecast); data as at September 30, 2014
Forecast
Genworth MI Canada Inc.
STABLE ECONOMIC ENVIRONMENT
> REGULATORY AND
ECONOMIC ENVIRONMENT

MIC Fixed Income Presentation – March 24, 2014Genworth MI Canada Inc. 29 29
Sources: Teranet (HPI), Statistics Canada (UE), CREA (SLR), RBC Economics (Affordability); data as of Q3’14
42
44
46
48
50
52
54
Housing Affordability (Standard 2-Storey)
Good
30%
40%
50%
60%
70%
80%
Supply vs Demand (Sales-to-New-Listings Ratio)
Balanced Market › Housing market remains balanced
› Stable employment supporting
housing demand
› Low interest rates continue to
support affordability
Genworth MI Canada Inc.
STABLE HOUSING MARKET
> ASSESSMENT OF KEY
CANADIAN MARKETS

MIC Fixed Income Presentation – March 24, 2014Genworth MI Canada Inc. 30 30
> ASSESSMENT OF KEY
CANADIAN MARKETS
› Stronger growth trend in Ontario
primarily driven by limited supply in
Greater Toronto Area
› Strong employment driving house
price growth in Western provinces
› Softer housing markets in Quebec
and Atlantic regions
HOME PRICES AND SUPPLY
Note: 3-month moving average of the seasonally adjusted year-over-year price change is shown. Months of inventory uses adjusted values.
Sources: Canadian Real Estate Association and Bank of Canada calculations
Genworth MI Canada Inc.

MIC Fixed Income Presentation – March 24, 2014Genworth MI Canada Inc. 31 31
2.0
3.0
4.0
5.0
6.0
7.0
2000 2002 2004 2006 2008 2010 2012 2014
MIC HOUSING RISK MONITOR
Stable
Monitoring
Elevated
ROBUST HOUSING FRAMEWORK TO ASSESS MARKET RISK
> ASSESSMENT OF KEY
CANADIAN MARKETS
Genworth MI Canada Inc.
KEY HOUSING MEASURES
› Supply vs. Demand
› Price-to-income
› Price-to-rent
› House price appreciation
› Affordability
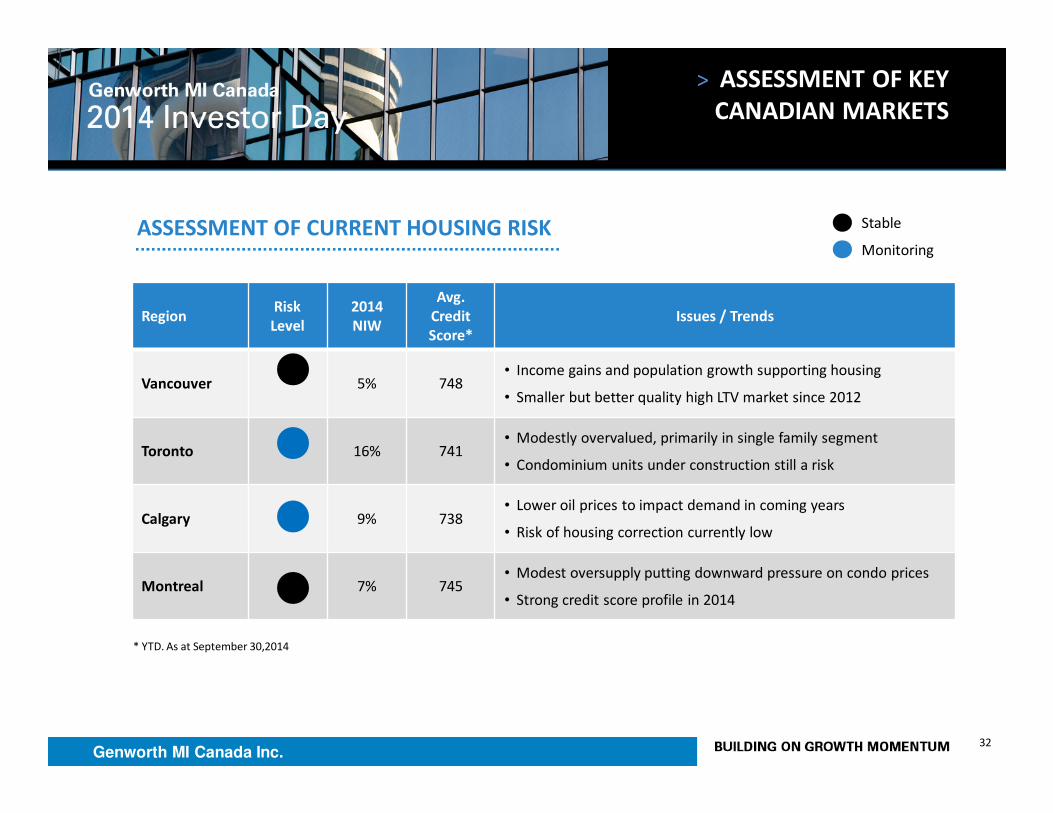
MIC Fixed Income Presentation – March 24, 2014Genworth MI Canada Inc. 32 32
> ASSESSMENT OF KEY
CANADIAN MARKETS
ASSESSMENT OF CURRENT HOUSING RISK
RegionRisk
Level
2014
NIW
Avg.
Credit
Score*
Issues / Trends
Vancouver 5% 748• Income gains and population growth supporting housing
• Smaller but better quality high LTV market since 2012
Toronto 16% 741• Modestly overvalued, primarily in single family segment
• Condominium units under construction still a risk
Calgary 9% 738• Lower oil prices to impact demand in coming years
• Risk of housing correction currently low
Montreal 7% 745• Modest oversupply putting downward pressure on condo prices
• Strong credit score profile in 2014
* YTD. As at September 30,2014
Stable
Monitoring
Genworth MI Canada Inc.

MIC Fixed Income Presentation – March 24, 2014Genworth MI Canada Inc. 33 33
> PORTFOLIO QUALITY
Region Average Home Price Average Income
Average
Gross Debt
Servicing
Genworth Market % Variance Genworth Genworth
Vancouver $449K $814K -45% $107K 28%
Toronto $436K $581K -25% $104K 29%
Calgary $413K $469K -12% $110K 27%
Montreal $280K $342K -18% $87K 25%
Canada $316K $419K -25% $97K 24%
GENWORTH’S AVERAGE HOME PRICE ~25% LOWER THAN MARKET AVERAGE
Note: Q3’14 data; Genworth averages for purchase deals only, market averages from CREA
GENWORTH SERVED MARKET
Genworth MI Canada Inc.

MIC Fixed Income Presentation – March 24, 2014Genworth MI Canada Inc. 34 34
Vancouver Toronto
Detached HomeCondo
High-riseDetached Home
Condo
High-rise
# of borrowers 1.9 1.5 1.8 1.4
Age 39 37 39 37
Credit score 747 751 738 745
Property price $630,000 $347,000 $499,500 $313,000
Income level $129,000 $92,800 $116,000 $90,000
Gross debt service
ratio30% 27% 29% 27%
> PORTFOLIO QUALITY
Note: Based on Genworth data as at September 30, 2014
STRONG BORROWER PROFILE IN MAJOR MARKETS
Genworth MI Canada Inc.
GENWORTH SERVED MARKET

MIC Fixed Income Presentation – March 24, 2014Genworth MI Canada Inc. 35 35
> PORTFOLIO QUALITY
Note: Company data: ~
27%
13%
11%
37%
13%
Alberta Other BC Ontario Quebec
% based on high loan-to-value new insurance written as at 2014 Q3 YTD
9% 8% 6%
18% 17% 15%
74% 75% 79%
0%
20%
40%
60%
80%
100%
2012 2013 2014 YTD
<660 660 - 669 >=700
Genworth MI Canada Inc.
CREDIT SCORE DISPERSION REGIONAL DISPERSION

MIC Fixed Income Presentation – March 24, 2014Genworth MI Canada Inc. 36 36
Key RisksRisk
LevelAssessment / Actions
Rising Interest Rates Affordability› 73% of borrowers YTD choosing 5-yr fixed rate mortgage
› Portfolio well positioned for modest rate increases
Debt levelsDebt-to-income
ratio
› Debt service ratios at historic lows
› Prudent home buying with manageable debt levels
Alberta - Oil pricesLower GDP in
2015-17
› Monitoring provincial economic health
› Enhanced due diligence in economically sensitive areas
> EMERGING TRENDS
Acceptable
MonitoringKEY RISKS
Genworth MI Canada Inc.

MIC Fixed Income Presentation – March 24, 201437 37Genworth MI Canada Inc.
> Positive economic and regulatory environment
> Portfolio quality continues to be strong
> Housing risk limited to isolated pockets
> Proactive response to emerging risks
> CONCLUSIONS

MIC Fixed Income Presentation – March 24, 201438 38Genworth MI Canada Inc.
> PHILIP MAYERS, CHIEF FINANCIAL OFFICER
CAPITALIZING ON STRONG CAPITAL POSITION

MIC Fixed Income Presentation – March 24, 201439 39Genworth MI Canada Inc.
PRIORITIES IMPACT ON FINANCIAL METRICS
› Prudent top line growth› Increasing premiums written
› Improving premiums earned
› Proactive risk management
› High quality insurance portfolio› Loss ratio In 15-25% range for 2014
› High quality investment portfolio › Investment income pressured by low rate environment
› Proactive approach to capital
management
› Operating modestly above MCT holding target of 220%
› Ongoing capital generation
› Strong ratings
> POSITIONED TO DELIVER ON
STRATEGIC PRIORITIES
TARGETING ROE EXPANSION OVER TIME

MIC Fixed Income Presentation – March 24, 201440 40Genworth MI Canada Inc.
GROWTH CATALYSTS
› Price Increase
Example: Impact of 2014 price increase on
$20 B of High LTV NIW
› Market Share Momentum Continuing
› Market Size - First-Time Homebuyers
45
70 70
2014 2015 2016
Incremental Premiums Written($MM)483 447
328 392
77 65
54
70
2012 2013 2013 Q3 YTD 2014 Q3 YTD
Portfolio Insurance High LTV
($MM)
> PREMIUMS WRITTEN
560 512 382 462
21% VPY
PREMIUMS WRITTEN
TOP LINE GROWTH IN 2014 DRIVEN BY HIGHER VOLUME & PREMIUM RATE INCREASE

MIC Fixed Income Presentation – March 24, 201441 41Genworth MI Canada Inc.
589 573 431 423
2012 2013 2013 Q3 YTD 2014 Q3 YTD
($MM)
45
70 70
2014 2015 2016
Incremental Premiums Written($MM)
2 10 20
40
2014 2015 2016 2017
Incremental Premiums Earned($MM)
EXAMPLE: IMPACT OF 2014 PRICE INCREASE
ON $20 B OF HIGH LTV NIW
› Declining trend coming to an end
› Higher insured volumes & 2014 price increase
should contribute to higher Premiums Earned
in 2015 and beyond
LTV = High Loan to Value
NIW = New Insurance Written
> PREMIUMS EARNED
PREMIUMS EARNED
PREMIUMS EARNED EXPECTED TO RISE IN COMING QUARTERS

MIC Fixed Income Presentation – March 24, 201442 42Genworth MI Canada Inc.
2,248 1,819 1,293 1,170
3,129 2,954 2,259 2,233
2012 2013 2013 Q3 YTD 2014 Q3 YTD
Net New Delinquencies Cures
> LOSSES ON CLAIMS
Loss Drivers:
› Continued home price appreciation
› Declining unemployment
› Proactive loss mitigation programs
NEW DELINQUENCIES NET OF CURES
33%
25% 26%
18%
2012 2013 2013 Q3 YTD 2014 Q3 YTD
LOSS RATIO
Results:
› High rate of cures
› Declining average paid claim severity
› Loss ratio of 18% Q3’14 YTD
8- Points VPY
5,377 4,773
3,552 3,403
Net
Cures
Total

MIC Fixed Income Presentation – March 24, 201443 43Genworth MI Canada Inc.
26%18%
18%
18%
2013 Q3 YTD 2014 Q3 YTD
Loss ratio Expense Ratio
$ MM (except EPS)2014 Q3
YTD
2013 Q3
YTD
Underwriting Income $270 240
Operating Investment
Income130 134
Interest Expense (18) (17)
Net Operating Income $283 $264
Investments $5,609 $5,435
Investment Yield 3.5% 3.7%
Operating ROE 12% 12%
Operating EPS (Diluted) $2.96 $2.70
› Strong underwriting performance driving improving profitability
› Investment yield continues to be pressured by low rate environment
› ROE stable at 12% as higher profitability was offset by higher capital levels
8-Points VPY44%
36%
> EARNINGS PROFILE
& KEY DRIVERS
COMBINED RATIO KEY FINANCIAL RESULTS
STRONG EARNINGS MOMENTUM GOING INTO 2015

MIC Fixed Income Presentation – March 24, 201444 44Genworth MI Canada Inc.
$ MM except NIWPre- Price
Increase
Post- Price
Increase
HLTV NIW - $ B $20 B $20 B
Average Premium Rate 2.30% 2.65%
Premiums Written / Earned $460 $530
Losses on Claims (161) (161)
Expenses (92) (95)
Underwriting Income 207 274
Loss Ratio 35% 30%
Expense Ratio 20% 18%
Combined Ratio 55% 48%
> IMPACT OF PRICE INCREASE
KEY HIGHLIGHTS
› 2014 price increase should translate
into higher underwriting profitability
› Annual pricing review - potential for
future price increases
LIFETIME UNDERWRITING INCOME EXAMPLE
2014 PRICE INCREASE A CATALYST FOR EARNINGS GROWTH IN COMING YEARS

MIC Fixed Income Presentation – March 24, 201445 45Genworth MI Canada Inc.
Diversify Globally
› IG Emerging Markets Debt› US CLOs (<3% of AUM / “A’ or Above)
› Hedge FX Risk
Diversify By Sector
› Market Weight Financials › Underweight Energy
Preserve Principal› Gov’t Bonds (~50% of AUM)
› Investment Grade Bonds
Protect From Rising Rates› Short Duration (3.6 Years)› Floating Rate Notes
Cash Flow Match Liabilities› Portfolio Duration < 5 Years
Enhance Income› Dividend Paying Equities› IG Emerging Markets Debt› US CLOs (<3% of AUM / “A” or Above)
ACTIVE PORTFOLIO
MANAGEMENT
› 4 External Managers
› In House Investment
Allocation & Oversight
› Focus on Investment
Grade Fixed Income
› Limited Appetite for
“Risk” Assets
1. Pre-tax equivalent book yield after dividend gross-up of general portfolio
$5.5 B INVESTMENT PORTFOLIO PRE-TAX YIELD1 OF 3.5% (SEPT. 30/14)
> DISCIPLINED APPROACH TO
INVESTMENT MANAGEMENT
IG = Investment Grade CLOs = Collateral Loan Obligations
YIELD CURRENTLY PRESSURED BY LOW RATES ... POSITIVE OUTLOOK FOR MEDIUM TERM

MIC Fixed Income Presentation – March 24, 201446 46Genworth MI Canada Inc.
$ MMSeptember 30,
2014
Assets
Cash and investments $5,609
Other Assets 258
Total Assets $5,867
Liabilities
Loss reserves 108
Unearned Premiums 1,763
Long Term Debt 432
Other Liabilities 242
Total Liabilities 2,545
Shareholders’ Equity 3,322
Total Liabilities and
Shareholders’ Equity$5,867
Book Value Per Share
(diluted)$34.57
> STRONG BALANCE SHEET
KEY HIGHLIGHTS
› $1.8 B of unearned premiums represent future
revenues & profits
› Illustration:
Unearned Premiums $1.8 B
Future Losses on Claims & Expenses1
(1.0)
Future Pre-tax Underwriting Income 0.8
Future Net Income $0.6 B
1. Future Loss on Claims & Expenses Calculated using 55% Combined Ratio

MIC Fixed Income Presentation – March 24, 201447 47Genworth MI Canada Inc.
Efficiency
Strength Flexibility
CAPITAL MANAGEMENT OBJECTIVES
> STRONG CAPITAL
CAPITAL STRENGTH
› Operate modestly above MCT Holding Target of 220%
› Conservative leverage of 12%
› Maintain Holding Company Cash & Marketable
Securities of >$100 MM
223% 224%
Dec. 31, 2013 Sept. 30, 2014
Minimum Capital Test

MIC Fixed Income Presentation – March 24, 201448 48Genworth MI Canada Inc.
Efficiency
Strength Flexibility
> STRONG CAPITAL
CAPITAL FLEXIBILITY & EFFICIENCY
› Target dividend payout ratio of 35 to 45%
› Pursue efficient capital structure using available levers
› Target leverage of 15% over the long run
› Share Buybacks & Special Dividends
› Optimize regulatory capital requirements
127 137
41 105
75
2013 2014
Ordinary Dividends Special Dividend
Share Buybacks
($MM)
$232 $253
CAPITAL RETURNED TO SHAREHOLDERS
CAPITAL MANAGEMENT OBJECTIVES

MIC Fixed Income Presentation – March 24, 201449 49Genworth MI Canada Inc.
POTENTIAL IMPACT OF PERFORMANCE LEVERS OVER TIME
Levers EPS ROE Comments
Price Increase ↑ ↑2014 price increase
Potential for future increases
Market Share Gains ↑ ↑ Capitalizing on momentum
Investment Yield
Improvement↑ ↑
10 Bps improvement in yield adds
$4MM in net operating income
Capital Optimization ↑Potential for a lower MCT Holding
Target reflecting the 2014 price
increase
> ROE EXPANSION
SEVERAL LEVERS TO DRIVE ROE EXPANSION OVER TIME

Q&A

> STUART LEVINGS, CHIEF OPERATING OFFICER
CLOSING REMARKS

MIC Fixed Income Presentation – March 24, 201452 52Genworth MI Canada Inc.
> Proven and sustainable business model
> Clear strategy for prudent growth
> Supportive market and regulatory environment
> Experts at managing mortgage default risk
> Solid financial position
> Experienced and engaged employees
> KEY TAKE-AWAYS
CANADA’S MORTGAGE INSURER OF CHOICE

53Genworth MI Canada Inc.
> SPEAKER BIOGRAPHIES
Brian led the establishment of
Genworth into the Canadian
marketplace in 1994 and later led it
through its initial public offering in
2009. He has more than 20 years of
senior management experience in the
mortgage insurance industry
worldwide. From 2004 to 2009 he led
Genworth’s activities and expansion in
key international markets. Prior roles
includes Senior Vice President,
International of General Electric’s U.S.
mortgage insurance business and
Senior Vice President of Sales and
Operations. As of January 1, 2015,
Brian will step down from the CEO
position and occupy the role of
Chairman of the Company.
Stuart has held a variety of senior
management positions within Genworth
Canada since joining the company in
2000. These roles include five years as
Chief Financial Officer prior to becoming
the Chief Risk Officer in January 2008.
More recently he has held the positions
of Chief Operations and Chief Operating
Officer, and effective January 1, 2015 he
will hold the position of President and
CEO. Stuart brings more than 20 years of
finance and general management
experience in financial services
businesses. Prior to joining the
Company, Stuart spent seven years with
Deloitte & Touche. He holds a Bachelor
of Accounting Science degree from the
University of South Africa and is a
member of both the South African and
Canadian Institutes of Chartered
Accountants.
Brian
Hurley
Chairman
and CEO
Stuart
Levings
Chief
Operating
Officer
54Genworth MI Canada Inc.
> SPEAKER BIOGRAPHIES
Philip became Chief Financial Officer
of the Company in 2009. He has
more than 25 years of finance and
general management experience in
financial services businesses. Since
joining the Company in 1995, Philip
has held several senior positions,
including Vice President, Finance,
Vice President, Operations, and
Senior Vice President, Business
Development. Prior to joining the
Company, he held finance positions
with Mortgage Insurance Company
of Canada, Esso Petroleum Canada
and Deloitte & Touche. He holds
CPA, CA and CMA professional
designations and has a Master of
Accounting degree from the
University of Waterloo.
Craig has more than 20 years of
professional experience in the
mortgage and banking industry.
Since joining the Company in 1998,
he has held senior positions in
Operations and Business
Development, including Director of
Risk Operations and Director of
Product Development. Craig holds
an Economics degree from
Carleton University and is a
member of the Canadian
Association of Accredited
Mortgage Professionals.
Philip
Mayers
Chief
Financial
Officer
Craig
Sweeney
Chief Risk
Officer

MIC Fixed Income Presentation – March 24, 201455 55Genworth MI Canada Inc.
> CONTACT INFORMATION
INVESTOR RELATIONS
www.genworth.ca
HEAD OFFICE
2060 Winston Park Drive
Suite 300
Oakville, Ontario
905-287-5300 (reception)
NATIONAL CALL CENTRE
1.800.511.8888
DIRECT CONTACT
Samantha Cheung, MBA
Vice-President, Investor Relations
905.287.5482