Investor a Presentation - DFM
28
a Dubai Financial Market www.dfm.ae Investor Presentation Q1 2017
Transcript of Investor a Presentation - DFM

a
Dubai Financial Market
www.dfm.ae
InvestorPresentation
Q 1 2 0 1 7

aDisclaimer
This Investor Presentation has been prepared by Dubai Financial Market PJSC (“DFM” or the “Company”) for investors,solely for informational purposes.
The information contained herein has been prepared to assist prospective investors in making their own evaluation of theCompany and does not purport to be all-inclusive or to contain all of the information a prospective or existing investormay desire. In all cases, interested parties should conduct their own investigation and analysis of the Company and thedata set forth in this information.
This presentation may contain statements that are not historical facts, referred to as “forward looking statements.” TheCompany’s actual future results may differ materially from those suggested by such statements.No representation or warranty is made by DFM or any of its advisers, agents or employees as to the accuracy,completeness or reasonableness of the information in this presentation or provided in connection with it. No informationcontained in this presentation or any other written or oral communication in connection with it is, or shall be relied uponas, a promise or representation and no representation or warranty is made as to the accuracy or attainability of anyestimates, forecasts or projections set out in this presentation. No liability will attach to DFM, with respect to any suchinformation, estimates, forecasts or projections. Unless otherwise stated, DFM owns copyright on the informationcontained herein. The information may not otherwise be reproduced and must not be distributed or transmitted to anyother person or used in any way without the express approval of DFM.
1
www.dfm.ae

Leading Exchange in the MENA Region
Established in 2000 as a government owned exchange
Provides investors and market participants with the best in class international platform that provides investors with innovativeproducts and services in conducting trading, clearing and settlement in an efficient, transparent and liquid environment
First regional exchange to be publicly listed in 2007
Currently 80% owned by Borse Dubai and remaining is public float
aDFM at a Glance
Volumes(Q1 2017)
AED 753.5mAverage Daily Traded Value 49%
Market VelocityAED 48bn
Value of Share Trading
Listings(31-Mar-2017)
AED 394bnMarket Capitalization
67Bonds/Sukuks Listed
on the DFM / Nasdaq Dubai with a value of bn 54$
61Companies Listed on the DFM
Consolidated Financials(Q1 2017)
AED 439.3mRevenue
AED 253.5mNet Income
AED 325.1mEBITDA
Volume by Investor Type(Q1 2017)
42.4%Foreign Investors’ Trading
Share
19.1%Foreign Ownership (% of Market Cap)
27.8%Institutional Investors’
Trading Share
Source: Bloomberg, ZawyaNote: Foreign investors defined as non-UAE investors. Financial information and trading statistics for DFM (excluding Nasdaq Dubai) for the year 2016
2
www.dfm.ae
2
Presenter
Presentation Notes

aThe UAE Benefits
from Strong Demographic & Macroeconomic Fundamentals
4.7%
3.1% 3.1% 3.1%2.6% 3.0%
1.3% 1.4% 1.1%
Egy
pt
Turk
ey
Pol
and
UA
E
Qat
ar
Kuw
ait
Sau
di A
rabi
a
Sou
th A
frica
Rus
sia
2015E-2020E Real GDP Growth (%) 2015E-2020E Population Growth (%)2
High GDP Growth… Growing Population…1 2
2.8%
2.2%1.9% 1.7%
1.5%1.0% 0.8%
0.1% (0.0)%
Qat
ar
Egy
pt
Kuw
ait
KSA
UA
E
Turk
ey
Sou
th A
frica
Rus
sia
Pol
and
4.5% 4.7% 4.9% 4.9% 5.1% 5.1% 5.3% 5.2% 5.3%62.5 64.7 67.3 67.8 69.3 71.1 71.4 72.6
2008 2009 2010 2011 2012 2013 2014 2015 2016
Index of Economic Freedom
GCI (%) Index of Economic Freedom
Glo
bal C
ompe
titiv
enes
s In
dex
(GCI
)
Source: The UAE National Bureau of Statistics, Euromonitor, Bloomberg, World Economic Forum, Emirates NBD, The Heritage Foundation, IMF•1 At current prices.•2 Annual growth over 2015-2020.•3 Includes quarrying, electricity, gas and water, restaurants and hotels, social and personal services.
…Resulting in Stable Business Environment
UAE Competitiveness Index & Index of Economic Freedom
53 53 5553 54 54
55 55 54 53 54 55 55 56 56
50
UAE Non-Oil Private Sector PMI
Increasing Rate of Growth
Increasing Rate of Contraction50 – No Change vs. Previous Month
Sustained Growth in Non-Oil Economy...
www.dfm.ae
3 4
3
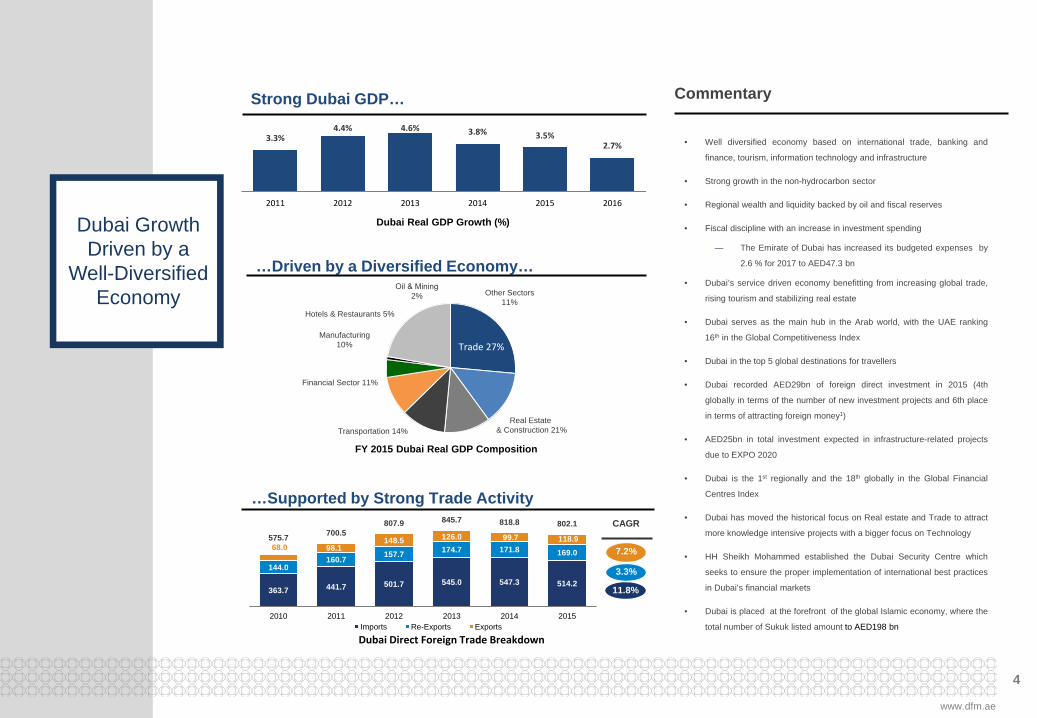
aDubai Growth Driven by a
Well-Diversified Economy
Trade 27%
Real Estate & Construction 21%Transportation 14%
Financial Sector 11%
Manufacturing 10%
Hotels & Restaurants 5%
Oil & Mining2% Other Sectors
11%
363.7 441.7 501.7 545.0 547.3 514.2
144.0160.7 157.7 174.7 171.8 169.068.0 98.1
148.5 126.0 99.7 118.9575.7 700.5807.9 845.7 818.8 802.1
2010 2011 2012 2013 2014 2015Imports Re-Exports Exports
CAGR
11.8%
3.3%
7.2%
3.3%4.4% 4.6% 3.8% 3.5%
2.7%
2011 2012 2013 2014 2015 2016
…Driven by a Diversified Economy…
…Supported by Strong Trade Activity
FY 2015 Dubai Real GDP Composition
Dubai Real GDP Growth (%)
Dubai Direct Foreign Trade Breakdown
• Well diversified economy based on international trade, banking and
finance, tourism, information technology and infrastructure
• Strong growth in the non-hydrocarbon sector
• Regional wealth and liquidity backed by oil and fiscal reserves
• Fiscal discipline with an increase in investment spending
— The Emirate of Dubai has increased its budgeted expenses by
2.6 % for 2017 to AED47.3 bn
• Dubai’s service driven economy benefitting from increasing global trade,
rising tourism and stabilizing real estate
• Dubai serves as the main hub in the Arab world, with the UAE ranking
16th in the Global Competitiveness Index
• Dubai in the top 5 global destinations for travellers
• Dubai recorded AED29bn of foreign direct investment in 2015 (4th
globally in terms of the number of new investment projects and 6th place
in terms of attracting foreign money1)
• AED25bn in total investment expected in infrastructure-related projects
due to EXPO 2020
• Dubai is the 1st regionally and the 18th globally in the Global Financial
Centres Index
• Dubai has moved the historical focus on Real estate and Trade to attract
more knowledge intensive projects with a bigger focus on Technology
• HH Sheikh Mohammed established the Dubai Security Centre which
seeks to ensure the proper implementation of international best practices
in Dubai’s financial markets
• Dubai is placed at the forefront of the global Islamic economy, where the
total number of Sukuk listed amount to AED198 bn
Commentary
www.dfm.ae
Strong Dubai GDP…
4

aDFM Diversified
Product Offering
Diversified product offering including trading of equity and debt instruments, and financial services to investors and market participants
Membership (Access and use of DFM trading platform)
Equity Instruments (Primary, Dual and Foreign entity listing)
Debt Instruments (Sukuks and Bonds)
Equity Derivatives (Traded through Nasdaq Dubai only)
Securities Lending and Borrowing
iVESTOR
Dividend Payment Services
Investor and Issuers ServicesMarket Data
TradingListing
Equities
Sukuks / Bonds
ETFs
Mutual Funds
REITs
Right Issues
“Second Market”
Post Trading
Real-time data
Delayed data
Historical data
Indices
IPO / rights issue service through electronic subscription platform
AGM / EGM Services
Voting Services
Settlement
Custody
Clearing
Note: DFM has recently launched it first ETF : June 2016Nasdaq Dubai has launched derivative trading- September 2016
www.dfm.ae
5

Better ring fence into separate legal entities
More efficient use for clearing members
CCP may become a regional CCP to clear and
settle trades
ALLOCATIONACCOUNT
Investors will be able to go short in a downward
market
REGULATEDSHORT SELLING
Investors can execute RSS with a locate
confirmation
Benefits fund managers who seek a single price for
their managed funds
Will enable execution of bulk trades
a
Post Trade Infrastructure to
increase liquidity and
revenue
CCP (CENTRAL
COUNTERPARTY)
6
www.dfm.ae

0.41.1
2.21.4
2.3
5.7
11.1
12.5
0
2
4
6
8
10
12
14
2010 2011 2012 2013 2014 2015 2016 2017
DFM managed 100% of issuers dividends which were mostly paid through electronic channels
aStrong
Track RecordOf Dividend
Management
7
www.dfm.ae

aOperational Highlights
32 49
160
382
151 13348
2011 2012 2013 2014 2015 2016 Q1 2017
182 184260
323 308 339394
2011 2012 2013 2014 2015 2016 Q1 2017
Market Capitalization (AEDbn) Total Traded Value (AEDbn)
128 194
642
1,520
603 533754
2011 2012 2013 2014 2015 2016 Q1 2017
Market Velocity1 (%)ADTV (AEDm)
Note: Figures exclude Nasdaq Dubai1 Defined as annual traded value end of year / market capitalization.
www.dfm.ae
38.2%
98.0%111.8%
75.9%
130.9%
81.4%
35.0%17.8%
26.8%
61.6%
118.3%
49.1%
39.2% 49.0%
56.0%
56.1%
63.4%76.7%
72.4%74.6%
61.3%52.8% 49.1%
48.2%
52.9%
58.6%
37.1% 33.8%
2004 2005 2006 2007 2008 2009 2010 2011 2012 2013 2014 2015 2016 Q12017
DFM Market Velocity and Average Velocity for Global Exchanges
DFM Velocity Global Average Velocity
8

aDFM Presents
Significant Growth
Opportunities
3,525
2,6222,322
1,926
767599
1,831 1,806
1,124
377 352 246 1754468 60
0
500
1,000
1,500
2,000
2,500
3,000
3,500
4,000
Japa
nE
xcha
nge
LSE
NY
SE
Hon
g K
ong
Exc
hang
es
NS
E In
dia
She
nzhe
n S
E
Sha
ngha
i SE
Sin
gapo
reE
xcha
nge
Deu
tsch
eB
orse
Joha
nnes
burg
SE BM
&FB
oves
pa
Mos
cow
Exc
hang
e
Tada
wul
AD
X
DFM
Qat
ar S
tock
Exc
hang
e
Equity Market Capitalisation to GDP Number of Listed Companies145%
126% 121%
84% 79% 74% 72% 68%59%
37% 34% 29%
USA UK Japan France Qatar China India Saudi UAE Russia Brazil Turkey
Equity Market Velocity as of end of August 2016 ADTV (AEDmn)
410.6%
125.5%
100.8%
76.4%42.3% 42.1% 30.3%
363%
184%
69% 69% 45%22% 22% 12%39.2%
11.3%
Nas
daq
- US
She
nzhe
n S
E
Sha
ngha
i SE
Japa
nE
xcha
nge
NY
SE
Deu
tsch
eB
orse
BM
&FB
oves
pa
Tada
wul
NS
E In
dia
Hon
g K
ong
Exc
hang
esJo
hann
esbu
rgS
E
DFM
Sin
gapo
reE
xcha
nge
LSE
Mos
cow
Exc
hang
e
Qat
ar S
tock
Exc
hang
e
AD
X
0
50000
100000
150000
200000
250000
300000
NYS
E
Shen
zhen
SE
Shan
ghai
SE
Japa
nEx
chan
ge LSE
Hong
Kon
gEx
chan
ges
Deut
sche
Bors
e
NSE
Indi
a
BM&
FBov
espa
Joha
nnes
burg
SE Tada
wul
Sing
apor
eEx
chan
ge
Mos
cow
Exch
ange
DFM
Qat
ar S
tock
Exc
hang
e
ADX
Source: Euromonitor, World Bank, World Federation of ExchangesNote: Statistics as of Dec-2016; Number of listed companies as of 31-Jan-20161 Based on market capitalization over nominal GDP.2 Calculated as annualized trade value / end of period market capitalization.
www.dfm.ae
9

aStrong and
Growing Foreign
Investor Base
– DFM continues its efforts, in co-operation with issuers and investment banks, to attract foreign investors’ interest in DFM listed companies
– UAE was classified as a global emerging market in 2014 by MSCI and S&P Dow Jones
– Net foreign investment flowing to the DFM market during 2014 was AED 4 billion (excluding Arabs and GCC nationals)
– Foreign investors interest continued in 2016 as they were net buyers of AED 2.37 billion (excluding Arab and GCC nationals) in 2016
– Foreign investors continue to show confidence in the quality and diversity of investment opportunities that the DFM offers
11.2% 11.7%
16.0% 16.0% 16.7%
21.9%19.1%
2011 2012 2013 2014 2015 2016 2017
43.8%42.4%
2014 Q1 2017
Foreign Investors’ Trading Share
Foreign Ownership (% of Market Cap)
AED 2.37bnNet buying by
foreign investors (excluding Arab and
GCC nationals)
Source: DFM AnalyticsNote: Foreign investors defined as non-UAE investors. Figures excluding Nasdaq Dubai
www.dfm.ae
10

aIncreasing Institutional
Investor Base
Institutional 81.1%
Retail18.9%
Share Ownership Split
– The DFM has attracted increasing institutionsinvestor base, in light of the sound national economyand the continuous improvement of listed companies’performance
– Institutional investors own 81% of the stock listed onthe DFM as of the end of Q1 2017 .
– Active institutional investor participation in tradingwith stocks bought accounting for 29.2 % of the totaltraded value in 2016 and 29.2 % in 2016
Commentary
23.7%
2013 Q1 2017
27.8 %
69.9%
2013 Q1 2017
Institutional Trading Share (%) Institutional Ownership (% of Market Cap)
Source: DFM AnalyticsNote: Figures excluding Nasdaq Dubai
www.dfm.ae
11

a
DFM is Not Yet Reflecting the
Diversity in Dubai’s
Economy
Trade, manufacturing, construction, transport and real estate are the biggest contributors of Dubai’s
economy
Unlike the economy, the DFM market is concentrated, on financials, real estate and construction. These
sectors collectively represent 34% of the economy but over 80% of the market capitalisation
This represents significant opportunities for DFM as there is a strong pool of sectors and companies to
be listed in the future
FY 2015 Dubai GDP Breakdown DFM Sector Breakdown
Source: Dubai Statistics Centre, DFM Analytics1 Based on value of owned stock.
Trade29%
Real Estate& Construction
22%
Transportation15%
Financial Sector12%
Manufacturing11%
Hotels & Restaurants6%
Oil & Mining2% Other Sectors
3%
Financial Sector 51.6%
Real Estate andConstruction 30%
Telecommunications7.2%
Transportation6.2%
Consumer Staples2.8%
Services1.2%
Industrials 1%
www.dfm.ae
12

aDFM Stock Trading Activity
DFM is One of the Most Liquid Stocks on the Exchange
12.2
29.026.3
11.4 11.0
23.1
13.1
52.3
82.8
21.1
13.8
29.7
2012 2013 2014 2015 2016 Q1 2017
Average Traded Volume (m) Average Traded Value (AEDm)
Source : DFM Analytics
www.dfm.ae
13

aFinancial Highlights
DFM continues to provide advanced and innovative products/services as part of its strategy targeting the diversification of revenue streams and increase in non-trading commission income
85.1%72.7% 64.8%
5.7%12.5%
15.1%
9.2%14.8% 20.1%
2014 2015 2016
947.3
461.3
2014 2015 2016
Total Revenue (AEDm) Total Revenue Mix (%)
Trading Commission Fees Net Investment Income Other Fee Income
454.2
759.8
261.8 253.4
2014 2015 2016
80.2%
55.8%56.8%
Net Profit (AEDm) and Net Profit Margin (%)
829.7
331.1 325.1
2014 2015 2016
71.8% 71.5%
87.6%
EBITDA (AEDm) and EBITDA Margin (%)
Note: Consolidated financial statements; EBITDA includes investment income and other income
www.dfm.ae
14

aStable Expense Base
71.7 78.7 83.8 80.5
16.817.7
24.5 38.911.2
13.3
12.4
13.4
7.6
7.9
9.4
9.4
7.06.5
5.8
8.1
1.01.0
1.1
1.162.462.4
62.462.4
2013 2014 2015 2016
177.6187.4
199.5
Breakdown in AED
Cost to Income Ratio1 38.7% 19.8% 43.2%
DepreciationRent
Maintenance Expenses
Other Expenses
Amortization of Intangible Assets
Payroll & Other Benefits
Interest Expense
43.8%
www.dfm.ae
15

aDividend Payout History
141%
74%
153%
2013 2014 2015
400
560
400
2013 2014 2015
0.05 0.07 0.05
Dividends (AEDm)
Dividend Payout (% of Net Profit)1
Dividend AED Per Share
Selected Balance Sheet Items
(AEDm) 2014 2015 2016
Investment Deposits 2,780 2,303 2,200
Financial Assets Measured at Fair Value 718 702 836
Goodwill 2,879 2,879 2,879
Other Intangible Assets 2,384 2,322 2,259
Property and Equipment 15 21 262
Total Assets 9,002 8,535 8,850
Total Equity 8,431 8,046 7,920
Note: Consolidated financial statements1 Calculated as dividend (paid following year) divided by the net profit of the year.
www.dfm.ae
16

a
Strong Balance Sheet with Significant Financial Assets
Financial Assets Breakdown
Commentary
– Investment Deposits:
• Investment deposits are placed with financial institutions in the UAE
• They carry profit rates ranging from 2 % to 3% per annum
– Other Financial Assets:
• All recognized financial assets are measured at either amortized cost or fair value
95% of the other financial assets are invested within the UAE
Financial Assets(AEDm) 2016
Cash and Cash Equivalents 370
Investment Deposits 2200
Less than 3 Months 510
Up to 1 Year but More than 3 Months 1,395
More than 1 Year1 294
Other Financial Assets Measured at Fair Value – (FVTOCI) 837
Investment in Equity Securities 365
Managed Funds 267
Investment in Sukuk 205.6
Total 3,407
Note: Consolidated financial statements
InvestmentDeposits
64%Equity11%
Managed Funds8%
Cash & Cash Equivalents
11% Sukuk6%
www.dfm.ae
17

VISION: THE WORLD-CLASS REGIONAL MARKETPACE
MISSION: TO PROVIDE STAKEHOLDERS WITH INNOVATIVE SERVICES IN CONDUCTING TRADING, SETTLEMENT AND DEPOSITORY OF SECURITIES, IN AN EFFICIENT, TRANSPARENT AND LIQUID
ENVIRONMENT.
FIVE STRATEGIC PROGRAMS
STAKEHOLDER VALUE
ADVANCEMENT OF TECHNOLGICAL SOLUTIONS
MAXIMISING INVESTOR SERVICES TO MEET EVOLVING
NEEDS
aDFM
Strategic programs
2021
www.dfm.ae
18
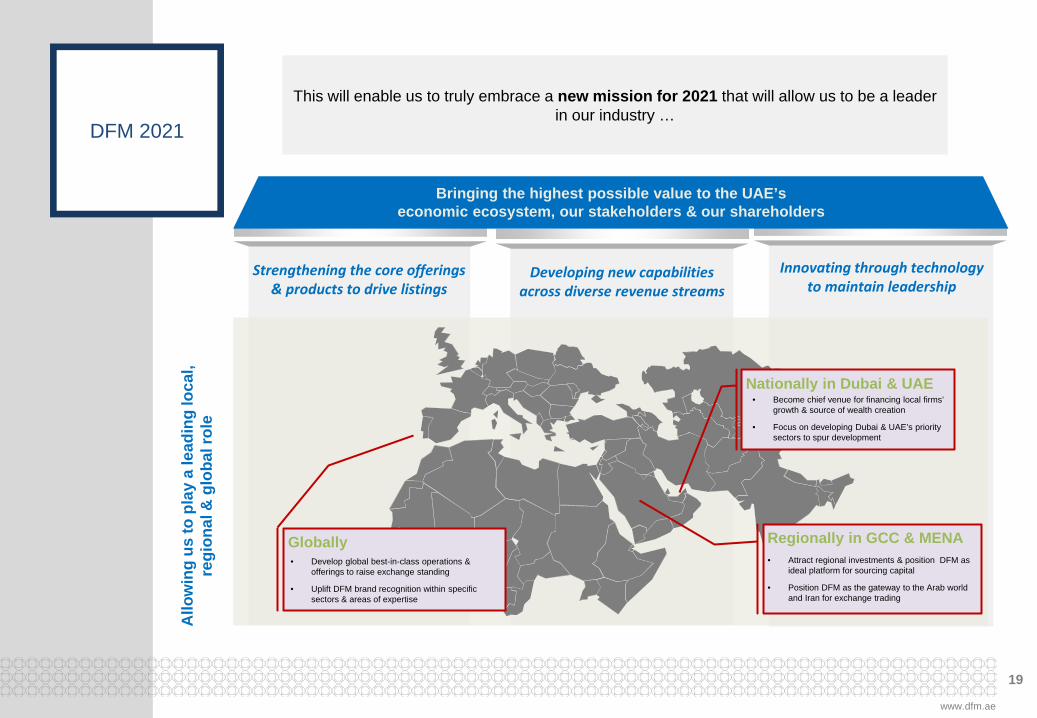
aDFM 2021
This will enable us to truly embrace a new mission for 2021 that will allow us to be a leader in our industry …
Innovating through technology to maintain leadership
Allo
win
g us
to p
lay
a le
adin
g lo
cal,
regi
onal
& g
loba
l rol
e
Nationally in Dubai & UAE
Regionally in GCC & MENAGlobally
• Become chief venue for financing local firms’ growth & source of wealth creation
• Focus on developing Dubai & UAE’s priority sectors to spur development
• Attract regional investments & position DFM as ideal platform for sourcing capital
• Position DFM as the gateway to the Arab world and Iran for exchange trading
• Develop global best-in-class operations & offerings to raise exchange standing
• Uplift DFM brand recognition within specific sectors & areas of expertise
Developing new capabilities across diverse revenue streams
Strengthening the core offerings & products to drive listings
Bringing the highest possible value to the UAE’s economic ecosystem, our stakeholders & our shareholders
www.dfm.ae
19
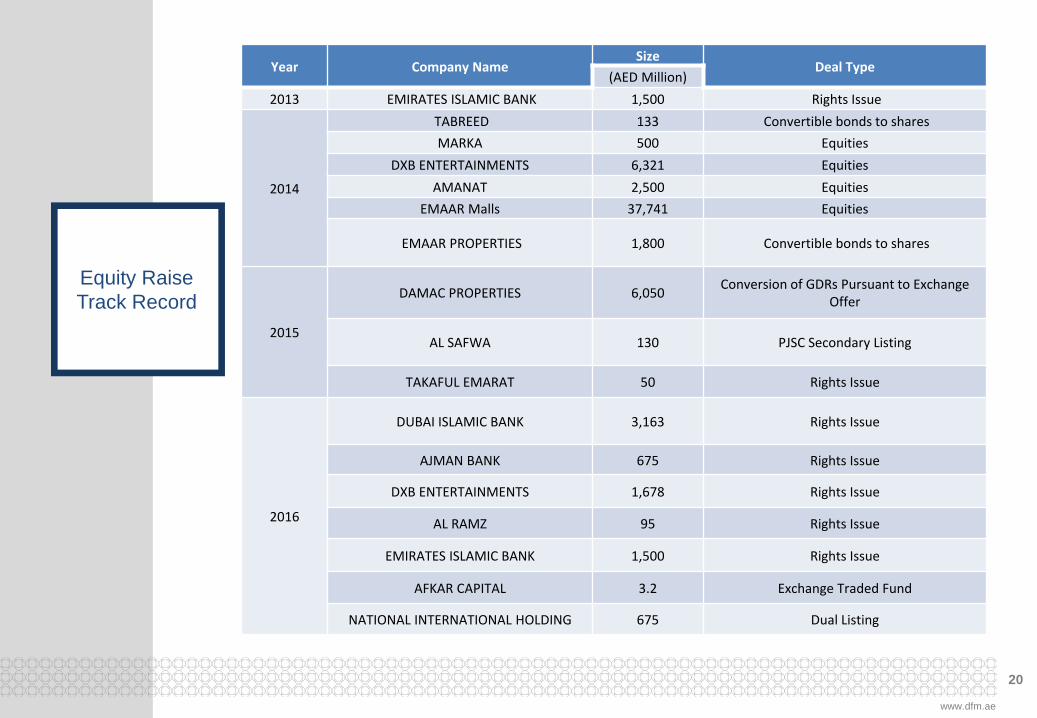
Year Company NameSize
Deal Type(AED Million)
2013 EMIRATES ISLAMIC BANK 1,500 Rights Issue
2014
TABREED 133 Convertible bonds to sharesMARKA 500 Equities
DXB ENTERTAINMENTS 6,321 EquitiesAMANAT 2,500 Equities
EMAAR Malls 37,741 Equities
EMAAR PROPERTIES 1,800 Convertible bonds to shares
2015
DAMAC PROPERTIES 6,050 Conversion of GDRs Pursuant to Exchange Offer
AL SAFWA 130 PJSC Secondary Listing
TAKAFUL EMARAT 50 Rights Issue
2016
DUBAI ISLAMIC BANK 3,163 Rights Issue
AJMAN BANK 675 Rights Issue
DXB ENTERTAINMENTS 1,678 Rights Issue
AL RAMZ 95 Rights Issue
EMIRATES ISLAMIC BANK 1,500 Rights Issue
AFKAR CAPITAL 3.2 Exchange Traded Fund
NATIONAL INTERNATIONAL HOLDING 675 Dual Listing
aEquity Raise Track Record
20
www.dfm.ae

a
Strategic Milestones
Building Strong IPO
Pipeline
2009Research over 500
companies in the UAE
2010 -2013Dialogue with top 100 companies in prime
position of going public on DFM
2011Research over 500 companies in the
region, CIS, and Africa
20144 IPO listings in DFM
2015New Company Law to
drive IPO market
2016UAE New Company Law
5 rights Issues
2017Launch of DFM’s “IPO
Communications Guide”
2009 Step by Step “DFM Guide to going public” launched 2013
MOU with Dubai SMEs 2nd Access to Capital Seminar for SMEs Nasdaq Dubai IPO Guide Road show for IPO in India & Kuwait 2nd IPO Retreat on November 19th,2013
2010 IPO Market Study Results from one on one with 40 potential IPO candidates 2014
4 IPOs eIPO system launched IPO checklist
2011 IPO Retreat for private, semi-government and family
owned businesses MOU with JAFZA
2015 3rd DFM IPO forum Re- Listing of Amlak – DAMAC listing First Company on Second market (Al Safwa)2012 Access to Capital Seminar
Regional IPO Market Study
2016
DFM Corporate Governance Workshop Launch of DFM’s IPO communications Guide. 1st IPO Advisory Roundtable 2nd IPO Advisory Roundtable
2017
Interactive educational IPO web page 4th IPO Forum ( Oct 2017) Family Business Private Retreats Second market listings & Registry Services
21
www.dfm.ae

aAPPENDIX
www.dfm.ae
22

aDFM
Consolidated P&L
Note: Consolidated financial statements
(AEDm) 2014 2015 2016
Trading Commission Fees 806.0 335.2 294.6
Brokerage Fees 15.0 19.4 20.6
Clearing, Settlement and Depositary Fees 55.9 34.8 39.7
Listing and Market Data Fees 8.8 9.3 9
Other Fees 3.3 4.5 5.1
Operating Income 889.0 403.2 369.4
Investment Income 54.4 57.7 68.4
Other Income 3.8 0.4 5.3
Change in Fair Value Gain on Gifted Land - - 231.3
Total Income 947.3 461.3 454.2
Payroll and Other Benefits (78.7) (83.8) (80.5)
Other General & Administrative Expenses (30.9) (38.8) (37)
Rent (7.9) (9.4) (9.4)
Depreciation (6.5) (5.8) (8.1)
Amortization of Intangible Assets (62.4) (62.4) (62.4)
Interest Expense (1.0) (1.1) (1.1)
Total Expenses (187.4) (198.4) (199.3)
Provision for Impairment Against Investment Deposit - - (226.0)
Net Profit for the Year 759.8 261.8 253
Attributable to:
Owners of the Company 759.3 261.0 253
Non-controlling Interest 0.5 0.08 0.3
EPS (AED) 0.095 0.033 0.032
www.dfm.ae
23

a
Relationship with Nasdaq
Dubai & Regulatory Authority
Regulatory Authorities
Stock Exchanges
ADX DFM Nasdaq Dubai
SCA(UAE Regulations)
DFSA (International Regulations)
79.62%
20.38%
66.67%
Public Stake
33.33%
Ownership Structure 100%
www.dfm.ae
24

aNew Company Law Supporting
IPO Market
Requirements Old New
Offer Size Not be less than AED 10 million Not be less than AED 30 million
Founders Minimum 10 founding shareholders Minimum 5 founding shareholders
Founders Hold Founders hold not less than 20% and not more
than 45% of the total authorized Share Capital Founders hold not less than 30% and not more than 70% of the
total authorized Share Capital
Refund Days Two weeks 5 Days
Sell Down Not allowed Max. 30% from the capital
Subscriptions Period 90 Days 30 Days
Pricing Fixed price only - Book building allowed by
regulatory approval Book Building is now available for the companies as an another
option with fixed price
Underwriting No underwriting or sponsor required Underwriting could be applied and will be regulated by a
ministerial decree
Employee Stock Option
Not recognized Allowed
Foreign Ownership 49% maximum foreign ownership 49% maximum foreign ownership but some exception can be
granted upon ministerial decision
• Only changes associated to IPO related matters are listed above
• The above excludes Government owned entities as they may have special exemptions
• The law is applicable on free zone (off shore) companies but only those that are allowed by regulations to operate onshore
www.dfm.ae
25

aInvestor
Relations Contacts
For Additional Investor Relations Information
Investor Relations Website:www.dfm.ae/dfm-investor-relations
Investor Relations Contacts:
Racha El Hassan Chamut Head of Investor RelationsTel: +971 4 305 [email protected]
Areej Al SaeedManager Chairman's OfficeTel: +971 4 305 5607 [email protected]
www.dfm.ae
https://www.myirapp.com/dfm/
26

Disclaimer:
The information provided in this document (“Information”) is provided by way of general information and comment only. While reasonable care has been
taken in producing this Information, changes in circumstances may occur at any time and may impact on the accuracy of the Information. The Information
does not constitute professional advice or provision of any kind of services and should not be relied upon as such. Neither Dubai Financial Market (“DFM”)
nor NASDAQ Dubai Limited (“NASDAQ Dubai”) and/or their affiliates, officers or employees, give any warranty or representation as to the accuracy,
reliability, timeliness or completeness of the Information now or in the future. Neither of DFM or NASDAQ Dubai shall be liable for any loss suffered, directly
or indirectly by any person acting in reliance upon the Information contained herein. No part of the Information provided is to be construed as a solicitation
to make any financial investment. Information, including forecast financial information and examples should not be considered as a recommendation in
relation to holding, purchasing or selling securities or other instruments. The information does not take into account any investor’s individual investment
objectives, financial position and particular investment needs. As such, before making any decision, investors should conduct their own due diligence and
consult their financial advisors. The performance of trading securities or instruments is not guaranteed and past performance is not an indication of future
performance. Unless otherwise stated, DFM and NASDAQ Dubai own copyright in the Information contained herein. The Information may not otherwise be
reproduced and must not be distributed or transmitted to any other person or used in any way without the express approval of DFM and NASDAQ Dubai.
www.dfm.ae
Contact Us:
INVESTOR RELATIONST: +971 4 305 5650, F +971 4 305 5191Email: [email protected]
DFM is regulated by the Securities and Commodities Authority (SCA)
www.dfm.ae
@dfmalerts @dubaifinancialmarket Dubai Financial Market
27