InvestmentTrends RERC CCIM
26
Sponsored by: RERCsCCIM InvestmentTrends QUARTERLY Second Quarter 2012 Report s Vol. 8, No. 2
Transcript of InvestmentTrends RERC CCIM

Sponsored by:
RERCsCCIM
InvestmentTrendsQUARTERLYSecond Quarter 2012 Report sVol. 8, No. 2

1Investment Trends Quarterly s Copyright© 2012 by Real Estate Research Corporation (RERC) and the CCIM Institute.
May 2012
Dear Readers,
As we experience another slow period in our uncertain economy, the frustrations expressed by many CCIM members are understandable. We have been through these downturns before—positive momentum in the na-tional economy, only to slip back to slower growth when new risks or weaker-than-expected data are released. In this case, investment survey respondents are concerned about the widening recession in Europe, the political gridlock of our government and failure to deal with increasing debt, the still weak housing market, and lack of job growth.
With respect to commercial real estate, property volume on a 12-month trailing basis increased about 5 percent for most property types, except for apartment sector volume, which increased 10 percent. However, on a current-quarter basis, volume was down by about 25 percent on average for each property type (except for the hotel sector), although the size-weighted average price per foot/unit was up or remained steady for each property type.
The most positive trend we noted is that institutional investors are finally moving beyond the coastal markets, and we are seeing some significant transactions in areas like Chicago and Denver. In fact, secondary markets like Atlanta, Charlotte, Houston, Austin, Nashville, etc. are where some of the strongest power moves are happening at present. Unfortunately, it will be some time yet before the tertiary markets gather steam.
As always, we would like to thank those CCIM members who responded to RERC’s surveys, as we work to com-pile, analyze, interpret, and report the research to all readers. We appreciate your knowledge, your views, and your commitment to the industry.
Sincerely,
Kenneth P. Riggs, Jr., CCIM, CRE, MAIChairman & PresidentReal Estate Research Corporation (RERC)
Leil Koch, CCIM2012 CCIM Institute PresidentEquity One Real Estate, Inc.
F o r e w o r d

2Investment Trends Quarterly s Copyright© 2012 by Real Estate Research Corporation (RERC) and the CCIM Institute.
Growth Slows Slightly
The broad-based economic reports included in the Federal Reserve’s April 11, 2012 issue of the Beige Book were gen-erally quite positive, with the 12 Federal Reserve districts indicating that the U.S. economy expanded at a “modest to moderate pace” from mid-February to late March 2012. Although there was concern about rising oil prices, there were increases in manufacturing in most districts, the de-mand for professional business services was mostly higher, and retail spending grew. Since the time of that release, however, we learned that durable goods fell in March 2012 by 4.2 percent, the greatest decline in three years, and that manufacturing has started to slow in some regions, accord-ing to the Commerce Department.
In addition, gross domestic product (GDP) growth slowed to 2.2 percent in first quarter 2012, following a revised growth rate of 3.0 percent in fourth quarter 2011. When measuring economic growth after other recessions, the growth we are currently experiencing makes this recovery period the slow-est we have seen in our nation’s history, including the recov-ery period after the Great Depression. The Federal Reserve plans to conclude its $400 billion program for purchasing long-term Treasurys and selling short-term securities in June 2012 (“Operation Twist”), but stated that it remains prepared to do more if needed.
Employment Growth Sputters
As first quarter 2012 came to a close, job growth began to slow. Only 120,000 new non-farm jobs were added in March, about half of what economists were expecting, and the first time since November 2011 that fewer than 200,000 new jobs were added per month, reported the Bureau of Labor Statistics (BLS). So far, April’s numbers are not any better. According to the Labor Department, new applica-tions for jobless benefits are increasing again (upwards of
350,000 new claims for jobless benefits for each week in April).
Even so, the unemployment rate declined slightly to 8.2 per-cent in March 2012, with employment increasing in manu-facturing, in food services and drinking establishments, and in health care, but declining in retail trade. According to the BLS, the lower unemployment rate is because more indi-viduals gave up looking for work and left the labor force. The employment/population ratio declined to 58.5 percent in March.
Risk from Europe Continues
Although we saw it coming, the starkness of the headlines from Europe during the last week in April 2012—S&P Cuts Spain Rating, UK Back in Recession, Dutch Government Close to Collapse, Sarkozy Fights for Survival, Italy’s Bor-rowing Costs Rise—were jarring. We have been reading about the sovereign debt crisis in Greece, Ireland, and Por-tugal, along with the fiscal problems in Italy and Spain, for months, but as other countries are being drawn into the fray, we can see how critical this situation remains.
Although the situation in Europe remains a drag on the U.S. economy, most economic analysts believe that the U.S. has more discretion than Europe as it comes to terms with its debt levels. However, others point out that the fiscal chal-lenges in the U.S. are very similar to those of Europe—the need to find the right balance between reducing spending and raising revenues in order to lower the national debt without putting the lid on economic growth.
U.S. Debt Climbs
With federal spending approximately $3.6 trillion a year and federal revenues only about $2.3 trillion a year, the annual deficit of $1.3 trillion has ballooned to a national debt of
I n v e s t m e n t E n v i r o n m e n tThe economic doldrums we have been going through for the past few years are frustrating to the majority of us. We are disappointed by the slow overall growth in the economy and the slack that results in still-high unemployment. There are concerns about the inflation we are seeing in food and energy prices, and about the rise in interest rates that we know must eventually come. The weak housing market, the millions of foreclosures in the pipeline, and the seemingly endless reports about slow demand are worrisome. And we are exasperated by our government’s inability (or unwilling-ness) to manage the nation’s debt, especially when we look
to the debt crisis in Europe and see numerous examples of what can happen if debt is not addressed.
Despite the uncertainty about the economy, CCIM members are generally more confident about commercial real estate and the relative safety that commercial property offers as an investment in these tumultuous times. Much less volatile than stocks, with better returns than those available with cash or Treasurys, commercial real estate is still a good alternative for risk-averse investors.
E c o n o m i c H i g h l i g h t s

3Investment Trends Quarterly s Copyright© 2012 by Real Estate Research Corporation (RERC) and the CCIM Institute.
$15.7 trillion. As such, the U.S. is facing another financial crisis (as well as another debt ceiling) at the end of this year if our nation’s leaders fail to address the automatic tax increases and spending cuts scheduled to commence in January 2013. (Most political experts do not expect the president and Congress to address this issue, nor those associated with entitlement spending and tax reform, until after this fall’s elections.)
Chairman Ben Bernanke has stated that the Federal Re-serve will not be able to offset the major blow to the econ-omy that the combination of expiring tax reductions and cuts in government spending would cause on January 1, 2013, calling them a “fiscal cliff” and “a significant risk to the economy.”
Additional risk associated with not dealing with the public debt has to do with the nation’s credit rating. When the pres-ident and Congress could not come to an agreement last summer regarding the debt level, Standard & Poor’s (S&P) lowered the nation’s credit rating—for the first time in his-tory—from AAA to AA+. Unfortunately, in April 2012, Egan-Jones downgraded U.S. credit even lower, placing it at AA due to the increasing debt burden and the lack of “tangible progress in addressing the country’s growing debt to GDP ratio.” (Egan-Jones is a lesser-known credit rating agency which originally lowered its credit rating for the U.S. a month before S&P issued its rating.)
Housing Market Continues to Struggle
Although we are seeing some signs of slight progress in the residential real estate market, the damage has been done to the morale of most homeowners. In fact, according to a recent Rasmussen study, less than half of homeowners in the U.S. now believe that their home is worth more than they paid for it. “This is a stunning turnaround for people who thought they were doing the right thing and buying their share of the American dream,” stated Scott Rasmus-sen, when describing how just four years ago, 80 percent of homeowners thought their home was worth more than they paid for it. He notes that such a low number would have been unthinkable until recently, and is one reason home owners feel “trapped.”
Another reason is the number of “For Sale” and “Reduced Pricing” signs we see in most neighborhoods, and the monthly data that, while improving slightly in some regions, is deteriorating in others. According to the S&P/Case-Shiller Index, which tracks new home prices in 20 cities, home pric-es dropped 3.5 percent in February 2012 from year-ago fig-ures. Although the index hit a new low, the monthly decline was an improvement from the declines in the previous two months. February home prices were higher than year-ago
prices in Phoenix, Miami, Minneapolis, Denver, and Detroit, but prices in nine of 20 cities showed new lows in February from their peak prices several years ago, including Las Ve-gas, Tampa, Atlanta, Chicago, and Seattle.
However, home sales in March 2012 were positive com-pared to prior-year data, but down compared to prior-month data. Existing home sales declined 2.6 percent to a season-ally-adjusted annual rate of 4.48 million in March 2012 from February 2012, but are 5.2 percent above the March 2011 estimate, according to the National Association of REAL-TORS®. This is the ninth consecutive month of increasing year-over-year sales, as the national median existing home sale price increased 2.5 percent to $163,800. Likewise, sales estimates of new single-family homes in March 2012 declined 7.1 percent from February 2012, but increased 7.5 percent above the March 2011 estimate, according to the Department of Commerce. In addition, March 2012 building permits, housing starts, and completions were higher than year-ago activity.
CCIM Members Speak Out
As a result of the continued uncertainty, CCIM members in-dicated no change either for better or for worse for the U.S. economy. The South regional economy was rated highest, at 5.7 on a scale of 1 to 10, with 10 being high, while the East regional economy was rated at 5.6. The West and Mid-west regional economies continued to receive the lowest ratings, at 5.4 and 5.3, respectively. The majority of respon-dents were more hopeful about commercial real estate than about the economy overall.

4Investment Trends Quarterly s Copyright© 2012 by Real Estate Research Corporation (RERC) and the CCIM Institute.
RERC/CCIM Investment Trends Quarterly Survey Results
With the stock market having just turned in its best first-quarter performance since 1998, it is no surprise that CCIM members increased their investment ratings for stocks to 5.2 in first quarter 2012. However, investor views regarding commercial real estate also improved, increasing to 6.3 on a scale of 1 to 10, with 10 being high, during first quarter, as shown in Exhibit 1, with commercial real estate retaining its first-place rating among the investment alternatives sur-veyed. In contrast, the investment rating for bonds remained unchanged at 4.3 while the rating for cash fell to 4.1.
As the bumpy recovery continues, RERC’s first quarter 2012 institutional investment survey respondents recom-mended holding commercial real estate, giving the asset class a rating of 6.7 on a scale of 1 to 10, with 10 being high, as shown in Exhibit 2, which is slightly higher than the previous quarter’s rating. On the other hand, the buy rating declined to 6.3, while the sell rating, at 5.8, remains the low-est of the recommendations.
CCIM members continued to give the apartment sector their highest investment conditions rating, which was unchanged at 7.5 on a scale of 1 to 10, with 10 being high, during first quarter 2012. As shown in Exhibit 3, the investment condi-tions for the hotel sector continued to show improvement, with the rating increasing to 5.8, thereby overtaking the rating for the industrial sector, which remained unchanged at 5.6. The investment conditions ratings for the retail and office sectors remained the lowest, at 5.3 and 4.9, respec-tively.
CCIM members’ overall return versus risk rating for com-mercial real estate increased to 5.9 on a scale of 1 to 10, with 10 being high, during first quarter 2012. A rating higher
than 5.0 indicates that investors believe that the return for commercial real estate generally outweighs the risk of this asset class.
As shown in Exhibit 4, the apartment sector earned the highest return versus risk rating in first quarter 2012, and at 7.0, was quite a bit higher than the rating for the asset class overall. While the return versus risk rating for the apartment sector declined slightly from the previous quarter, the rat-ings for each of the other property types increased. The industrial sector rating received the second highest rating of 5.7, followed closely by the rating for the hotel sector at 5.6. The retail and office sector return versus risk ratings improved to 5.3 and 5.1, respectively.
In general, property values appear to be increasing, and good deals are available. The overall value versus price rating remained unchanged at 5.7 on a scale of 1 to 10, with 10 being high, during first quarter 2012, indicating that the value of commercial real estate overall remained higher than the price (see Exhibit 4).
In addition, the value versus price rating for each of the in-dividual property types, except for the apartment and of-fice sector ratings, increased during first quarter 2012. The value versus price rating for the industrial sector rating in-creased to 5.7, making it the highest-rated property type with respect to value over price. The value versus price rat-ing for the retail sector increased to 5.5 while that for the office sector remained stable at 5.5, and the rating for the hotel sector increased to 5.4. In contrast, the value versus price rating for the apartment sector rating fell to 5.3, with this sector receiving the lowest rating during first quarter, in-dicating that the price of apartment properties may be com-ing more in line with the value.
Exhibit 1. CCIM Respondents Rate Investments
1Q 2012 4Q 2011 3Q 2011 2Q 2011
Commercial Real Estate 6.3 6.0 5.7 5.8
Stocks 5.2 4.7 4.0 4.8
Bonds 4.3 4.3 4.1 4.2
Cash 4.1 4.7 5.3 5.0
Ratings are based on a scale of 1 to 10, where 1 is poor and 10 is excellent.Source: RERC/CCIM Investment Trends Quarterly Survey, 1Q 2012.
C o m m e r c i a l R e a l E s t a t e H i g h l i g h t s
0
2
4
6
8
10
0
2
4
6
8
10
Hold
Sell
Buy
1Q 2012
1Q 2011
1Q 2010
1Q 2009
1Q 2008
1Q 2007
1Q 2006
1Q 2005
1Q 2004
1Q 2003
Exhibit 2. RERC Historical Buy, Sell, Hold Recommendations
Ratings are based on a scale of 1 to 10, where 1 is poor and 10 is excellent.Source: RERC Institutional Investment Survey, 1Q 2012.
Rat
ing

5Investment Trends Quarterly s Copyright© 2012 by Real Estate Research Corporation (RERC) and the CCIM Institute.
With the exception of apartment sector volume, which in-creased approximately 10 percent, the 12-month trailing volume increased about 5 percent for each property sector during first quarter 2012. The overall size-weighted aver-age price per square foot/unit for the industrial, apartment, and retail sectors increased slightly. In contrast, the overall prices for the office and hotel sectors declined slightly. The 12-month trailing weighted average capitalization rate for the hotel sector increased 10 basis points, while the capital-ization rate for the other property sectors decreased.
The current-quarter volume for the office, retail, and apart-ment sectors fell 25 percent during first quarter 2012, while the volume for the industrial sector declined 30 percent. In comparison, the hotel sector volume increased slightly on a quarterly basis. In contrast, the size-weighted average price per square foot/unit for the office, industrial, and apartment sectors increased approximately 5 percent. The average price for the retail sector remained unchanged, while the average price for the hotel sector increased approximately 20 percent. On a quarter-to-quarter basis, the weighted average capitalization rates for the office, retail, and apart-ment sectors declined, while the rate for the industrial sec-tor remained unchanged, and the rate for the hotel sector increased.
Although the stock market turned in its best first-quarter performance in 2012 in nearly 15 years (see Exhibit 5) in-vestors continue to value the stability, transparency, and performance that real estate investment offer, as shown by returns in the National Council for Real Estate Investment Fiduciaries (NCREIF) Property Index, the NCREIF Open-End Diversified Core (ODCE), and the National Association of Real Estate Investment Trusts (NAREIT).
Exhibit 4. Historical Return/Risk and Value/Price Ratings1Q 2012 4Q 2011 3Q 2011 2Q 2011 1Q 2011
Return vs. RiskOverall 5.9 5.6 5.1 5.3 5.6
Office 5.1 4.9 4.4 4.4 4.5
Industrial 5.7 5.6 5.1 5.1 5.5
Retail 5.3 5.1 4.4 4.7 4.8
Apartment 7.0 7.1 6.8 6.7 6.7
Hotel 5.6 5.2 4.7 4.8 4.8
Value vs. PriceOverall 5.7 5.7 5.4 5.4 5.5
Office 5.5 5.5 5.1 5.0 5.1
Industrial 5.7 5.6 5.5 5.4 5.7
Retail 5.5 5.3 5.0 5.0 5.3
Apartment 5.3 5.5 5.5 5.2 5.4
Hotel 5.4 5.2 5.1 4.9 5.3Ratings are based on a scale of 1 to 10, where 1 is poor and 10 is excellent.Source: RERC/CCIM Investment Trends Quarterly Survey, 1Q 2012.
Exhibit 3. Real Estate Investment Conditions Ratings1Q
20124Q
20113Q
20112Q
20111Q
2011Office 4.9 4.7 4.4 4.5 4.7
Industrial 5.6 5.6 5.0 5.1 5.5
Retail 5.3 5.1 4.5 4.8 4.9
Apartment 7.5 7.5 7.2 7.0 7.1
Hotel 5.8 5.5 5.0 5.0 5.0Ratings are based on a scale of 1 to 10, where 1 is poor and 10 is excellent.Source: RERC/CCIM Investment Trends Quarterly Survey, 1Q 2012.

6Investment Trends Quarterly s Copyright© 2012 by Real Estate Research Corporation (RERC) and the CCIM Institute.
Exhibit 5. What Do the Financial Markets Tell Us?
Compounded Annual Rates of Return as of 3/31/2012
Market Indices YTD4 1-Year 3-Year 5-Year 10-Year 15-Year
Consumer Price Index1 0.91% 2.51% 2.50% 2.24% 2.53% 2.43%
10-Year Treasury Bond2 2.04% 2.43% 2.99% 3.36% 3.87% 4.44%
Dow Jones Industrial Average 8.84% 10.18% 23.55% 4.18% 5.02% 7.10%
NASDAQ Composite3 18.67% 11.16% 26.46% 5.01% 5.30% 6.39%
NYSE Composite3 9.76% -2.36% 18.13% -2.39% 2.60% 4.54%
S&P 500 12.59% 8.54% 23.42% 2.01% 4.12% 6.10%
NCREIF Property Index 2.59% 13.41% 5.96% 2.89% 8.18% 9.43%
NCREIF ODCE 2.82% 14.66% 4.14% -0.43% 6.42% 8.36%
NAREIT Index (Equity REITS) 10.49% 11.29% 42.21% -0.12% 10.43% 9.59%
1Based on the published data from the Bureau of Labor Statistics (Seasonally Adjusted).2Based on Average End of Day T-Bond Rates.3Based on Price Index, and does not include the dividend yield.4Year-to-date (YTD) averages are not compounded annually.Sources: BLS, Federal Reserve Board, S&P, Dow Jones, NCREIF, NAREIT, compiled by RERC.
As uncertainty continues to dominate the economy and in-vestment environment, commercial real estate continues to provide very respectable returns on a risk-adjusted basis, especially compared to the alternatives. A summary of the first quarter 2012 highlights associated with commercial real estate performance is provided below:
• Although we saw positive economic growth of 2.2 per-cent in first quarter 2012, according to the Commerce Department, the momentum has slowed from 3.0 in the previous quarter. Consumer spending was relatively strong during the quarter, although business and govern-ment spending declined. Barring any major shocks or contagion from Europe, we expect economic growth to remain positive but sluggish in 2012.
• The Federal Reserve’s Operation Twist program will conclude in June 2012, but the FOMC noted that they stood ready to provide more support if needed. The Fed-eral Reserve reiterated its commitment to keeping inter-est rates low until late 2014, although there was some discussion among members that rates may need to be raised before then.
• The broadening debt crisis in Europe, political gridlock regarding how to address record-high debt levels in the U.S., the weak housing market, slow job growth, and high gasoline prices continue to put a drag on the U.S. economy.
• Job growth continued during first quarter 2012, but the pace of growth slowed in March as first time jobless claims began increasing. The unemployment rate fell to 8.2 percent; however, 12.7 million people remain unem-ployed.
• Although the stock market turned in its best first-quarter performance during 2012 in 15 years, investors continue to value the stability, transparency, and income that real estate investment can offer. As such, CCIM members selected commercial real estate as their top investment alternative for the quarter.
• The apartment sector again earned CCIM members’
top investment conditions rating in first quarter 2012, fol-lowed by the hotel sector, the industrial warehouse sec-tor, the retail sector, and the office sector.
• Twelve-month trailing volume increased about 10 per-cent for the apartment sector and about 5 percent for each of the other property sectors in first quarter 2012. The overall size-weighted average price for the industri-al, apartment, and retail sectors increased slightly, while the price for the office and hotel sectors declined slightly.
• The national vacancy rate declined slightly for each of the core property types in first quarter 2012.
S u m m a r y
7Investment Trends Quarterly s Copyright© 2012 by Real Estate Research Corporation (RERC) and the CCIM Institute.
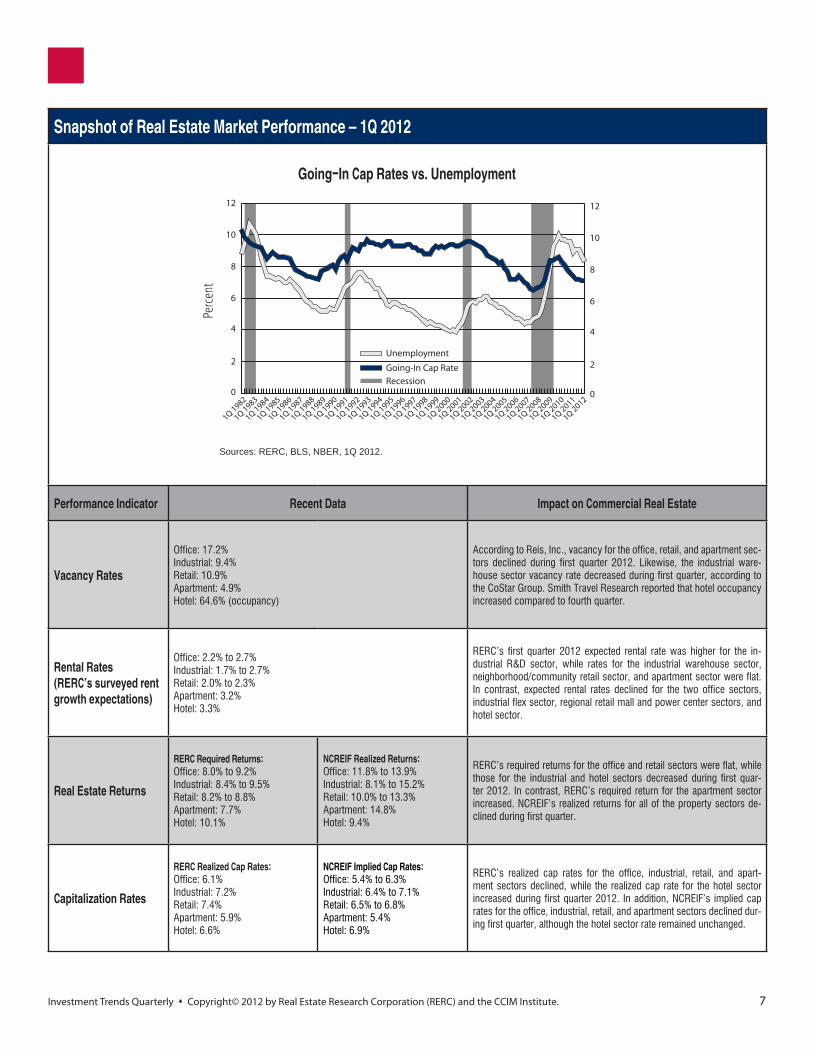
Snapshot of Real Estate Market Performance – 1Q 2012
Performance Indicator Recent Data Impact on Commercial Real Estate
Vacancy Rates
Office: 17.2%Industrial: 9.4%Retail: 10.9%Apartment: 4.9%Hotel: 64.6% (occupancy)
According to Reis, Inc., vacancy for the office, retail, and apartment sec-tors declined during first quarter 2012. Likewise, the industrial ware-house sector vacancy rate decreased during first quarter, according to the CoStar Group. Smith Travel Research reported that hotel occupancy increased compared to fourth quarter.
Rental Rates(RERC’s surveyed rent growth expectations)
Office: 2.2% to 2.7% Industrial: 1.7% to 2.7%Retail: 2.0% to 2.3%Apartment: 3.2%Hotel: 3.3%
RERC’s first quarter 2012 expected rental rate was higher for the in-dustrial R&D sector, while rates for the industrial warehouse sector, neighborhood/community retail sector, and apartment sector were flat. In contrast, expected rental rates declined for the two office sectors, industrial flex sector, regional retail mall and power center sectors, and hotel sector.
Real Estate Returns
RERC Required Returns:Office: 8.0% to 9.2%Industrial: 8.4% to 9.5%Retail: 8.2% to 8.8%Apartment: 7.7%Hotel: 10.1%
NCREIF Realized Returns:Office: 11.8% to 13.9%Industrial: 8.1% to 15.2%Retail: 10.0% to 13.3%Apartment: 14.8%Hotel: 9.4%
RERC’s required returns for the office and retail sectors were flat, while those for the industrial and hotel sectors decreased during first quar-ter 2012. In contrast, RERC’s required return for the apartment sector increased. NCREIF’s realized returns for all of the property sectors de-clined during first quarter.
Capitalization Rates
RERC Realized Cap Rates:Office: 6.1%Industrial: 7.2%Retail: 7.4%Apartment: 5.9%Hotel: 6.6%
NCREIF Implied Cap Rates:Office: 5.4% to 6.3%Industrial: 6.4% to 7.1%Retail: 6.5% to 6.8%Apartment: 5.4%Hotel: 6.9%
RERC’s realized cap rates for the office, industrial, retail, and apart-ment sectors declined, while the realized cap rate for the hotel sector increased during first quarter 2012. In addition, NCREIF’s implied cap rates for the office, industrial, retail, and apartment sectors declined dur-ing first quarter, although the hotel sector rate remained unchanged.
0
2
4
6
8
10
12
0
2
4
6
8
10
12
Unemployment
Going-In Cap Rate
1Q 2012
1Q 2011
1Q 2010
1Q 2009
1Q 2008
1Q 2007
1Q 2006
1Q 2005
1Q 2004
1Q 2003
1Q 2002
1Q 2001
1Q 2000
1Q 1999
1Q 1998
1Q 1997
1Q 1996
1Q 1995
1Q 1994
1Q 1993
1Q 1992
1Q 1991
1Q 1990
1Q 1989
1Q 1988
1Q 1987
1Q 1986
1Q 1985
1Q 1984
1Q 1983
1Q 1982
Recession
Perc
ent
Sources: RERC, BLS, NBER, 1Q 2012.
Going-In Cap Rates vs. Unemployment

8Investment Trends Quarterly s Copyright© 2012 by Real Estate Research Corporation (RERC) and the CCIM Institute.
National Transaction Breakdown12-Month Trailing Averages (04/01/11 - 03/31/12)
Office Industrial Retail Apartment Hotel< $2 MillionVolume (Mil) $2,158 $4,299 $4,454 $2,291 $219
Size Weighted Avg. ($ per sf/unit) $60 $33 $60 $35,142 $15,013
Price Weighted Avg. ($ per sf/unit) $101 $62 $110 $63,508 $25,195
Median ($ per sf/unit) $68 $45 $68 $41,893 $17,308
$2 - $5 MillionVolume (Mil) $3,220 $5,474 $6,433 $5,245 $1,097
Size Weighted Avg. ($ per sf/unit) $85 $45 $110 $50,683 $29,553
Price Weighted Avg. ($ per sf/unit) $164 $84 $219 $102,471 $43,455
Median ($ per sf/unit) $120 $65 $167 $84,688 $28,792
> $5 MillionVolume (Mil) $72,577 $19,176 $41,207 $49,603 $16,922
Size Weighted Avg. ($ per sf/unit) $231 $63 $148 $104,308 $152,775
Price Weighted Avg. ($ per sf/unit) $392 $106 $282 $203,673 $256,648
Median ($ per sf/unit) $170 $71 $142 $94,063 $107,100
All TransactionsVolume (Mil) $77,955 $28,949 $52,094 $57,138 $18,238
Size Weighted Avg. ($ per sf/unit) $201 $52 $127 $88,695 $112,245
Price Weighted Avg. ($ per sf/unit) $375 $95 $259 $188,764 $241,042
Median ($ per sf/unit) $100 $52 $96 $68,333 $56,863
Capitalization Rates (All Transactions)Range (%) 4.0 - 13.1 4.0 - 12.4 4.0 - 13.3 4.0 - 12.8 4.3 -12.3
Weighted Avg. (%) 6.1 7.2 7.4 5.9 6.6
Median (%) 7.4 7.6 7.8 6.2 7.5 Source: RERC.
N a t i o n a l M a r k e t A n a l y s i s

9Investment Trends Quarterly s Copyright© 2012 by Real Estate Research Corporation (RERC) and the CCIM Institute.
National Transaction BreakdownCurrent Quarter Rates (01/01/12 - 03/31/12)
Office Industrial Retail Apartment Hotel< $2 MillionVolume (Mil) $535 $1,094 $1,109 $557 $54
Size Weighted Avg. ($ per sf/unit) $57 $33 $62 $36,009 $14,578
Price Weighted Avg. ($ per sf/unit) $98 $61 $105 $63,058 $22,974
Median ($ per sf/unit) $68 $45 $68 $40,000 $14,435
$2 - $5 MillionVolume (Mil) $803 $1,233 $1,582 $1,346 $242
Size Weighted Avg. ($ per sf/unit) $85 $49 $116 $53,791 $35,402
Price Weighted Avg. ($ per sf/unit) $160 $89 $230 $105,915 $53,014
Median ($ per sf/unit) $111 $67 $177 $85,729 $39,474
> $5 MillionVolume (Mil) $13,448 $4,011 $7,476 $10,978 $3,083
Size Weighted Avg. ($ per sf/unit) $209 $69 $181 $106,438 $134,506
Price Weighted Avg. ($ per sf/unit) $336 $107 $340 $211,379 $210,672
Median ($ per sf/unit) $183 $73 $195 $98,559 $98,323
All TransactionsVolume (Mil) $14,787 $6,337 $10,166 $12,881 $3,380
Size Weighted Avg. ($ per sf/unit) $178 $54 $140 $89,682 $100,939
Price Weighted Avg. ($ per sf/unit) $318 $96 $298 $193,947 $196,356
Median ($ per sf/unit) $94 $53 $93 $70,569 $57,805
Capitalization Rates (All Transactions)Range (%) 4.0 - 11.6 5.5 - 10.5 4.0 - 12.7 4.0 - 12.8 5.1 -12.3
Weighted Avg. (%) 5.9 7.4 7.0 6.0 7.5
Median (%) 7.8 7.5 7.5 6.5 8.4 Source: RERC.
N a t i o n a l M a r k e t A n a l y s i s

10Investment Trends Quarterly s Copyright© 2012 by Real Estate Research Corporation (RERC) and the CCIM Institute.
w RERC/CCIM Investment Trends Quarterly first quarter 2012 survey respondents reminded investors that the key to good returns is to buy low and sell/lease high, and suggest-ed investors look for undervalued or distressed property. Although several respondents stated that office properties could be bought at an attractive price, they also noted that investing in them could be a “double-edged sword” because rents may never rise.
w While 12-month trailing total office property volume in-creased by approximately 5 percent, the size-weighted average price per square foot declined slightly during first quarter 2012. The weighted-average capitalization rate declined to 6.1 percent on a 12-month trailing basis.
w On a quarter-to-quarter basis, office sector total volume continued to trend downwards and dropped roughly 25 percent. In contrast, the average price for the office sec-tor rose approximately 5 percent on a quarterly basis – a welcome change after the drop during fourth quarter.
w Twelve-month trailing transactions of $5 million or more took up a growing share of total office property trans-actions during first quarter 2012, and prices remained steady. However, for office property transactions of less than $5 million, the average price was slightly lower than the previous quarter.
w Although it will be years before the office sector is able to absorb the space that was vacated during the past few years, the vacancy rate declined 10 basis points to 17.2 percent during first quarter 2012, according to Reis, Inc. Despite lower expected rental growth, asking and effec-tive rent growth improved slightly, with annual gains of 1.6 percent and 2.1 percent, respectively.
5%
6%
7%
8%
9%
5%
6%
7%
8%
9%
1Q124Q113Q112Q111Q11
NationalWest
Midwest
South
East
RERC Weighted Average Capitalization Rate(12-Month Trailing Average)
$0
$100
$200
$300
$400
$500
$600
$0
$100
$200
$300
$400
$500
$600
1Q124Q113Q112Q111Q11
NationalWest
MidwestSouth
East
RERC Price-Weighted Average PPSF(12-Month Trailing Average)
$100
$150
$200
$250
$300
$350
$100
$150
$200
$250
$300
$350
1Q124Q113Q112Q111Q11
NationalWest
Midwest
South
East
RERC Size-Weighted Average PPSF(12-Month Trailing Average)
N a t i o n a l O f f i c e P r o p e r t y S e c t o r

11Investment Trends Quarterly s Copyright© 2012 by Real Estate Research Corporation (RERC) and the CCIM Institute.
w RERC/CCIM Investment Trends Quarterly survey respon-dents stated that industrial properties were attractively priced, with clean and leased properties selling at a pre-mium. Respondents also noted that industrial flex prop-erties and older industrial properties could be bought at attractive prices. However, weak fundamentals remain a concern as the economy struggles to gain certainty.
w On a 12-month trailing basis, total volume for the industrial sector increased nearly 5 percent during first quarter 2012. Likewise, the size-weighted average price per square foot of industrial space rose slightly.
w In contrast, after trending upwards for the past year, cur-rent quarter total volume for the industrial sector dropped 30 percent during first quarter 2012. However, the quarter-ly size-weighted average price per square foot increased approximately 5 percent.
w The 12-month trailing weighted-average capitalization rate declined to 7.2 percent, while the current quarter capital-ization rate remained unchanged during first quarter 2012.
w According to the CoStar Group, the national industrial ware-house vacancy rate declined to 9.4 percent during first quar-ter 2012. In addition, there was positive net absorption of 20.9 million square feet.
7.0%
7.5%
8.0%
8.5%
7.0%
7.5%
8.0%
8.5%
1Q124Q113Q112Q111Q11
NationalWest
Midwest
South
East
RERC Weighted Average Capitalization Rate(12-Month Trailing Average)
$25
$50
$75
$100
$125
$150
$25
$50
$75
$100
$125
$150
1Q124Q113Q112Q111Q11
NationalWest
Midwest
South
East
RERC Price-Weighted Average PPSF(12-Month Trailing Average)
$0
$25
$50
$75
$100
$0
$25
$50
$75
$100
1Q124Q113Q112Q111Q11
NationalWest
Midwest
South
East
RERC Size-Weighted Average PPSF(12-Month Trailing Average)
N a t i o n a l I n d u s t r i a l P r o p e r t y S e c t o r

12Investment Trends Quarterly s Copyright© 2012 by Real Estate Research Corporation (RERC) and the CCIM Institute.
7%
8%
9%
7%
8%
9%
1Q124Q113Q112Q111Q11
NationalWest
Midwest
South
East
RERC Weighted Average Capitalization Rate(12-Month Trailing Average)
$100
$150
$200
$250
$300
$350
$400
$450
$100
$150
$200
$250
$300
$350
$400
$450
1Q124Q113Q112Q111Q11
NationalWest
Midwest
South
East
$100
RERC Price-Weighted Average PPSF(12-Month Trailing Average)
w According to first quarter 2012 survey respondents for the RERC/CCIM Investment Trends Quarterly, the retail sec-tor is the most “optimistic” and “ambitious” property type. However, respondents cautioned that retail property per-formance is also affected by consumer spending which could weaken, new regulations for national retail compa-nies, and tougher regulations for small businesses.
w The 12-month trailing total volume and size-weighted average price for the retail sector maintained its upward trend by increasing approximately 5 percent during first quarter 2012.
w While total volume for the retail sector fell nearly 25 per-cent on a quarter-to-quarter basis, the average price showed no significant change during first quarter 2012.
w The 12-month trailing weighted-average capitalization rate declined to 7.4 percent, while the current quarter capital-ization rate declined to 7.0 percent during first quarter 2012.
w There were cautious signs of optimism in the retail sector space market during first quarter 2012. According to Reis, Inc., the retail sector vacancy rate fell 10 basis points to 10.9 percent – the first decline since second quarter 2005 – and net absorption recorded the second-largest positive value of 3.14 million. Asking and effective rents increased by 0.1 percent.
$50
$75
$100
$125
$150
$175
$50
$75
$100
$125
$150
$175
1Q124Q113Q112Q111Q11
NationalWest
Midwest
South
East
RERC Size-Weighted Average PPSF(12-Month Trailing Average)
N a t i o n a l R e t a i l P r o p e r t y S e c t o r
13Investment Trends Quarterly s Copyright© 2012 by Real Estate Research Corporation (RERC) and the CCIM Institute.
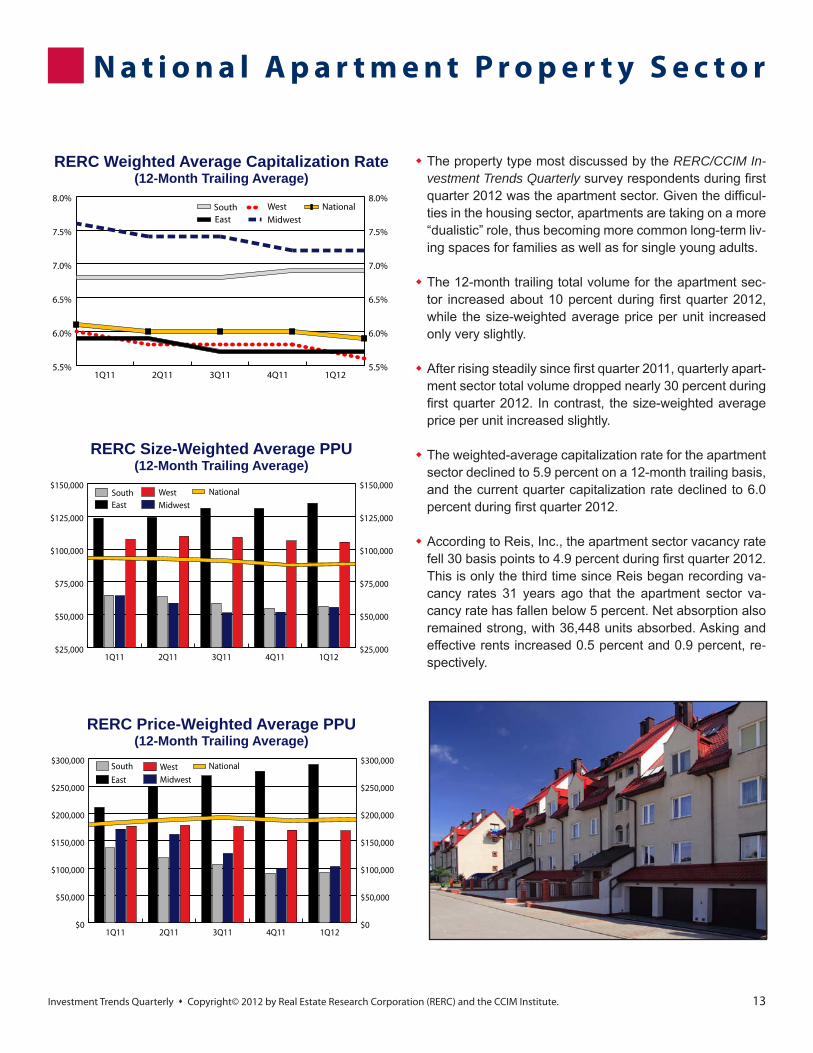
w The property type most discussed by the RERC/CCIM In-vestment Trends Quarterly survey respondents during first quarter 2012 was the apartment sector. Given the difficul-ties in the housing sector, apartments are taking on a more “dualistic” role, thus becoming more common long-term liv-ing spaces for families as well as for single young adults.
w The 12-month trailing total volume for the apartment sec-tor increased about 10 percent during first quarter 2012, while the size-weighted average price per unit increased only very slightly.
w After rising steadily since first quarter 2011, quarterly apart-ment sector total volume dropped nearly 30 percent during first quarter 2012. In contrast, the size-weighted average price per unit increased slightly.
w The weighted-average capitalization rate for the apartment sector declined to 5.9 percent on a 12-month trailing basis, and the current quarter capitalization rate declined to 6.0 percent during first quarter 2012.
w According to Reis, Inc., the apartment sector vacancy rate fell 30 basis points to 4.9 percent during first quarter 2012. This is only the third time since Reis began recording va-cancy rates 31 years ago that the apartment sector va-cancy rate has fallen below 5 percent. Net absorption also remained strong, with 36,448 units absorbed. Asking and effective rents increased 0.5 percent and 0.9 percent, re-spectively.
5.5%
6.0%
6.5%
7.0%
7.5%
8.0%
5.5%
6.0%
6.5%
7.0%
7.5%
8.0%
1Q124Q113Q112Q111Q11
NationalWest
MidwestSouthEast
RERC Weighted Average Capitalization Rate(12-Month Trailing Average)
$0
$50,000
$100,000
$150,000
$200,000
$250,000
$300,000
$0
$50,000
$100,000
$150,000
$200,000
$250,000
$300,000
1Q124Q113Q112Q111Q11
NationalWest
Midwest
South
East
RERC Price-Weighted Average PPU(12-Month Trailing Average)
$25,000
$50,000
$75,000
$100,000
$125,000
$150,000
$25,000
$50,000
$75,000
$100,000
$125,000
$150,000
1Q124Q113Q112Q111Q11
NationalWest
MidwestSouthEast
RERC Size-Weighted Average PPU(12-Month Trailing Average)
N a t i o n a l A p a r t m e n t P r o p e r t y S e c t o r

14Investment Trends Quarterly s Copyright© 2012 by Real Estate Research Corporation (RERC) and the CCIM Institute.
w According to RERC/CCIM Investment Trends Quarterly sur-vey respondents, the hotel sector continued to struggle dur-ing first quarter 2012, and only a few respondents stated that hotel property prices were attractive for either buyers or sellers. Furthermore, in addition to lack of investor interest in the hotel sector, revenue growth is expected to be slow due to the lack of job growth.
w During first quarter 2012, the 12-month trailing total vol-ume for the hotel sector rose approximately 5 percent. In contrast, the size-weighted average price per unit declined slightly.
w On a quarterly basis, the hotel sector total volume increased slightly during first quarter 2012, while the size-weighted av-erage price per unit jumped nearly 20 percent.
w On a 12-month trailing basis, the weighted-average capital-ization rate increased to 6.6 percent, although the current quarter capitalization rate increased to 7.5 percent during first quarter 2012.
w Compared to a year ago, hotel sector occupancy rose 6.6 percent to 64.6 percent during first quarter 2012 according to Smith Travel Research. Likewise, the average daily rate (ADR) increased 5.8 percent to $105.94, and revenue per available room (RevPAR) increased 12.8 percent to $68.42.
6.0%
6.5%
7.0%
7.5%
6.0%
6.5%
7.0%
7.5%
1Q124Q113Q112Q111Q11
National
East
RERC Weighted Average Capitalization Rate(12-Month Trailing Average)
$0
$50,000
$100,000
$150,000
$200,000
$250,000
$300,000
$350,000
$400,000
$0
$50,000
$100,000
$150,000
$200,000
$250,000
$300,000
$350,000
$400,000
1Q124Q113Q112Q111Q11
NationalWest
Midwest
South
East
RERC Price-Weighted Average PPU(12-Month Trailing Average)
$25,000
$50,000
$75,000
$100,000
$125,000
$150,000
$175,000
$25,000
$50,000
$75,000
$100,000
$125,000
$150,000
$175,000
1Q124Q113Q112Q111Q11
NationalWestMidwest
South
East
RERC Size-Weighted Average PPU(12-Month Trailing Average)
N a t i o n a l H o t e l P r o p e r t y S e c t o r

15Investment Trends Quarterly s Copyright© 2012 by Real Estate Research Corporation (RERC) and the CCIM Institute.
East Transaction Breakdown12-Month Trailing Averages (04/01/11 - 03/31/12)
Office Industrial Retail Apartment Hotel< $2 MillionVolume (Mil) $470 $953 $991 $377 $39
Size Weighted Avg. ($ per sf/unit) $56 $28 $64 $39,010 $13,766
Price Weighted Avg. ($ per sf/unit) $100 $59 $112 $64,032 $23,211
Median ($ per sf/unit) $68 $41 $72 $47,368 $14,924
$2 - $5 MillionVolume (Mil) $770 $1,277 $1,342 $1,489 $284
Size Weighted Avg. ($ per sf/unit) $84 $39 $126 $74,594 $26,681
Price Weighted Avg. ($ per sf/unit) $191 $83 $246 $121,502 $39,442
Median ($ per sf/unit) $133 $60 $200 $92,000 $21,882
> $5 MillionVolume (Mil) $39,390 $4,999 $16,605 $18,347 $7,531
Size Weighted Avg. ($ per sf/unit) $342 $59 $176 $152,609 $201,056
Price Weighted Avg. ($ per sf/unit) $520 $110 $372 $307,715 $323,358
Median ($ per sf/unit) $216 $66 $167 $125,362 $119,650
All TransactionsVolume (Mil) $40,630 $7,229 $18,937 $20,212 $7,854
Size Weighted Avg. ($ per sf/unit) $306 $48 $157 $134,897 $154,259
Price Weighted Avg. ($ per sf/unit) $509 $99 $349 $289,458 $311,614
Median ($ per sf/unit) $117 $48 $104 $88,333 $73,353
Capitalization Rates (All Transactions)Range (%) 4.0 - 12.0 4.0 - 11.1 4.5 - 11.7 4.0 - 12.2 4.5 - 8.9
Weighted Avg. (%) 5.5 7.2 7.3 5.7 6.5
Median (%) 7.1 7.6 7.8 6.5 7.6 Source: RERC.
E a s t R e g i o nTr a n s a c t i o n B r e a k d o w n

16Investment Trends Quarterly s Copyright© 2012 by Real Estate Research Corporation (RERC) and the CCIM Institute.
South Transaction Breakdown12-Month Trailing Averages (04/01/11 - 03/31/12)
Office Industrial Retail Apartment Hotel< $2 MillionVolume (Mil) $656 $1,037 $1,523 $478 $78
Size Weighted Avg. ($ per sf/unit) $64 $29 $54 $23,574 $15,436
Price Weighted Avg. ($ per sf/unit) $96 $50 $103 $41,577 $28,255
Median ($ per sf/unit) $67 $40 $63 $28,977 $18,902
$2 - $5 MillionVolume (Mil) $710 $910 $2,010 $988 $276
Size Weighted Avg. ($ per sf/unit) $87 $42 $103 $25,827 $28,402
Price Weighted Avg. ($ per sf/unit) $156 $73 $200 $42,677 $41,247
Median ($ per sf/unit) $112 $51 $148 $29,804 $25,623
> $5 MillionVolume (Mil) $10,640 $3,026 $9,594 $11,925 $3,713
Size Weighted Avg. ($ per sf/unit) $149 $47 $123 $66,797 $133,006
Price Weighted Avg. ($ per sf/unit) $203 $74 $182 $98,255 $210,632
Median ($ per sf/unit) $135 $53 $112 $62,981 $101,082
All TransactionsVolume (Mil) $12,005 $4,973 $13,128 $13,390 $4,067
Size Weighted Avg. ($ per sf/unit) $134 $40 $105 $56,492 $95,288
Price Weighted Avg. ($ per sf/unit) $194 $69 $176 $92,133 $195,649
Median ($ per sf/unit) $87 $44 $86 $39,063 $55,227
Capitalization Rates (All Transactions)Range (%) 4.0 - 11.0 5.9 - 10.5 5.0 - 11.7 4.0 - 12.2 5.5 - 12.2
Weighted Avg. (%) 7.0 7.5 7.5 6.9 7.7
Median (%) 8.0 7.6 7.8 7.5 8.5 Source: RERC.
S o u t h R e g i o nTr a n s a c t i o n B r e a k d o w n

17Investment Trends Quarterly s Copyright© 2012 by Real Estate Research Corporation (RERC) and the CCIM Institute.
Midwest Transaction Breakdown12-Month Trailing Averages (04/01/11 - 03/31/12)
Office Industrial Retail Apartment Hotel< $2 MillionVolume (Mil) $340 $743 $776 $297 $47
Size Weighted Avg. ($ per sf/unit) $41 $24 $47 $21,461 $11,505
Price Weighted Avg. ($ per sf/unit) $71 $38 $93 $35,934 $16,625
Median ($ per sf/unit) $53 $31 $53 $27,778 $12,923
$2 - $5 MillionVolume (Mil) $359 $739 $952 $512 $196
Size Weighted Avg. ($ per sf/unit) $51 $25 $86 $31,906 $24,303
Price Weighted Avg. ($ per sf/unit) $91 $48 $190 $54,810 $29,761
Median ($ per sf/unit) $77 $33 $123 $44,109 $21,882
> $5 MillionVolume (Mil) $5,969 $2,683 $5,902 $3,229 $817
Size Weighted Avg. ($ per sf/unit) $136 $46 $107 $76,036 $74,834
Price Weighted Avg. ($ per sf/unit) $197 $62 $182 $116,873 $99,415
Median ($ per sf/unit) $120 $49 $107 $67,362 $74,112
All TransactionsVolume (Mil) $6,667 $4,165 $7,630 $4,039 $1,059
Size Weighted Avg. ($ per sf/unit) $112 $35 $92 $55,804 $45,966
Price Weighted Avg. ($ per sf/unit) $185 $55 $174 $103,045 $82,882
Median ($ per sf/unit) $64 $33 $71 $36,585 $25,862
Capitalization Rates (All Transactions)Range (%) 5.9 - 10.9 5.9 - 12.4 5.0 - 12.7 4.8 - 10.8 6.1 - 9.6
Weighted Avg. (%) 6.7 7.4 8.1 7.2 7.5
Median (%) 8.0 8.0 8.5 7.4 7.9 Source: RERC.
M i d w e s t R e g i o nTr a n s a c t i o n B r e a k d o w n

18Investment Trends Quarterly s Copyright© 2012 by Real Estate Research Corporation (RERC) and the CCIM Institute.
West Transaction Breakdown12-Month Trailing Averages (04/01/11 - 03/31/12)
Office Industrial Retail Apartment Hotel< $2 MillionVolume (Mil) $692 $1,566 $1,163 $1,139 $55
Size Weighted Avg. ($ per sf/unit) $75 $54 $82 $53,190 $20,943
Price Weighted Avg. ($ per sf/unit) $120 $83 $128 $79,726 $29,538
Median ($ per sf/unit) $88 $66 $89 $62,500 $22,038
$2 - $5 MillionVolume (Mil) $1,382 $2,548 $2,129 $2,256 $342
Size Weighted Avg. ($ per sf/unit) $103 $67 $121 $77,193 $39,180
Price Weighted Avg. ($ per sf/unit) $172 $98 $233 $126,913 $56,409
Median ($ per sf/unit) $136 $86 $185 $116,667 $44,847
> $5 MillionVolume (Mil) $16,578 $8,467 $9,107 $16,102 $4,861
Size Weighted Avg. ($ per sf/unit) $197 $86 $179 $119,871 $141,001
Price Weighted Avg. ($ per sf/unit) $281 $129 $288 $180,604 $214,860
Median ($ per sf/unit) $181 $88 $192 $121,905 $102,941
All TransactionsVolume (Mil) $18,653 $12,582 $12,399 $19,497 $5,258
Size Weighted Avg. ($ per sf/unit) $175 $76 $150 $105,407 $114,694
Price Weighted Avg. ($ per sf/unit) $267 $117 $263 $168,497 $202,607
Median ($ per sf/unit) $122 $75 $124 $90,297 $67,485
Capitalization Rates (All Transactions)Range (%) 4.0 - 13.1 4.0 - 11.0 4.0 - 13.3 4.0 - 12.8 4.3 - 12.3
Weighted Avg. (%) 6.7 7.1 7.1 5.6 6.3
Median (%) 7.0 7.3 7.4 5.8 6.6 Source: RERC.
W e s t R e g i o nTr a n s a c t i o n B r e a k d o w n

19Investment Trends Quarterly s Copyright© 2012 by Real Estate Research Corporation (RERC) and the CCIM Institute.
-7
-5
-3
-1
1
3
5
7
9
-7
-5
-3
-1
1
3
5
7
9
1Q 2012
3Q 2011
1Q 2011
3Q 2010
1Q 2010
3Q 2009
1Q 2009
3Q 2008
1Q 2008
3Q 2007
1Q 2007
3Q 2006
1Q 2006
3Q 2005
1Q 2005
3Q 2004
1Q 2004
Perc
ent C
hang
e Q
uart
er A
go
According to the Bureau of Economic Analysis, real gross domestic product (GDP) grew 2.2 percent on an annualized basis during first quarter 2012. This was a decline from the previous quarter, and was largely a result of decreased investment. Despite relatively strong consumer spending in first quarter, business and government spending were down.
-0.3
-0.2
-0.1
-0.0
0.1
0.2
0.3
0.4
0.5
0.6
-0.3
-0.2
-0.1
-0.0
0.1
0.2
0.3
0.4
0.5
0.6
Mar-12
Feb-12
Jan-1
2
Dec-11
Nov-11
Oct-11
Sep-11
Aug-11
Jul-1
1
Jun-1
1
May-11
Apr-11
Mar-11
Perc
ent C
hang
e M
onth
Ago
The Consumer Price Index (CPI) increased slightly through first quarter 2012, reaching 229.1 in March 2012, while core CPI increased 0.23 percent. Despite rising prices for food and gas, inflation has remained within the acceptable range determined by the Federal Reserve.
Source: Bureau of Labor Statistics.
Perc
ent
4
6
8
10
12
4
6
8
10
12
Mar-12
Nov-11
Jul-1
1
Mar-11
Nov-10
July-1
0
Mar-10
Nov-09
Jul-0
9
Mar-09
Nov-08
Jul-0
8
Mar-08
Nov-07
Jul-0
7
Mar-07
Nov-06
The unemployment rate declined to 8.2 percent in March 2012. Although the Labor Depart-ment’s Household Survey showed fewer people were employed or entered the labor force, there were also fewer people who lost jobs. Compared to the previous month, approximately 120,000 new jobs were added.
Source: Bureau of Labor Statistics.
Source: Bureau of Economic Analysis.
Perc
ent
0
1
2
3
4
5
6
7
0
1
2
3
4
5
6
7
Discount Rate
Fed Funds Rate
Mar-12
Aug-11
Jan-11
Sep-10
Mar-10
Oct-09
Jun-09
Dec-08
Apr-08
Oct-07
May-07
Oct-06
May-06
Nov-05
Apr-05
Nov-04
May-04
Oct-03
May-03
Nov-02
May-02
As of April 2012, the Federal Open Market Committee (FOMC) kept the federal funds rate in the 0.0-percent to 0.25-percent range, and the discount rate at 0.75 percent. The FOMC reiterated its intent to keep rates low until late 2014 and its willingness to provide additional stimulus if growth falters.
-12
-10
-8
-6
-4
-2
0
2
4
6
8
10
-12
-10
-8
-6
-4
-2
0
2
4
6
8
10
Mar-12
Jan-1
2
Nov-11
Sep-11
Jul-1
1
May-11
Mar-11
Jan-1
1
Nov-10
Sep-10
Jul-1
0
May-10
Mar-10
Jan-1
0
Nov-09
Sep-09
Jul-0
9
May-09
Mar-09
Jan-0
9
Year
To Y
ear P
erce
nt C
hang
e
Retail sales increased 0.8 percent in March 2012 from February, as consumers continued to spend. Compared to the previous year, retail sales were 6.5 percent higher in March 2012. Despite improving consumer fundamentals, there remain concerns about rising gas prices, along with declining house prices and low confidence levels.
Source: Census Bureau.
-6
-4
-2
0
2
4
6
8
-6
-4
-2
0
2
4
6
8
Mar-12
Jan-1
2
Nov-11
Sep-11
Jul-1
1
May-11
Mar-11
Jan-1
1
Nov-10
Sep-10
Jul-1
0
May-10
Perc
ent C
hang
e M
onth
Ago
New orders for durable goods fell 4.2 percent in March 2012. However, excluding nondefense aircraft orders, which dropped 47.6 percent, orders declined a milder 1.1 percent. This report is not surprising given weak ISM manufacturing survey readings in March.
Source: Census Bureau.
Source: Federal Reserve.
Unemployment
GDP
Consumer Price Index
Durable Goods - New Orders
FOMC Policy Decisions
Retail Sales

20Investment Trends Quarterly s Copyright© 2012 by Real Estate Research Corporation (RERC) and the CCIM Institute.
Mill
ions
3.0
4.0
5.0
6.0
7.0
8.0
3.0
4.0
5.0
6.0
7.0
8.0
Mar-12
Nov-11
Jul-1
1
Mar-11
Nov-10
Jul-1
0
Mar-10
Nov-09
Jul-0
9
Mar-09
Nov-08
Jul-0
8
Mar-08
Nov-07
Jul-0
7
Mar-07
Nov-06
Jul-0
6
Mar-06
Nov-05
Jul-0
5
Existing home sales continued to struggle and decreased to an annualized rate of 4.48 million units in March 2012. However, home sales have been slowly trending upward since mid-2011, with sales up more than 5 percent over the past year. Home sales are expected to improve in 2012 due to low interest rates and low house prices.
Source: NAR.
60
70
80
90
100
110
120
60
70
80
90
100
110
120
Mar-12
Jan-1
2
Nov-11
Sep-11
Jul-1
1
May-11
Mar-11
Jan-1
1
Nov-10
Sep-10
Jul-1
0
May-10
Inde
x
At 101.4, the Pending Home Sales Index is up 12.8 percent from a year ago and increased 4.1 percent in March 2012. Helped by low mortgage rates, a slightly improving labor market, and generally improving consumer confidence, this is the fourth consecutive monthly gain.
Source: NAR.
250
300
350
400
450
250
300
350
400
450
Mar-12
Jan-1
2
Nov-11
Sep-11
Jul-1
1
May-11
Mar-11
Jan-1
1
Nov-10
Sep-10
Jul-1
0
May-10
Thou
sand
s
Sales of new homes decreased 7.1 percent in March 2012 to 328,000 units, following upward revisions to February and January sales.
Source: NAR.
20
40
60
80
100
120
20
40
60
80
100
120
Apr-12
Oct-11
May-11
Dec-10
Jul-1
0
Feb-10
Sep-09
Apr-09
Nov-08
Jun-0
8
Jan-0
8
Aug-07
Mar-07
Oct-06
May-06
Dec-05
Jul-0
5
Feb-05
Sep-04
Apr-04
Nov-03
Jun-0
3
Inde
x
Consumer confidence declined slightly to 69.2 points in April 2012, with the first quarter aver-age nearly 30 points higher than the 40.9 trough in October. Confidence is expected to steadily improve in 2012 if the labor market improves.
-0.8
-0.6
-0.4
-0.2
0.0
0.2
0.4
0.6
0.8
1.0
1.2
-0.8
-0.6
-0.4
-0.2
0.0
0.2
0.4
0.6
0.8
1.0
1.2
Mar-12
Feb-12
Jan-1
2
Dec-11
Nov-11
Oct-11
Sep-11
Aug-11
Jul-1
1
Jun-1
1
May-11
Apr-11
Perc
ent C
hang
e Q
uart
er A
go
The Conference Board’s Index of Leading Indicators rose 0.3 percent to 95.7 in March 2012. This is the sixth consecutive monthly gain. The interest rate spread and rising building permits were the biggest contributors to the month’s gain.
Source: The Conference Board.
600
700
800
900
1000
1100
1200
1300
1400
1500
1600
600
700
800
900
1000
1100
1200
1300
1400
1500
1600
Mar-12
Nov-11
Jul-1
1
Mar-11
Nov-10
Aug-10
Apr-10
Dec-09
Aug-09
Apr-09
Dec-08
Aug-08
Apr-08
Dec-07
Aug-07
Apr-07
Dec-06
Aug-06Be
ginn
ing
of M
onth
Adj
uste
d Cl
osin
g Pr
ice
The S&P 500 increased significantly during first quarter 2012, ending March 2012 with a read-ing of 1,408.47. In general, S&P 500 companies showed healthy profits during first quarter.
Source: S&P.
Source: The Conference Board.
Consumer Confidence Pending Home Sales Index
S&P 500 Existing Home Sales
Index of Leading Indicators New Home Sales

21Investment Trends Quarterly s Copyright© 2012 by Real Estate Research Corporation (RERC) and the CCIM Institute.
The analysis provided in the RERC/CCIM Investment Trends Quarterly is conducted by Real Estate Research Corporation (RERC). The information is gathered in raw form from surveys sent to CCIM designees and candidates, and from sales transactions collected from various sources, including CCIM members, various key commercial information exchange organizations (CIEs), the media, assessors’ offices, RERC contacts in the marketplace, and other reliable public and private resources. All sales transactions are aggregated, analyzed, and reported on by RERC.
Published quarterly, the RERC/CCIM Investment Trends Quarterly report provides timely insight into transaction volume, pricing, and capitalization rates for the core income-producing properties.
RERC Definitions
Capitalization Rate: The capitalization rate is defined as the first year “stabilized” net operating income (NOI) (NOI is before capital expenditures – tenant improvements, leasing commissions, reserves – and debt service) divided by the present value (or purchase price). Capitalization rates included are transaction-based medians and price-weighted averages.
RERC Capitalization Rate and Ranges: Capitalization rates and ranges listed throughout this report are based on RERC’s proprietary realized capitalization rate model, which includes available transaction-based capitalization rates, NCREIF Index Returns, and other market factors, but is heavily weighted toward transaction-based capitalization rates for each property type within each market.
Price-Weighted Average: The price-weighted average is developed through weighting each asset based on the gross sales price. Therefore, larger dollar properties are given more weight than the smaller dollar properties, with the weighted average reflecting more weight towards institutional real estate.
Size-Weighted Average: The size-weighted average is developed through weighting each asset based on its gross square footage – simply an aggregation of all the gross sales prices divided by the aggregation of the gross square footage.
National/Regional Market Analysis: RERC ranks the investment potential of the metros and property types it covers based on various space market and financial market criteria, including pricing, capitalization rates, vacancy rates, and other factors.
Investment Conditions Rating: A rating of 1 through 10 (with 10 being high) reflecting survey respondents’ collective views of the investment environment for a particular property type in comparison with other property types. The rating may take into account supply and demand, economic conditions, pricing, rental rates, or other factors.
NCREIF Definitions
NCREIF: The National Council of Real Estate Investment Fiduciaries (NCREIF) is an independent organization dedicated to the compilation, validation, and distribution of performance data for the institutional real estate investment community.
Total Return: The total return includes appreciation (or depreciation), realized capital gain (or loss), and income. It is computed by adding the income and capital appreciation return on a quarterly basis.
Implied Cap Rate (Income Return): The implied capitalization rate measures the portion of return attributable to each property’s NOI. It is computed by dividing the total NOI by the total quarterly investment.
Capital Appreciation Return: The capital appreciation return measures the change in market value adjusted for any capital improvements/expenditures and partial sales divided by the average quarterly investment.
Annual and Annualized Returns: Annual returns are computed by chain-linking quarterly rates of return to produce time-weighted rates of return for the annual and annualized periods under study. For time periods beyond 1 year, the annualized returns are expressed as the annual compounded rate of return.
Allocation: The distribution, expressed as a percentage of the overall investment, in a particular geographic area by property type.
For a detailed description of the proceeding returns, as well as the calculations used by NCREIF to derive these figures, please visit http://www.ncreif.org/indices.
The combined returns are the weighted average of the returns for each property type according to the proportionate market value of properties surveyed relative to the total market values surveyed during a time period.
RERC Defined Regions and MSAs
West: Alaska, Arizona, California, Colorado, Hawaii, Idaho, Montana, Nevada, New Mexico, Oregon, Utah, Washington, Wyoming
Midwest: Illinois, Indiana, Iowa, Kansas, Michigan, Minnesota, Missouri, Nebraska, North Dakota, Ohio, South Dakota, Wisconsin
South: Alabama, Arkansas, Florida, Georgia, Louisiana, Mississippi, Oklahoma, Tennessee, Texas
East: Connecticut, Delaware, Kentucky, Maine, Maryland, Massachusetts, New Hampshire, New Jersey, New York, North Carolina, Pennsylvania, Rhode Island, South Carolina, Vermont, Virginia, Washington D.C., West Virginia
Metropolitan Statistical Area (MSA): A geographic unit comprised of one or more counties around a central city or urbanized area with 50,000 or more population. Contiguous counties are included if they have close social and economic links with the area’s population nucleus.
With a few exceptions, the MSAs within this report coincide with the U.S. Office of Management and Budget’s December 2005 definitions for each MSA. For example, St. Paul, Minn., and Bloom-ington, Minn., as well as many other suburbs, are included within the Minneapolis MSA.
Note of Caution: It is imperative to exercise caution when comparing the data contained herein to previous reports published by RERC. The data herein is not “fixed,” and will be updated and changed as additional transaction information is gathered and analyzed.
Disclaimer: This publication is designed to provide accurate information in regard to the subject matter covered. It is sold with the understanding that the publisher is not engaged in rendering legal or accounting service. The publisher advises that no statement in this issue is to be construed as a recommendation to make any real estate investment or to buy or sell a security or as investment advice. The examples contained in the publication are intended for use as background on the real estate industry as a whole, not as support for any particular real estate investment or security. Although the RERC/CCIM Investment Trends Quarterly uses only sources that it deems reliable and accurate, Real Estate Research Corporation (RERC) does not warrant the accuracy of the information contained herein.
S c o p e & M e t h o d o l o g y

22Investment Trends Quarterly s Copyright© 2012 by Real Estate Research Corporation (RERC) and the CCIM Institute.
RERCsCCIM Investment Trends Quarterly RERC Editorial Staff
PublisherKenneth P. Riggs, Jr.CFA, CRE, FRICS, MAI, CCIM
Editor-in-ChiefBarb Bush
Lead AnalystBrian Velky, CFA
Research AnalystsJared Cuddeback, MAI Greg PhilippKyle Corcoran Cliff CarlsonCharles Gohr Donald Guarino, IIIAdam Klassen Lindsey KuhlmannJill Patterson Aaron RiggsMeredith Steffen Ye ThwayMorgan Westpfahl
Research AssistantKyle Volner
Layout & DesignJeff Carr
Data ManagementBen Neil Jake HartwellAlan Iroff Michael PotratzDaniel Warner
Production CommitteeTerri CotterNicole Hardy
CCIM Institute
PresidentLeil Koch, CCIM
President-ElectWayne D’Amico, CCIM
First Vice PresidentKarl Landreneau, CCIM
TreasurerCraig Blorstad, CCIM
Executive Vice President/CEOHenry F. White, Jr.Copyright Notice for RERC~CCIM Investment Trends Quarterly
Copyright© 2012 by Real Estate Research Corporation (RERC) and the CCIM Institute. All rights reserved. No part of this publication may be reproduced, duplicated, or copied in any form, including electronic forwarding or copying, xerography, microfilm, or other methods, or incorporated into any information retrieval system, without the written permission of RERC and the CCIM Institute.
Real Estate Research CorporationFounded more than 80 years ago, Real Estate Research Corporation (RERC) was the nation’s first independent real estate firm that specialized in both real estate research and analysis. Recognized as a pioneer in the art of real estate management and for monitoring key sectors of the econ-omy that influence the real estate industry, RERC has retained its place as one of the industry’s leading real estate investment trends analysts through the publication of such reports as Expectations & Market Realities in Real Estate and the RERC Real Estate Report. Today, RERC is known for its research publications and market studies, commercial property valuations, complex consulting assignments, portfolio management and technology services, and independent fiduciary services.
The CCIM InstituteSince 1969, the Chicago-based CCIM Institute has conferred the Certi-fied Commercial Investment Member (CCIM) designation to commercial real estate and allied professionals through an extensive curriculum of 200 classroom hours and professional experiential requirements. Currently, there are 9,000 CCIMs in 1,000 markets in the U.S. and 31 additional coun-tries. Another 7,000 practitioners are pursuing the designation, making the institute the governing body of one of the largest commercial real estate networks in the world. An affiliate of the National Association of Realtors®, the CCIM Institute’s recognized curriculum, networking programs, and powerful technology tools such as the Site To Do Business (site analysis and demographics resource) and CCIMREDEX (commercial property data exchange), impact and influ-ence the commercial real es-tate industry. Visit www.ccim.com, www.stdbonline.com, and www.ccimredex.com for more information.
The RERC/CCIM Investment Trends Quarterly is produced by Real Estate Research Corporation (RERC) in association with and for members of the CCIM Institute.
A c k n o w l e d g e m e n t s

23Investment Trends Quarterly s Copyright© 2012 by Real Estate Research Corporation (RERC) and the CCIM Institute.
Shahid Abdulla Broadway National Bank San Antonio, TX
Grant Ackerly R.P. Hubbell and Com-pany, Inc. Northern New Jersey
Denise Adams Due Diligence Research Group, LLC Raleigh, NC
Ted Arnett Arnettt Realty & Investments Cabot, AR
Walt Arnold Sperry Van Ness Albuquerque, NM
Marc Barlow Philip M. Barlow & Asso-ciates, LLC Phoenix, AZ
Mark Belsanti Da Vinci Realty Arizona
Lydia Bennett Port of Bellingham Seattle, WA
Joe Beyer Agile Real Estate Washington, D.C.
William Biesel Biesel Investments, Inc. Dallas, TX
Ashley Bishop Southeast Venture, LLC Nashville, TN
Matt Boehlke Northco Real Estate Services Minneapolis, MN
Jared Booth Coldwell Banker Com-mercial NRT Salt Lake City, UT
Les BrouillardColdwell Banker Com-mercial / Trademark Properties
Raleigh, NC
Ernest Brown Grubb & Ellis San Antonio, TX
Bob Calvin Coldwell Banker Com-mercial NRT
Lake Havasu City/Kingman, AZ
Dean Cameron Cameron Consulting, Inc. Portland, OR
Jeff Chain Millennium Las Vegas, NV
Kent Clifford Clifford Commercial Real Estate Las Vegas, NV
Coba Craig SILVESTRI-CRAIG, Realtors Lexington, KY
Kenneth Crimmins The Blau & Berg Company Northern New Jersey
Jeremy Cyrier MANSARD Commercial Properties Boston, MA
Bob Dikman The Dikman Company Tampa, FL
Stephan Dirkes Terramar Retail Centers San Diego, CA
Carol Doherty Grubb & Ellis Las Vegas, NV
Skip Duemeland Duemelands Commercial Minneapolis, MN
Sean Durkin Andover Company Seattle, WA
Jeff Eales Birtcher Anderson Realty, LLC Orange County, CA
Max Finkle RE/MAX Renaissance Realtors Chattanooga, TN
Michael Flynn NAI Hiffman Chicago, IL
Christopher Fojo Parea, LLC Orlando, FL
John Forster Realty Works Real Estate Canada
Peter Frandano Southport Realty-River Sound, Inc. Wilmington, NC
Fred Galison GP Real Estate Miami, FL
Linda Gerchick The Robinson Group Phoenix, AZ
Jim Gibbs Aegis Realty, Inc. Tampa, FL
Chad Gleason Real Estate Investment Services Seattle, WA
Jennifer Gray Bradford CRE Services Dallas, TX
Gary Halbrooks Venue Properties, Inc. Texas
Scot Hall Wolf Realty, Inc. Phoenix, AZ
Robert Hansen, Jr. Hansen Real Estate & Investment Services Seattle, WA
Jack Harris Pacific Living Properties West Region
Edward Herbert HCR Associates Nashville, TN
Greg Herbert Northland Real Estate Eugene/Springfield, OR
Karen Higgins Westmark Commercial Lubbock TX
Scott Hileman Nye Commercial Advisors Tampa, FL
Jeffrey Hoffman JPH Realty Advisors Philadelphia, PA
C o n t r i b u t o r s

24Investment Trends Quarterly s Copyright© 2012 by Real Estate Research Corporation (RERC) and the CCIM Institute.
Gary Hunter Westlake Associates, Inc. Seattle, WA
Steve Jacquemin S.J. Financial Group St. Louis, MO
Michael JakubiecMichael P. Jakubiec Investment Real Estate, Inc.
Chicago, IL
Jody Jedele Touchstone International Properties Charlotte, NC
Gregory Johnson G. Stiles Realty Oregon
Aziz Khatri KW Commercial San Francisco, CA
Merv Killoran Reid Real Estate Seattle, WA
Kenneth Krawczyk K.S.K. Services, Inc. Milwaukee, WI
Kenneth Kujawa Century 21 Signature Realty
Saginaw, Bay City, Midland, MI
Karl Landreneau Latter & Blum New Orleans, LA
Chris Leon Realty World San Francisco, CA
Kristian Lichtenfels Johnson Capital Denver, CO
Brenda Litchfield Concord Commercial Boston, MA
Michael Lunn RE/MAX Commercial Property Solutions Chicago, IL
Gary Lyons Lincoln Harris Raleigh, NC
Stuart Mackey CBC Hathaway Group Little Rock, AR
Reni Della Maggiore Reni Della Maggiore, Inc. Sacramento, CA
Jared Martin Keller Williams Realty Fresno, CA
Howard Meier High Peak Toronto, Canada
Joe Milkes Milkes Realty Valuation Dallas, TX
Nick Miner Commercial Properties, Inc. Phoenix, AZ
Shahpour Mokhtar-zadeh
Castlerock Real Estate Services Los Angeles, CA
Marc Oram RE/MAX Commercial Associates, LLC Miami, FL
Ed Penick Coldwell Banker Com-mercial Hathaway Little Rock, AR
Daniel Poulin Sealy & Company, Inc. New Orleans, LA
Gaston Reboredo RE/MAX Commercial Associates, LLC Miami, FL
Andre Van Rens-burg
Prudential Commercial Real Estate Jacksonville, FL
Dennis Ridley TD Real Estate, LLC Denver, CO
Ryan Rients Dunham Company Sioux Falls, SD
Darrell Robb Encon Commercial Los Angeles, CA
Richard Rossiter Rossiter Commercial Real Estate, LLC Orlando, FL
Jordan Schnoll Coldwell Banker Com-mercial NRT Chicago, IL
Chris Schreiber Kiemle & Hagood Spokane, WA
Mel Schultz New Concepts Manage-ment Group Minneapolis, MN
John SchutziusIndustrial Commercial Realty and Investment Corp.
Chicago, IL
Cynthia Shelton Colliers International Orlando, FL
Randall Simonson Commercial Real Estate Co. Oregon
Tom Sivertsen Sivertsen Commercial Real Estate Tampa, FL
Thomas Songer, III Gambone, Songer & Associates State College, PA
Jon Spelman Jon W. Spelman Co. Waco, TX
Bill Stanberry Stanberry & Associates, Inc. Austin, TX
David Staruch Century 21 Jim White and Associates
Clearwater/St. Petersburg, FL
Henry Stratton Colliers International Memphis, TN
Warren Strietzel Brixmor Property Group Detroit, MI
Dewey Struble Sperry Van Ness Reno-Sparks, NV
C o n t r i b u t o r s

25Investment Trends Quarterly s Copyright© 2012 by Real Estate Research Corporation (RERC) and the CCIM Institute.
C o n t r i b u t o r s
Tom Tapia Cornerstone Realty Services Oregon
Arthur Thoma, Jr. CBC-Devonshire Realty Champaign, IL
Ronald Thompson Financial Strategies Corporation Detroit, MI
Rick Tumlin Lee & Associates Georgia
Mark Vellinga JMV Consulting, Inc. Sioux Falls, SD
Stanley Watson Watson Real Estate Detroit, MI
Casey Weiss Access Commercial Real Estate La Crosse, WI
Robert White Adams Commercial Real Estate Atlanta, GA
Charles Wiercinski McLennan Commercial Properties Chicago, IL
David L. Williamson BancorpSouth Birmingham, AL
Frank Yekaitis Frank Yekaitis Real Estate, LLC Jackson, MS
Daniel Zelonker Mizrach Realty Associates Miami, FL
Thank you to all who sharedinformation
for this report.